Introduction
Many developers and organizations embark on their journey with Continuous Integration and Continuous Deployment (CI/CD) full of optimism, yet the real-life experiences of countless developers reveal that the path to mastering CI/CD is fraught with complications, unexpected setbacks, and sometimes overwhelming obstacles. As we strip away the buzz and the lofty claims about CI/CD revolutionizing development, we often find developers entangled in tedious manual setups, scrambling to manage breakdowns in production, hindered by team silos, and grappling with complex, fragile systems.
Note: This book is currently in beta. As such, you may encounter content that is still being refined, sections that are being reorganized, or explanations that will be expanded in future updates. We welcome your feedback as we continue to improve and develop this resource.
This book is an endeavor to peel back the layers of CI/CD, moving beyond mere automation and frequent code merging. We aim to guide you through the intricacies of what CI/CD truly entails and how to implement it effectively using GitHub Actions as a practical example. While the theory of CI/CD promises streamlined operations and faster deployments, the reality involves navigating through a myriad of challenges that can stymie even the most determined teams.
Readers familiar with foundational concepts like those outlined in works such as Minimum Viable Continuous Delivery will recognize shared principles here, focusing on the essential practices for achieving CI/CD benefits. This book complements such technology-agnostic frameworks by diving deep into the practical 'how-to' using a specific, widely-used tool. Given this strong focus, consider this book a detailed guide to implementing CI/CD specifically with GitHub Actions, bridging the gap between general principles and concrete execution.
What is CI/CD?
Continuous Integration (CI)
Integration is the act of constantly merging your changes with other developers', and vice-versa. It's the act of combining multiple changes, from multiple developers, into a single, cohesive whole, regularly. All developers work on a shared codebase. The product owner or another person (internally) should be able to use your app, or another team can demo their feature--it might not be finished but the application still works as intended.
Continuous Deployment (CD) and Continuous Development (CD)
Continuous Deployment (often confused with Continuous Delivery) is the practice where every change that passes the automated tests and other confidence-inducing procedures is automatically deployed into the production environment with little to no human intervention.
Continuous Delivery, on the other hand, ensures that the code is always in a deployable state, but it may not be deployed to production automatically. Instead, it might require manual approval. It provides the business with the opportunity but not the obligation to deploy at any point. Continuous delivery is not simply an automated pipeline for on-demand deployment. For example, code in long-lived feature branches necessitates retrieving specific versions or bug fixes that require complex version control, which can disrupt other work. Or, the build requires a special ceremony, such as complex testing, an implicit contract with another service that has to be deployed in a certain order, manually run scripts, manual checks, etc. This indicates the code base is not always deployable, thus not fully meeting continuous integration principles. This also includes necessary automated testing to ensure its capacity to be deployed continuously.
Deployments are technical events managed by engineering, releasing (making those features usable by customers) is both an engineering and a business task.
CI/CD
CI/CD aims to avoid "integration hell" by ensuring continuous integration and either continuous delivery or deployment. Work is constantly merged into the main/master branch after it has been verified via code review and the continuous integration pipeline. This involves practices like trunk-based development, where all developers work on a shared branch, promoting constant integration and minimizing merge conflicts.
Aside: Some companies deploy 100 times a day, but more deploys aren't inherently better—they simply indicate a robust, automated process. Continuous deployment automatically releases every quality-approved change, reducing the gap between versions. This means smaller changesets, easier bug identification, and faster rollbacks, all of which help minimize profit loss. Ultimately, frequent deploys reflect strong operational practices and many quality measures, not a superior app.
A misunderstanding of CI/CD is that it's just a build pipeline that continually builds the software. CI/CD requires both technical and cultural shifts, including:
-
Smaller work units: Breaking down features into independently deployable and testable components. This allows the features to be continually deployed, or behind a feature flag, while other features are being worked on. If all features are large and are on their own feature branch, then this defeats the point of CI/CD as the feature has not yet been integrated, that is, it does not co-exist with the rest of the application. Other developers are unable to build around it, and feature flagging is not possible. Idea transmission is still possible, and it is a myth that developers do not communicate with each other if not practicing CI/CD.
-
Modular codebase: Facilitating localized changes without impacting the entire application. This allows other developers to not be blocked while a parallel feature is in development.
-
Focus on rapid feedback: Prioritizing quick delivery of changes and gathering customer insights. If there is no need for fast customer feedback or to test changes, then moving to CI/CD becomes less important.
These shifts require that the application itself is modular and easy to modify, therefore, it could require code changes, depending on your application.
Some cases, such as rewriting the app to use another framework, may require feature branching or interrupting others' work.
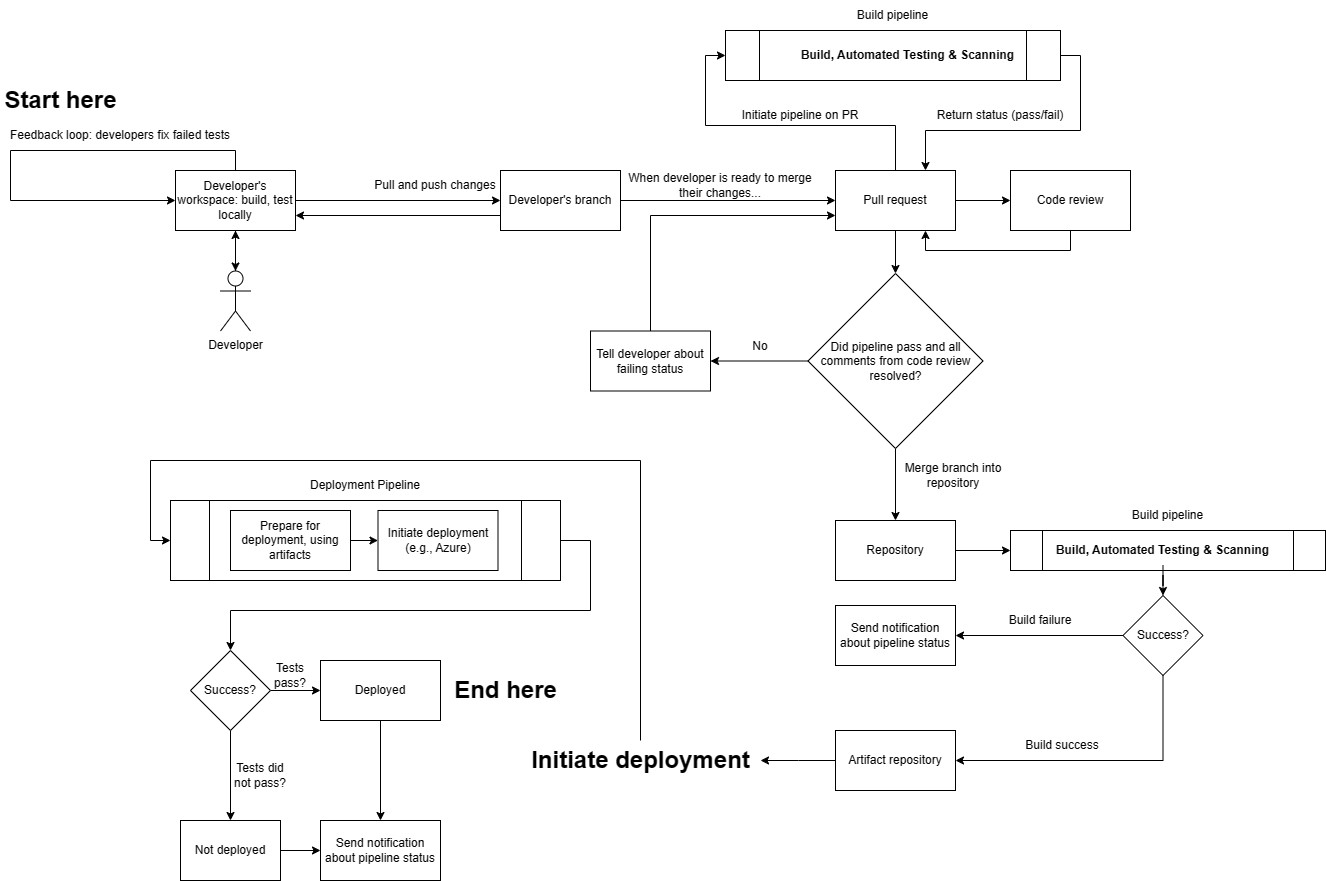
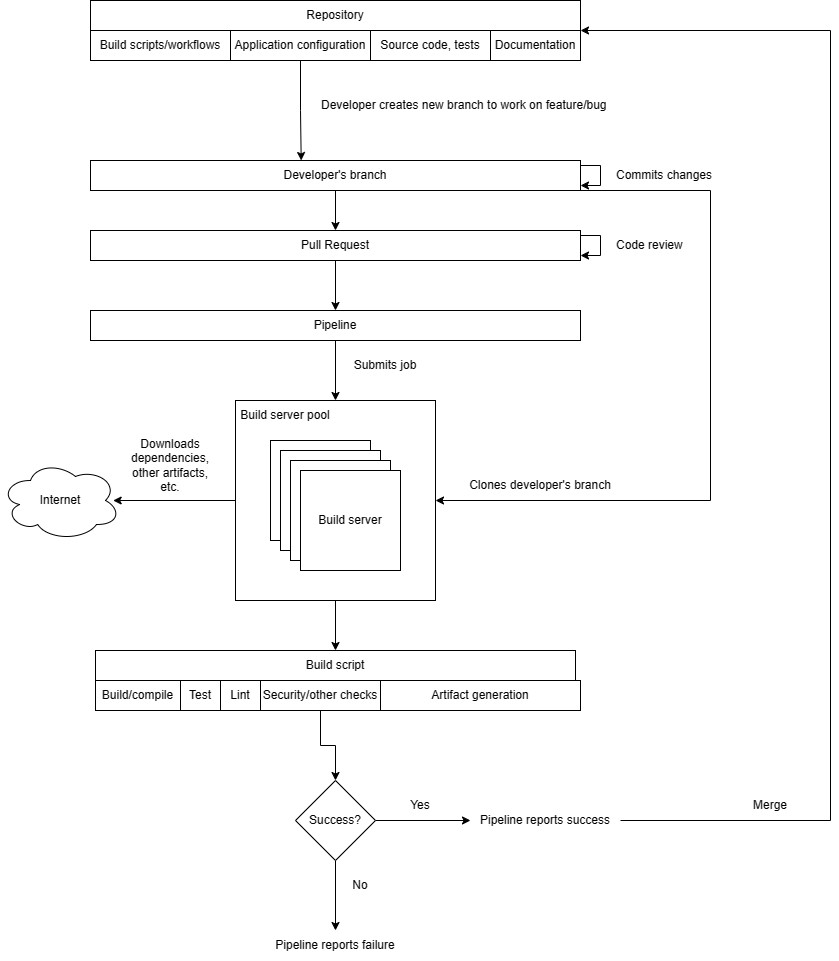
Here is what the software development process looks like when using CI/CD. Note that many of these processes are automated.
Why is CI/CD important?
There are many reasons why a company or a project may use CI/CD. Core Benefits:
-
Faster Development and Deployment: CI/CD enables rapid deployment of small changes, accelerating development and deployment cycles, allowing businesses to be more agile and responsive to customer needs.
-
Improved Code Quality: Continuous integration, automated testing, and code review practices built into CI/CD processes lead to higher-quality code and more reliable software.
-
Increased Collaboration and Transparency: CI/CD encourages collaboration between developers, operations, and QA teams, fostering shared understanding and transparency throughout the development lifecycle.
-
Decoupling of Integration, Deployment, and Release: CI/CD separates these stages, allowing for flexibility in releasing features and testing in production without impacting users.
-
Enhanced Confidence in Changes: Automated testing and build pipelines provide developers with a higher level of confidence in their code, reducing the risk of introducing bugs.
-
Improved Estimation Accuracy: By deploying frequently, teams gain a better understanding of the development process, leading to more accurate estimations.
-
Streamlined Workflow: Automation eliminates manual processes, smoothing workflows, and allowing developers to focus on core development tasks.
-
Support for Experimentation and Innovation: Feature flags enable controlled experimentation and incremental rollouts, allowing teams to test new features and gather feedback without risking the entire application.
Despite these benefits, several challenges can hinder successful CI/CD implementation:
-
Zero-Downtime Deployments: Achieving seamless deployments while managing resources and data integrity requires strategies like blue-green deployments, canary releases, and feature flags.
-
Database Schema Impacts: Even small code changes can disrupt database schemas, necessitating schema migration tools and a disciplined approach to database management.
-
Central Point of Failure: CI/CD creates a central point of failure that demands constant vigilance. Maintaining a "green" pipeline requires rigorous testing, code review, and ongoing maintenance to ensure stability and compliance. Do not rubber stamp PRs.
-
Culture Shift: CI/CD requires a shift in mindset, emphasizing collaboration, shared responsibility, and open communication across teams. This will exaggerate any communication issues, if they exist.
-
Continuous Learning: Teams must invest in ongoing training, keeping their skills up-to-date with evolving CI/CD technologies and security best practices.
-
Clear Objectives: A lack of clarity regarding CI/CD goals can lead to resistance and misaligned expectations. It's crucial to define objectives, communicate the value proposition, and secure stakeholder buy-in.
CI/CD is not a magic bullet. It demands discipline, commitment to quality, and a proactive approach to addressing technical and organizational challenges. However, when implemented effectively, it can significantly accelerate development, enhance software quality, and empower teams to deliver value more efficiently.
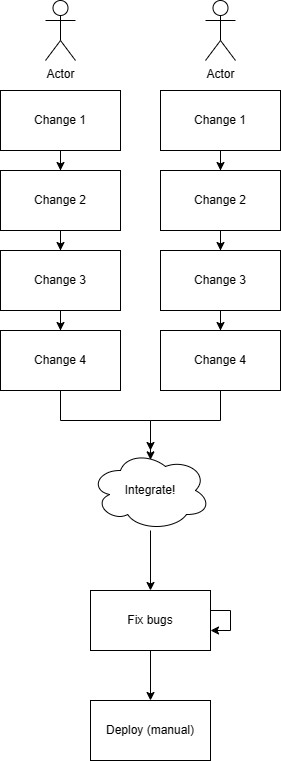
Traditional software development
Traditional software development is a methodology that is difficult to define because there's multiple definitions of what traditional means. This usually means before continuous integration and development was widely popularized, for example prior to 2010.
Traditional Development:
-
Teams often work in silos with limited visibility into each other's work. This does not mean that team members do not communicate with each other, rather, the act of integration is delayed.
-
Slow feedback loops and long development cycles are common.
-
Manual integration and deployment processes are complex and resource-intensive.
-
Late-stage testing limits opportunities for early customer feedback.
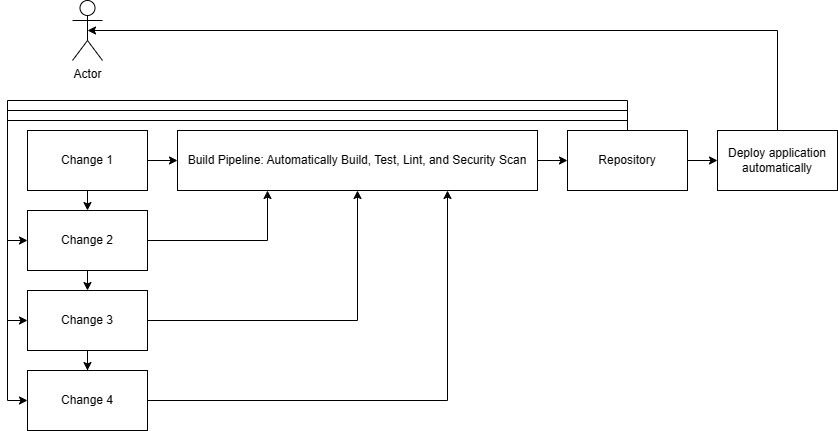
CI/CD Development:
-
Promotes continuous collaboration and transparency through practices like trunk-based development.
-
Enables rapid feedback loops and iterative development with frequent integrations and deployments.
-
Automates builds, tests, and deployments, freeing developers to focus on core tasks.
-
Allows controlled feature rollouts and early customer feedback through feature flags.
The build server or build pipeline
A build server or, more accurately, a build runner or agent, is the environment where automated CI/CD tasks like building, testing, and scanning are executed. While the underlying host machine might be a virtual machine (especially for cloud-provided runners like GitHub's ubuntu-latest), the actual build often runs inside a container. This containerized approach provides a consistent, isolated environment with all necessary tools and dependencies, ensuring reproducibility and acting as a quality gatekeeper for the CI/CD workflow. The runner executes instructions defined in the workflow configuration file.
Build runners/agents are used instead of developer workstations because:
-
Security: These servers handle sensitive resources like company source code and secrets. It is crucial to secure them to prevent unauthorized access and protect against lateral attacks. Simply storing them on a developer's machine means that other software could use the secrets, the secrets are transmitted over other mediums, etc.
-
Consistency and Isolation: Each server, agent, or VM should operate independently to minimize the impact of potential compromises. The agent only runs for a fixed amount of time, then is erased. Developer machines are long-lived, and could have lots of software unnecessary for building the application.
Automation
Automation is essential for CI/CD, streamlining tasks like builds, deployments, and testing. This saves time, improves efficiency, and ensures consistency and reliability, crucial for frequent deployments. However, over-automation can be detrimental, especially for tasks requiring human judgment or adaptability.
The key is to find the right balance, automating repetitive tasks while retaining human oversight for critical decision-making and complex scenarios. Robust error handling and clear guidelines for human intervention are crucial for successful automation.
Trust in automation: Part I. Theoretical issues in the study of trust and human intervention in automated systems. Ergonomics, 37(11), 1905--1922 | 10.1080/00140139408964957
A model for types and levels of human interaction with automation. IEEE Transactions on Systems, Man, and Cybernetics - Part A: Systems and Humans, 30(3), 286--297 | 10.1109/3468.844354
Testing, code review, and quality assurance
Testing and quality assurance are crucial for CI/CD, ensuring software quality and confidence in deployments. While both automated and manual testing play vital roles, they address different aspects:
-
Automated Testing: This process verifies functionality and performance through predefined tests, similar to controlled experiments, providing rapid feedback on code changes. Imagine a chemistry teacher at the front of a classroom, mixing two chemicals and instructing students to watch closely. This scenario serves as an example of a demonstration because the outcome is known beforehand, akin to how these tests predictably assess the impacts of changes in the code.
-
Manual Testing: Leverages human judgment for evaluating usability, aesthetics, and user experience, crucial for aspects difficult to automate.Humans should not be doing the checking aspect.Rather, automated testing should be responsible for that.
-
CI/CD emphasizes automation but doesn't eliminate the need for manual testing. Instead, it allows testers to focus on higher-level tasks requiring human expertise. Maintaining a balance between automated and manual testing is key for efficient, high-quality software development.
-
Skipping quality assurance in CI/CD can be tempting due to the fast-paced nature, but it's essential for ensuring customer satisfaction and protecting the business's reputation.It is additionally very tempting because the lack of automation will not show up for quite some time.
Aside: fire QA, right?! Well, no. QA shifts left, and instead prioritizes testing PRs (which have a smaller scope and smaller changeset.) Since checking (testing an outcome that is known) is done mostly via unit tests, QA can use their human-ness to evaluate the product for quality, usability, functionality, and exploration testing. When a feature is developed under a feature flag, QA can test it in the pre-production environment (feature flag enabled for them), allowing developers to get early feedback.
Rapid Feedback Loops
The essence of CI/CD lies in maintaining business agility through a fast feedback loop. This allows companies, especially startups and small businesses, to rapidly experiment, identify what works, and make quick improvements.
Rapid feedback loops are a multi-pronged approach:
-
Streamlined Local Testing: Developers need easily accessible local testing environments mirroring production. Tools like hot reloading and ephemeral test environments with simple provisioning are crucial.
-
Efficient Build Pipeline: Aim for a build time under 15-20 minutes with automated processes, notifications for failures, and minimal manual intervention.This period of time is arbitrary. However, if the build time is too long, then there's a possibility of frustrating developers as well as not being able to quickly react to feedback from your customers.You will also make it more difficult to quickly push changes should there be a production outage.
-
Timely Code Reviews: Prioritize prompt and thorough PR reviews (ideally within a day) with constructive feedback and a focus on code readability.
-
Regular Deployments: Embrace semi-regular deployments to accelerate feedback loops and customer value delivery (refer to DORA metrics).
-
Comprehensive Monitoring & Alerting: Implement robust monitoring in all environments to detect issues early. Define a severity matrix for appropriate stakeholder notifications, escalating critical incidents promptly.
Infrastructure as Code and modularity
To achieve continuous integration and efficient deployments, it's essential to structure applications so that small changes are manageable. This involves both the application itself and its underlying infrastructure. If making small changes is cumbersome, integration becomes challenging, as larger updates can span multiple components, increasing both the testing burden and the associated risks.
-
Independent Modules: Structure applications with clear boundaries between components. This facilitates isolated changes and reduces testing complexity. This isn't the fact that you must adopt microservices, rather it's just structuring your code to be a modular approach. Modularity leads to smaller, more manageable changes, simplifying testing and increasing development speed.
-
Version-Controlled Infrastructure: Treat infrastructure configurations like code, storing them in version control systems for tracking, reverting, and collaboration.Your application. This could be terraform templates or ARM templates.
-
Eliminate configuration inconsistencies between development, testing, and production, preventing "snowflake servers" and ensuring reliable deployments.
Feature Flags
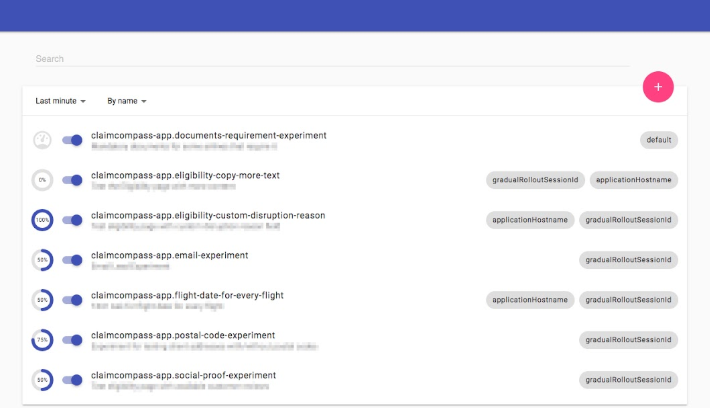
Feature flags are for experimentation and release. They separate the act of deploying (moving the code to production, managed by engineering) and the act of making the changes usable by customers (commonly associated with a marketing event from the business's side.) They are remote-controlled conditional statements that allow the selective activation or deactivation of application functionalities across different environments (development, integration, pre-production, production) without needing a redeployment. These flags can be toggled within seconds or minutes and can be set based on criteria like geographic location, IP address, or user type, facilitating targeted and gradual feature rollouts.
What exactly constitutes a feature or needs to be released via a feature flag is up to the product managers and the business. Usually not everything is behind a feature flag, for example, features that cannot be code compiled, those that are incomplete to the extent that they have security issues that could harm the product, logging statements, refactors, package upgrades, security fixes, bug fixes, or small changes like typo fixes.
Typically, developers can enable these feature flags by themselves. Here's an example of an application in development, and it shows a special development overlay that allows developers to toggle feature flags.
Implementing feature flags in React with Unleash - Case Study (claimcompass.eu)
Feature flags need not be complicated or require third-party software. You can get started with a simple JSON file with a list of key/value pairs that is outside of the deployment system, but still accessible by your app. This does not require any subscription to a feature flag service. They can also be embedded in your application, for example, in a config file. This approach limits flexibility, however, as a redeployment is needed to change the config file.
This approach is beneficial for trunk-based development, where changes are incremental. Developers can merge new features behind feature flags, allowing others to activate these flags for testing selectively.
Feature flags also enable controlled risk-taking. For example, a promising feature might be released to a small user segment (e.g., 1%) to evaluate performance and gather feedback, minimizing risks of broader release.
Branches versus Feature Flags:
Branches provide isolated workspaces for developers, supporting multiple application versions or development paths. However, unlike branches that delay integration, feature flags allow for integration while controlling feature activation.
Limitations:
Feature flags should not be used to restrict feature access (for example, paid features), as they are often visible and modifiable on the client-side. They are better suited for testing, phased rollouts, and controlled changes.
Maintenance:
Proper feature flag management is crucial. Unused flags should be removed to avoid clutter and potential confusion. Limiting the number of active feature flags helps reduce code complexity and ease debugging.
Summary table,
| Aspect | Branching | Feature Flags |
|---|---|---|
| What It Is | Managing and isolating code changes in separate lines of development. | Tools for remotely controlling the visibility of new features in the production environment. |
| Main Actions | Changes stay within the branch. To make changes visible, merge, copy, squash, or rebase onto a production-bound branch (like trunk/master). | Allowing code changes to exist in production without being visible to everyone. Can be enabled for specific users or scenarios. |
| Visibility to Customers | Changes are not visible to customers unless the branch is deployed to production. Testing in environments like test, dev, experimental is possible. | Feature flags are crucial in managing what customers see in production. They hide or reveal new features based on their status. |
| Specific Considerations | Recommended to deploy the main or trunk branch to production, especially in TBD (trunk-based development). Branches are ideal for testing and isolated development. | Feature flags should be used judiciously, as overuse can complicate application maintenance. They are intended to be temporary and should not replace good branching and merging strategies. |
Version Control System (VCS)
Version control systems are crucial for continuous integration and development because they track changes, simplifying the integration process. For instance, if you have two versions of a document, merging them into one requires a detailed comparison of each word. This task involves identifying and understanding changes. Version control automates this process, significantly reducing the likelihood of errors associated with manually tracking changes. This automation ensures smooth and accurate integration of code changes, forming a cohesive whole.
VCSes show that work has been integrated because it is considered a central source of truth. Multiple copies of the application with different versions mean that there isn't a single source of truth, therefore, we can't know if our changes have been integrated.
VCSs enhance auditability, allowing developers to easily trace back to see when and why code was altered. This is particularly important from a security perspective to ensure that only authorized changes are made. For example, if unauthorized changes occur, they can be quickly identified and reverted.
Culture and communication, collaboration
While CI/CD tools automate integration and deployment, successful implementation requires more than just technology. It demands a fundamental shift in organizational culture and project management.
CI/CD thrives on:
-
Collaboration and Communication: Teams must work closely, sharing information and coordinating efforts to ensure smooth integration and deployment.
-
Rapid Iteration: Frequent code merges, small feature updates, and continuous feedback loops are essential for maximizing the benefits of CI/CD.
-
Strategic Project Management: Breaking down features into manageable, independently testable units facilitates continuous integration and deployment without disrupting the entire application.
Ignoring the human element of CI/CD can lead to challenges:
-
Batched Changes and Integration Conflicts: Infrequent code merges increase the risk of complex integration issues.
-
Delayed Feedback: Waiting to test in production hinders rapid iteration and learning.
-
Siloed Information and Debugging Difficulties: Poor communication can lead to significant debugging challenges.
CI/CD is not a one-time setup. It requires ongoing maintenance, pipeline updates, and continuous learning to adapt to evolving practices. Effective testing, code reviews, and organizational support for these processes are vital for maintaining a smooth development cycle.
Continuous Deployment/Continuous Delivery
Infrastructure as Code (IaC) represents a transformative approach in managing and provisioning computing resources, utilizing machine-readable definition files rather than traditional physical hardware setups. This automation-focused methodology enhances the setup, configuration, and management of infrastructure, promoting rapid deployments, efficient resource utilization, and consistent, reliable environments. IaC is mainly declarative, targeting the desired end state of the infrastructure while the underlying tooling manages the execution. This is crucial in Continuous Deployment (CD) pipelines where IaC templates are automatically deployed in the cloud, ensuring each deployment is consistent, reproducible, and easily reversible. This aligns with principles like idempotency, immutability, and composability---key for maintaining interoperable and stable components.
The benefits of adopting IaC are extensive, including consistent infrastructure deployments across environments, enhanced reproducibility, and robust version control which acts as a single source of truth. Such structured deployments reduce configuration drifts between different environments such as QA/dev and production, speeding up the feedback loop for developers and boosting security measures. Tools such as Terraform offer cloud-agnostic deployment options, whereas AWS CloudFormation, Azure Resource Manager, and Google Cloud Deployment Manager cater to specific cloud environments. Additionally, open-source tools like Ansible and traditional configuration management tools like Chef and Puppet provide further automation capabilities, ensuring thorough enforcement of system states.
Historically, server management was a manual process involving system administrators physically logging into servers to apply changes, a method prone to errors and inconsistencies, especially in complex server environments. This labor-intensive process made replicating servers difficult, often requiring extensive documentation and manual reconfiguration. Before the adoption of IaC, administrators relied on shell scripts to manage and synchronize server configurations, though these scripts were limited in handling complex scenarios effectively. The rise of configuration management tools in the mid-to-late 2000s, such as CFEngine, Puppet, and Chef, began to address the issue of "snowflake servers"---highly customized servers difficult to replicate from scratch. Despite the advancements, many continued using shell scripts and command-line tools for their simplicity and familiarity. Today, IaC practices, exemplified by Terraform and other cloud-specific tools, have largely superseded these older methods, providing scalable, reliable, and repeatable server environment setups.
provider "aws" {
  region = "us-west-1"
}

resource "aws_vpc" "sample_vpc" {
  cidr_block = "10.0.0.0/16"
  ... // Additional configurations
}

resource "aws_subnet" "sample_subnet" {
  vpc_id     = aws_vpc.sample_vpc.id
  cidr_block = "10.0.1.0/24"
  ... // Additional configurations
}

resource "aws_instance" "sample_ec2" {
  ami           = "ami-0c55b159cbfafe1f0"
  instance_type = "t2.micro"
  subnet_id     = aws_subnet.sample_subnet.id
  ... // Additional configurations
}
Providers and hosting
Providers fall into two overlapping categories: CI/CD tooling and application hosting infrastructure. You can mix and match—for example, use GitHub Actions for CI/CD while hosting your application on AWS, Azure, or Google Cloud. Sticking with a provider you already have a contract with can streamline integration with your security policies.
CI/CD Tools:
- GitHub Actions: Built into GitHub for automated build, test, and deployment workflows.
- GitLab CI/CD: An integrated solution with built-in CI/CD and version control.
- Jenkins: A flexible, open-source automation server with a vast plugin ecosystem.
- CircleCI: A cloud-based service known for ease of integration, Docker support, and parallel builds.
- Azure DevOps: A comprehensive suite covering planning, coding, building, and deploying.
- Bitbucket Pipelines (Atlassian): Integrated CI/CD service within Bitbucket Cloud, offering a cloud-native alternative.
- Travis CI: A hosted service that integrates well with GitHub and Bitbucket.
Infrastructure Providers:
- AWS: Offers comprehensive cloud services with CI/CD tools like CodePipeline and CodeBuild.
- Azure: Provides robust hosting alongside Azure Pipelines and other DevOps services.
- Google Cloud Platform: Features Cloud Build and strong support for containerized workflows.
- IBM Cloud: Delivers end-to-end DevOps toolchains integrated with popular tools.
- DigitalOcean: A straightforward platform that supports Kubernetes and common CI/CD integrations.
Terminology
This book is somewhat focused on GitHub Actions, but tries to provide a provider-agnostic view. Some of the terms might be a bit different depending on your CI/CD provider. Here is a table that helps clarify.
| Definition | Generic Term | Jenkins | GitHub Actions | GitLab CI/CD | CircleCI |
|---|---|---|---|---|---|
| Build Step: A single CI/CD task (e.g. compile, test, deploy). | Build Step | Build Step | Job | Job | Job |
| Environment: The runtime setup (OS, tools, variables, network). | Environment | Node | Runner | Runner | Executor |
| Workflow: A series of tasks defining the build process. | Workflow | Pipeline | Workflow | Pipeline | Workflow |
| Trigger: An event (commit, PR, schedule) that starts the pipeline. | Trigger | Build Trigger | Event | Trigger | Trigger |
| Secrets: Sensitive data (passwords, tokens, keys) used securely. | Secrets | Credentials | Secrets | Variables | Environment Variables |
| Container: An isolated package with code, runtime, and tools. | Container | Agent/Docker Agent | Container | Docker Executor | Docker |
| Configuration: Files specifying build settings (e.g. YAML). | Configuration | Jenkinsfile | .github/workflows/* | .gitlab-ci.yml | .circleci/config.yml |
| Artifacts: Files produced by the build (binaries, docs, containers). | Artifacts | Build Artifacts | Artifacts | Artifacts | Artifacts |
| Cache: Stored build data (dependencies, compiled code) for faster runs. | Cache | Workspace | Cache | Cache | Cache |
| Parallelism: Running multiple tasks concurrently to speed builds. | Parallelism | Parallel Builds | Matrix Builds | Parallel Matrix | Parallel Jobs |
| Build Status: Indicator of build success or failure. | Build Status | Build Status | Build Status | Build Status | Build Status |
What's Happening in the Pipeline
After tasks are broken down, developers implement them and open a pull request (PR). This triggers a CI pipeline (build, test, lint). The pipeline must succeed before the PR is merged.
A successful CI run publishes build artifacts to an artifact repository. At this stage, artifacts exist but are not yet customer-accessible.
A deployment pipeline (CD) promotes a selected artifact to an environment using infrastructure as code (IaC) so infrastructure and configuration are reproducible (avoid "snowflake" machines).
CD can deploy work-in-progress safely when the feature is gated behind a feature flag (code can be present in production but inactive).
Common rollout strategies:
- Blue/green: two environments (blue = current, green = new) for zero-downtime cutover.
- Incremental/canary: release to a subset first, then gradually increase exposure.
Deployment does not necessarily mean release: deploy, deliver, and release are distinct concepts in modern pipelines. Post-deploy, use continuous monitoring so issues can be detected quickly and rollbacks can occur if needed.
Common Steps in Build and Deploy Workflows
- Trigger: pipeline runs on events (PR opened, merge to main, etc.).
- Checkout and dependencies: runner checks out repo and restores dependencies from trusted sources.
- Compilation/build: compile/transpile where applicable (language-dependent).
- Linting/static analysis (optional): style, quality, and some bug patterns.
- Automated tests: unit, integration, and end-to-end tests.
- Artifact publishing: publish immutable build outputs to an artifact repository.
- Deployment: select an artifact and deploy to the target environment (often with additional checks).
Adopting CI/CD Incrementally
Ensure the codebase is in version control and can be built from the command line before automating anything. Then start with a basic pipeline that builds and notifies on failure. Treat the pipeline as production infrastructure: a broken pipeline must be fixed immediately.
Add capabilities incrementally:
- Static analysis
- Unit tests (start with new code and high-risk areas)
- Formatting enforcement
- Metrics and dashboards (build time, artifact size, coverage)
A simple Makefile can be an effective first step for projects where the build involves multiple compiled targets:
main.o: main.c mathFunctions.h utilFunctions.h
	gcc -c main.c

utilFunctions.o: utilFunctions.c utilFunctions.h
	gcc -c utilFunctions.c

mathFunctions.o: mathFunctions.c mathFunctions.h
	gcc -c mathFunctions.c
Further readings
Thanks for reviewing my book!
What I am looking for:
- Sections that should be removed (have no relevance to the book at all), added, or are debatable (provide a case study or references).
- What sections you'd like me to write more about, what sections are neutral, and what sections are boring.
- High-level overview of any organization changes (e.g., rearranging the sections in the table of contents).
- Technical inaccuracies (when possible).
- Changing the table of contents to better align with the audience.
- Whether you would recommend this book to your friends (I promise I won’t hold you to it).
- Whether the current table of contents may be sufficient to meet the page count goal, or I may need to write more about other sections.
What I am not looking for as much:
- Spelling, grammar, or formatting, unless formatting makes the text unreadable.
- Nit-picks.
Target Audience: Software developers, system administrators, and DevOps professionals with 1-3 years of experience, seeking to implement efficient CI/CD practices in startups and small businesses.
Focus: This practical guide provides a streamlined approach to setting up and managing CI/CD pipelines with limited resources, emphasizing business needs and rapid deployment.
Key Features:
- Advanced Beginner/Intermediate Level: Goes beyond introductory concepts, catering to developers with existing programming, testing, and Git experience.
- Cost Management Strategies: Practical tips for optimizing runner usage, leveraging free tiers, and avoiding unexpected billing.
- GitHub Actions Focus: Detailed walkthroughs and pitfalls of GitHub Actions, with a brief overview of other CI/CD providers.
- Efficient Pipeline Setup: Streamlined workflows, avoiding common pitfalls and unnecessary debugging, with a focus on business value.
- Trunk-Based Development: Emphasis on frequent deployments and rapid integration, with concise mentions of alternative branching strategies.
- Security Best Practices: Basic security scanning tools and techniques, secrets management, and prioritization of security alerts (e.g., Dependabot).
- Effective Testing Strategies: Writing impactful tests, managing manual testing, and aligning test strategies with business goals.
- Practical Deployment and Monitoring: Deploying updates quickly, handling rollbacks, and understanding the importance of continuous monitoring.
- Automation vs. Manual Processes: Identifying what to automate and what to keep manual in a dynamic startup environment.
- Real-World Context: Touches on Agile methodologies, regulatory considerations (e.g., FDA), and the HP case study for embedded systems.
- Emphasis on Practicality: Real-world scenarios, such as receiving phone alerts for production issues, and adapting CI/CD to dynamic environments.
This book provides the essential knowledge and practical skills needed to successfully implement and manage CI/CD, empowering developers to streamline their workflow, accelerate deployments, and improve software quality.
Book will have about 350 pages when complete.
Getting started with the workflow
In order to have a good understanding of how CI/CD works, it's important to have a good idea of how everything fits in together. Here's the overall process, at a very high level view, from working on a feature to getting it out into production.
| Development Stage | Sub-Stage | Description |
|---|---|---|
| Planning & Design | Define Work Item | Identify and document features, tasks, or bugs to be addressed. Example |
| Prioritization & Scheduling | Decide on the priority of the work item and when it will be addressed. Example | |
| Development | Code Implementation | Writing the actual code and implementing features or bug fixes. Example |
| Local Testing & Verification | Run unit tests and perform manual testing to verify code behavior on a local dev environment. Example | |
| Code Submission | Create Pull Request (PR) | Submit the code for review. Example |
| PR Awaiting Review | Time period the code waits to be reviewed. Example | |
| Code Review | Peer Code Review | Team members review the code for quality, functionality, and style. Example |
| Feedback Incorporation | Apply changes based on code review feedback. Example | |
| Build & Integration (CI) | Build Initialization | Setup for build environment and dependencies. Example |
| Core Build Process | Compilation, linking, and creation of executable files. Example | |
| Security & Compliance Scan | Scan for security vulnerabilities and compliance issues. Example | |
| Automated Testing (CI) | Test Initialization | Setup for testing in an isolated environment. Example |
| Execute Automated Tests | Run automated test suites. Example | |
| Deployment (CD) | Canary Deployment | Deploy to a subset for monitoring and testing. Example |
| (Coming up next) | Monitor & Validate | Monitor and validate new features. Example |
| Full Production Deployment | Roll out to the entire production environment. Example |
Developers create short-lived branches for their work:
-
This isolates their changes from the main codebase ("trunk") and allows collaboration with other developers.Short lived in this context refers to just the minimal amount of time needed to work on that particular task and no more.This means that the tasks have to be broken down sufficiently as well as broken down in such a way where the tasks are easy to complete and don't interfere necessarily with other commits. They're also testable as well, capable of showing that they can have the capacity to be integrated. You can look at the appendix For more information on how to break down tasks into such a way that makes them.To show that they've been integrated successfully.
-
Branches can be created locally or through GitHub's UI.
Pull requests (PRs) are used to merge code into the trunk:
-
Developers create PRs when they're ready to integrate their changes.They create the PR from their branch.
-
This triggers a pipeline that builds, tests, and runs the code to ensure quality.The pipeline and its trigger must be set up by developers beforehand. By default it does not do this.
-
PRs require review and approval before being merged.Normally to approvers are required, but it depends on your team.At least one approver should approve.
Merging PRs updates the trunk:
-
This makes the changes available to all developers.
-
Developers need to pull the latest changes into their branches to stay up-to-date.This is not a requirement as when you create the PR it will automatically merge their branch into the trunk when building.However, it's recommended that developers pull their latest changes to keep up to date because the merge might be different than what they tested locally, potentially introducing the possibility of bugs.
Branch Management:
-
Short-lived branches are typically deleted after merging.
-
Long-lived branches are useful for experiments and large refactorings, such as migrating frameworks (e.g., Spring to Hibernate). However, these situations are infrequent. Most development (90-95%) utilizes short-lived branches to ensure continuous integration, cohesion, and comprehensive testing.
-
Descriptive branch names, including developer IDs (e.g., "username/feature-name"), improve organization and maintenance. This convention aids in automatic categorization within popular CI/CD platforms like Azure DevOps, grouping branches into logical directories.
Build Server:
-
The build server clones the developer's branch associated with the PR and builds the code.In this case the build server is provided to you by GitHub Actions, but you can also use a self hosted runner yourself.
-
This ensures that the changes are compatible with the existing codebase.It's important to write good tests as well as making sure that the bell script is up to date to make sure that the pipeline sufficiently instills confidence in your changes. The build pipeline is only as useful as the effort and criteria that you put into it. It is not magical.
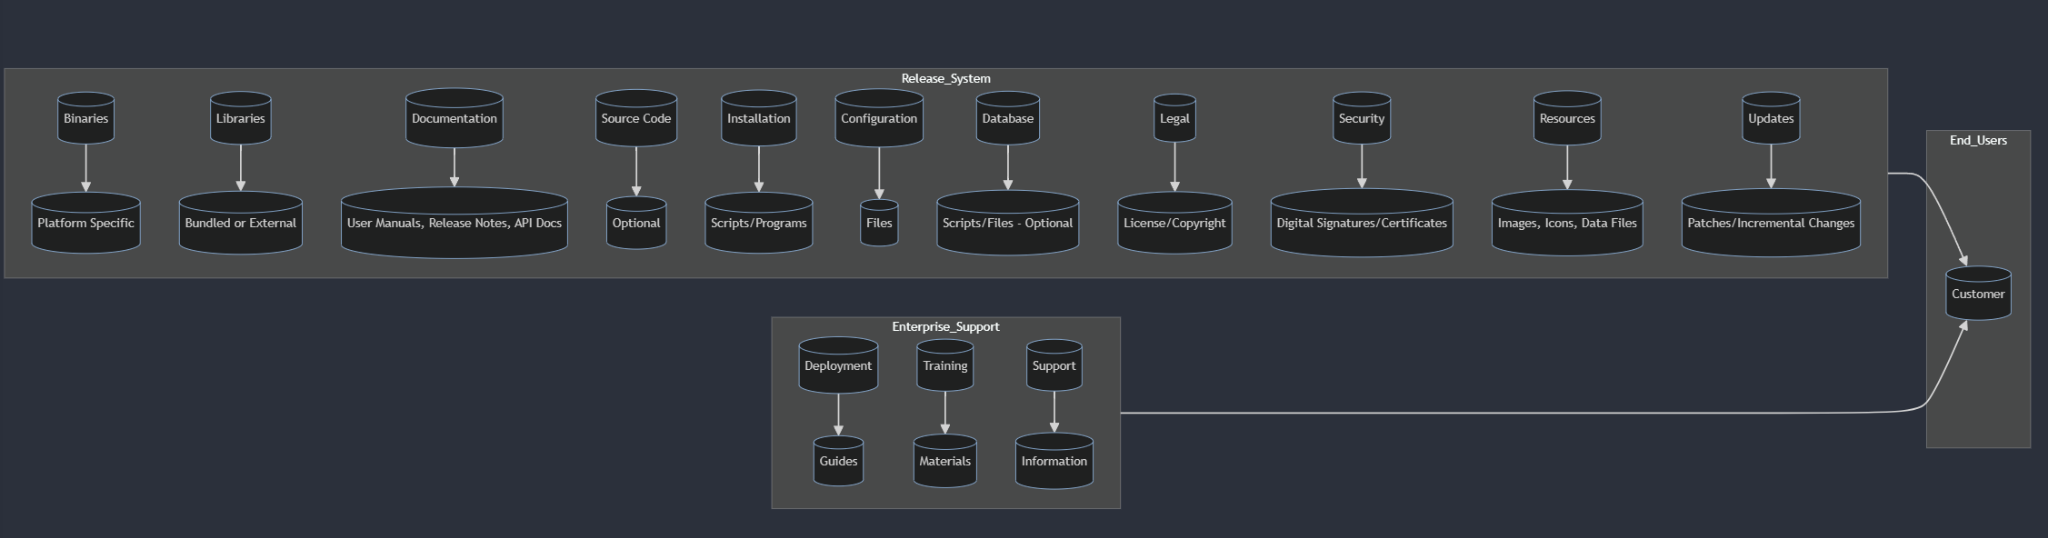
What is a repository?
-
A repository is a way to store a collection of files that are used in the build process, and should include all files that allow the application to be built, including configuration files, database migrations, tests, etc. Developers work off of a branch, which is a snapshot of the repository. Each repository is usually a deployable unit, and normally should not include other projects unless they are part of the same application or must be deployed together. It is managed with a VCS (e.g., Git.)
-
However, it should not include environment-specific files, secrets (such as passwords), API keys, or files specific to a single developer's environment because these are typically injected at runtime, and should not be part of the application, as they could be erroneously leaked to production.Normally injected at runtime. Do not inject it in your continuous integration and development server.
-
Also, if a single developer's settings are in the repository, it's not much use for the other developers and could cause confusion.
Typical development scenario using VCS
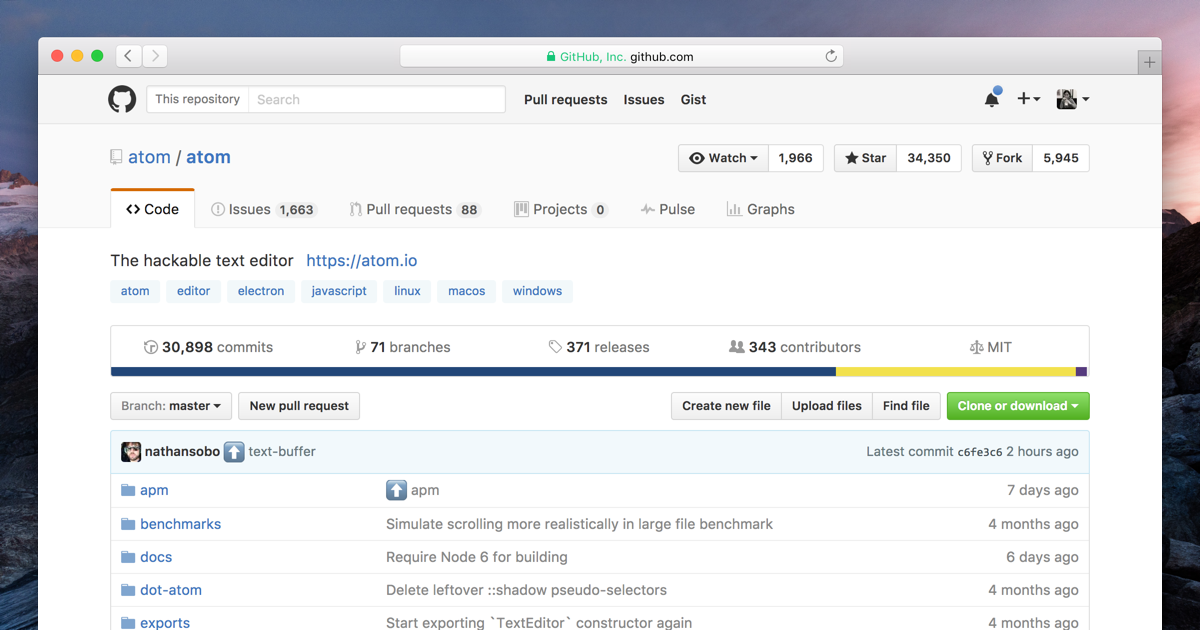
A developer works on code using their IDE, on their development branch, from their repository as shown in this screenshot. This is the code repository as discussed earlier. VS Code is a free IDE that is open source.
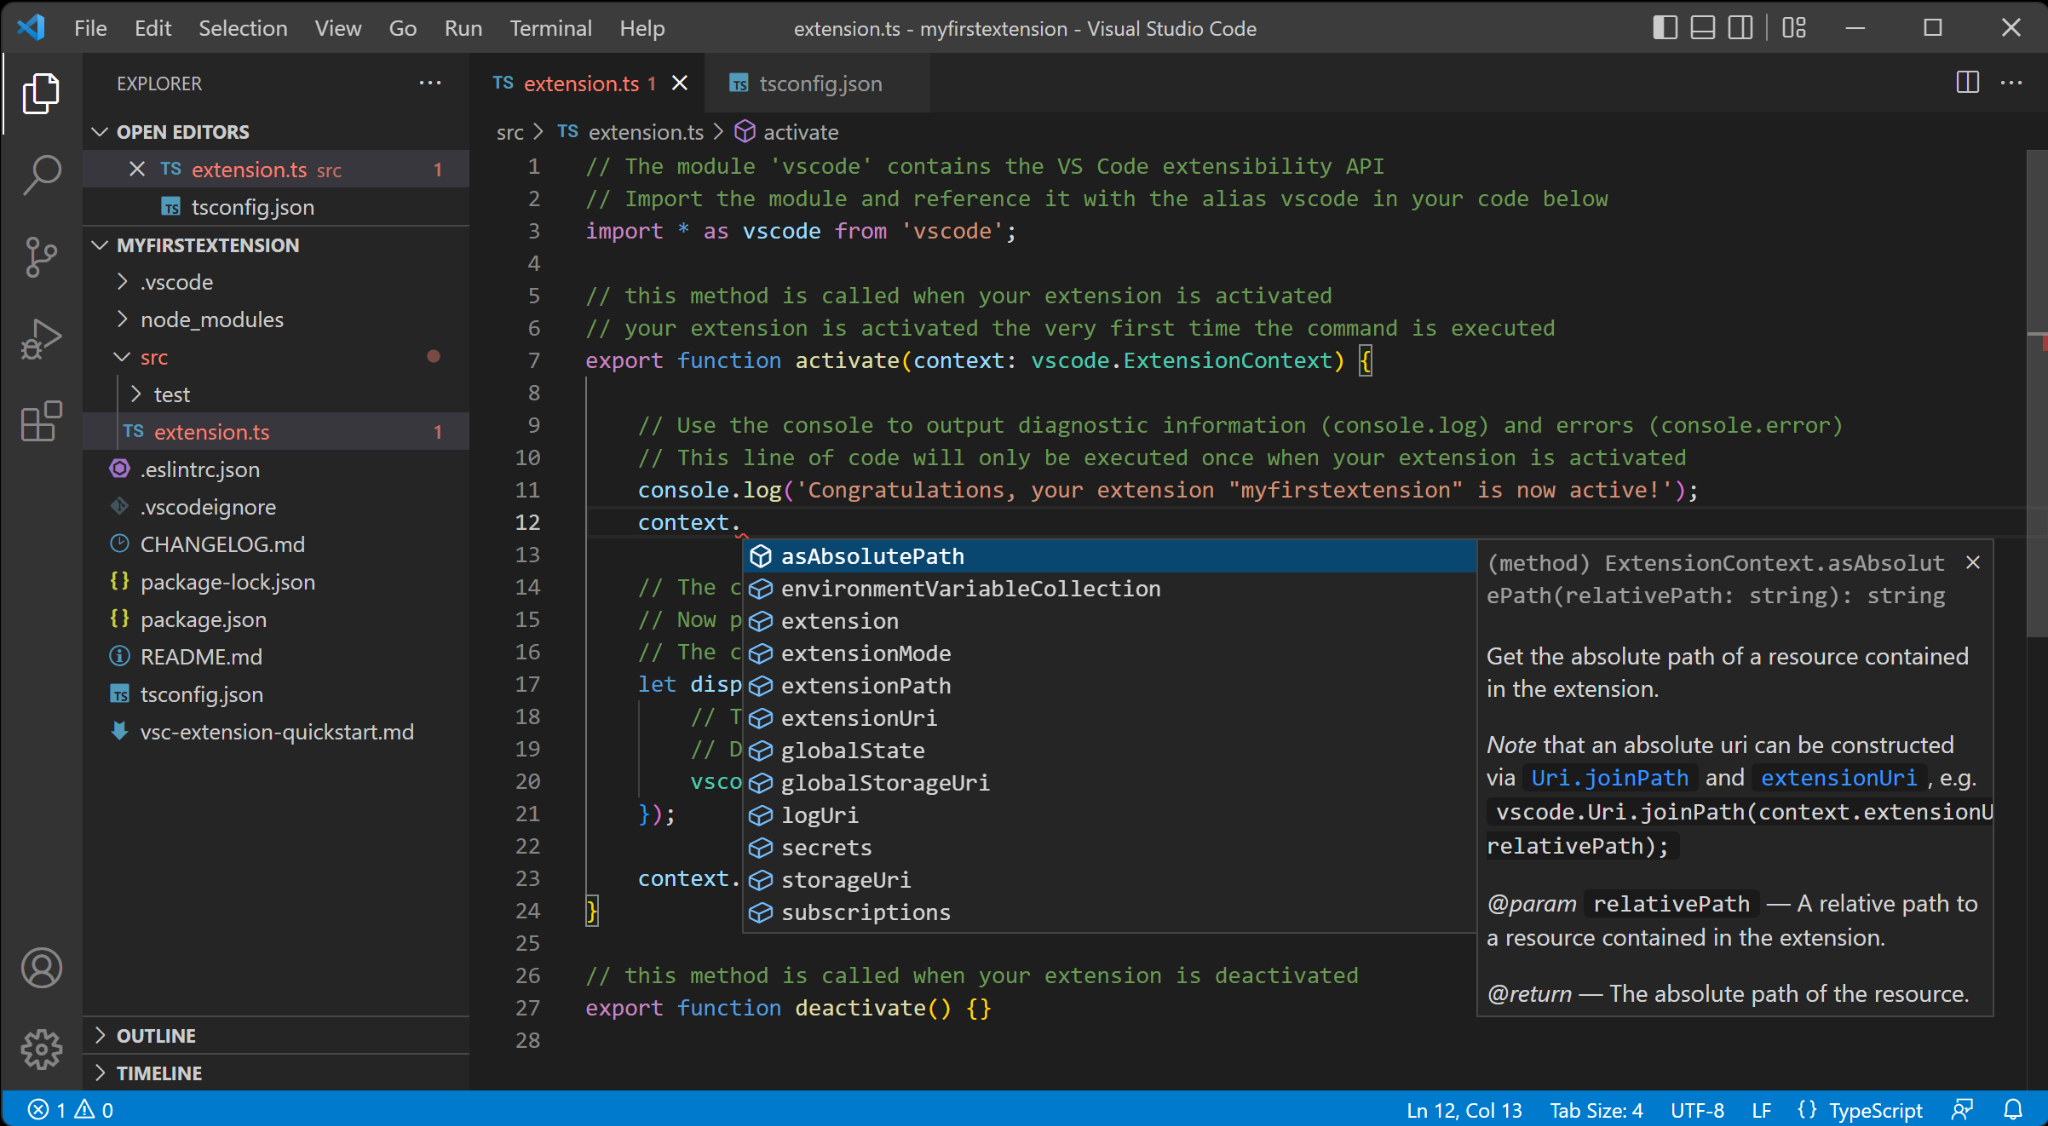
TypeScript Programming with Visual Studio Code
While git can be easily used on the command line, sometimes developers prefer a GUI-based approach. This can be especially helpful for those who are new to git. Some applications can help with this, such as "GitHub Desktop".
While the developer is coding, they normally run unit tests or integration tests in their local environment, which is part of having a fast feedback loop. These tests exist as part of the repository. This provides them confidence for their changes. If they find a broken or failing test, then they would fix it on their development workstation before proceeding, because otherwise the pipeline would fail and they wouldn't be able to merge their code. Developers are responsible for writing and maintaining tests.
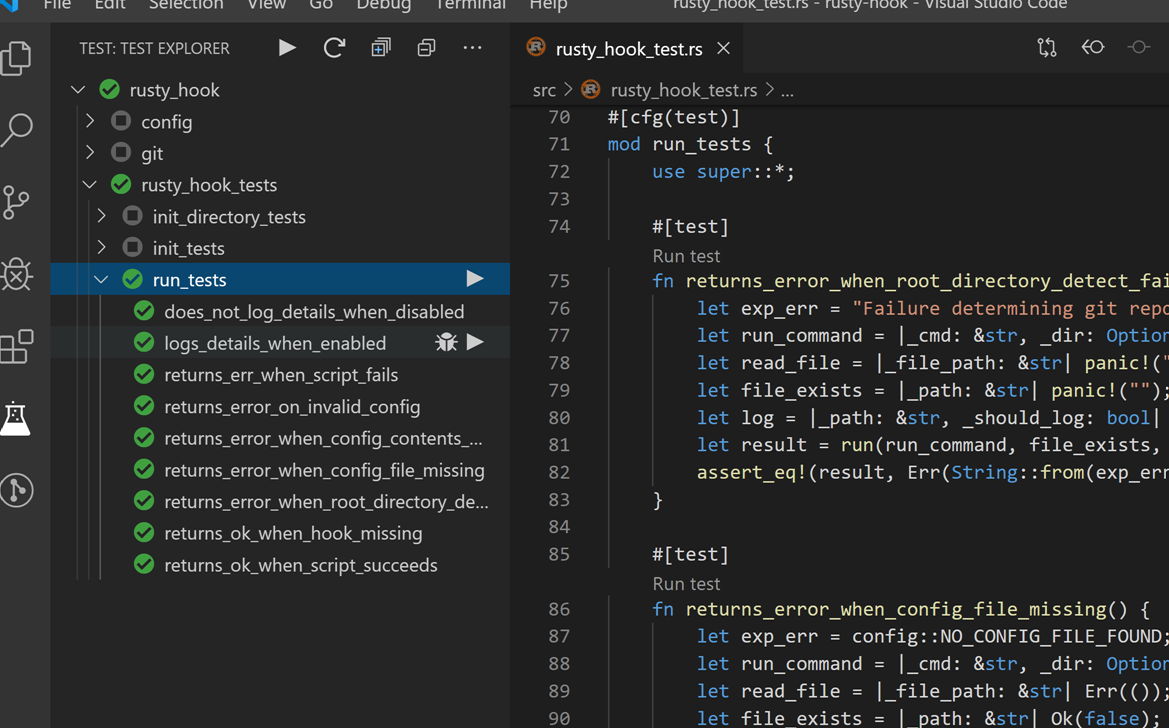
Rust Test Explorer - Visual Studio Marketplace
For instance, consider a repository opened in GitHub Desktop. It's a tool to visualize and interact with a Git repository, showing individual changes and their details. While this isn't a tutorial on Git, it's worth noting that any VCS with the capability to track and manage changes suffices; it doesn't have to be Git. The choice depends on your team's preferences and needs. Here is a screenshot of GitHub Desktop:
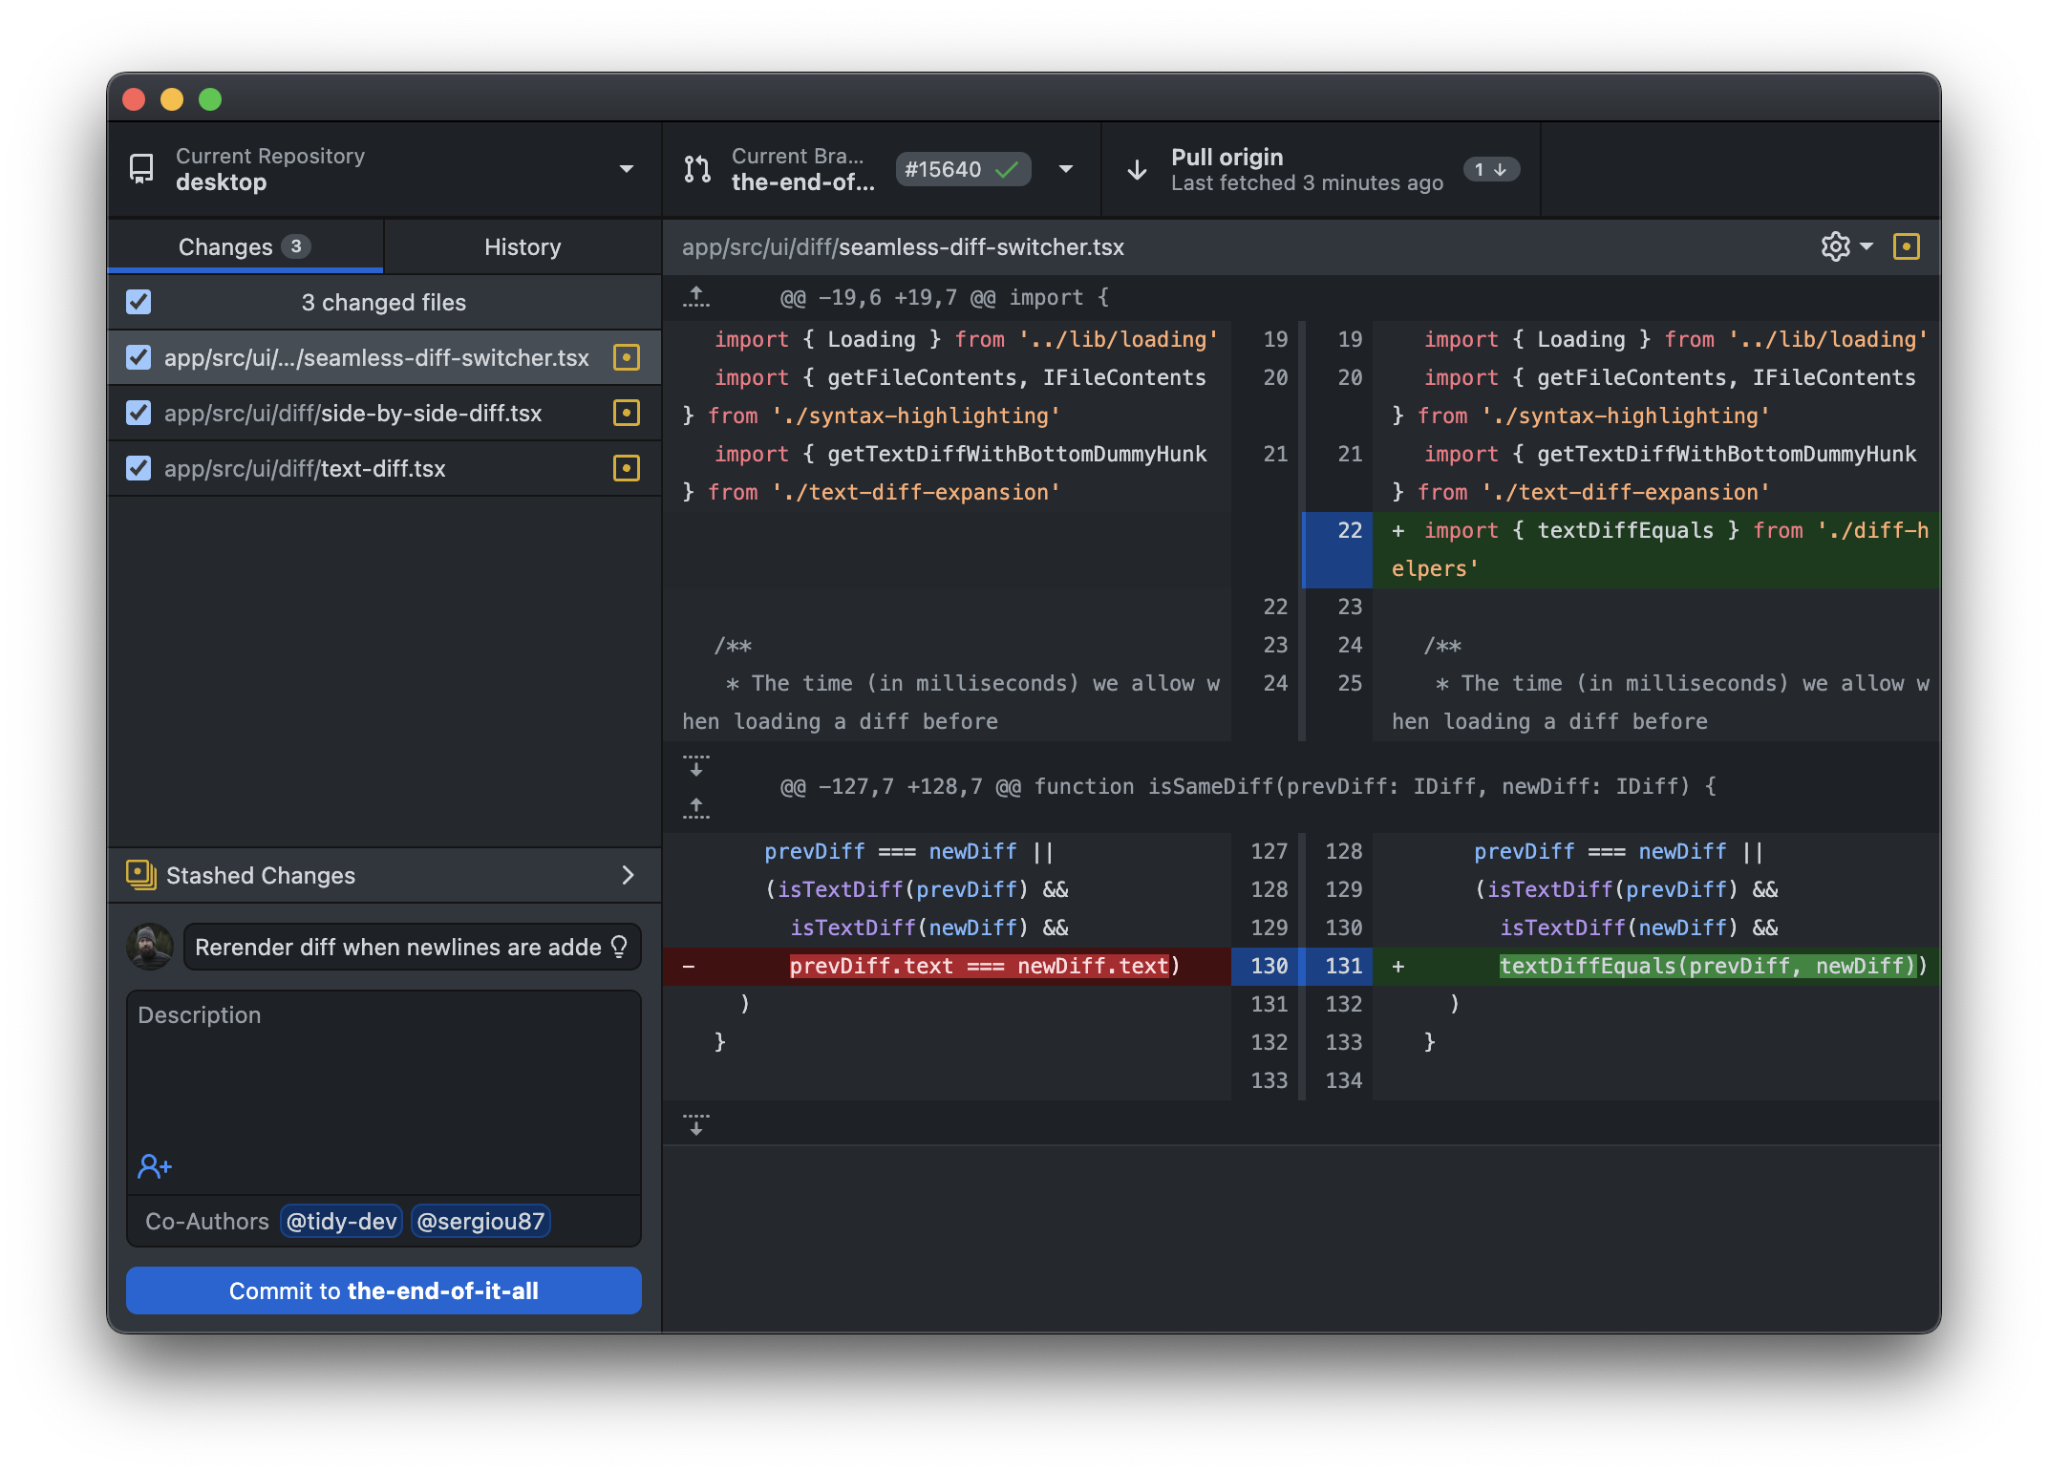
https://github.com/desktop/desktop Some other GitHub Desktop-like tools are SourceTree, GitKraken, Tower, and TortoiseGit.
SourceTree – Free for Windows and Mac.
- Offers a visual representation of branches and commits.
- Integrated with Bitbucket and GitHub.
- Can be slow and occasionally buggy.
- Somewhat steeper learning curve for beginners.
GitKraken – Intuitive UI, great for beginners.
- Cross-platform (Windows, Mac, Linux).
- Supports GitFlow.
- Free version has limitations; Pro version is paid.
- Some users report performance issues.
Tower – Clean UI and efficient performance.
- Offers advanced features like single-line staging.
- Good integration with multiple services.
- No Linux version.
- More expensive compared to other tools.
TortoiseGit – Integrates directly into Windows Explorer.
- Free and open source.
- Mature and well-maintained.
- Windows only.
- UI might not be as modern or intuitive as other tools.
- Requires separate Git installation.
After developers are done, they then create a PR. This shows the developer's changes and allows other developers to comment on them (i.e., code review.)
What is a pull request?
A pull request (or a change request) is a request from a developer to merge changes from their branch into the repository. For example, when a developer is ready to integrate their changes, they would create a pull request. The pull request allows others to comment on the developer's changes and also triggers the build pipeline to validate their changes. Since a developer needs to create a pull request before merging, this means that the confidence-instilling checks can run.
After the pull request is merged, then the changes become part of the "main" branch in the repository. This means that they can be deployed, or other developers can integrate on top of their work.
Here are some key characteristics of a good pull request:
-
Clear Title: The title should be concise and describe the changes at a high level. Someone should be able to get an idea of what the PR is about just by reading the title.
-
Descriptive Description: A PR description should provide context. It should answer:
-
- What changes are being made?
-
- Why are these changes necessary?
-
- How have these changes been tested?
-
- Are there any related issues or PRs?
-
Small and Focused: Ideally, a PR should be small and address a single issue or feature. This makes it easier to review and understand. Large PRs can be daunting for reviewers.
-
Includes Tests: If the project has a testing framework, the PR should include tests that cover the new functionality or bug fixes. This ensures that the changes work as expected and prevents regressions.
-
Follows Code Style and Conventions: The PR should adhere to the project's coding standards and conventions to maintain consistency.
-
Updated Documentation: If the changes introduce new features or modify existing ones, the PR should also update related documentation.
-
Comments on Complex or Ambiguous Code: If the changes involve complex logic or hacks to address specific edge cases, they should be accompanied by comments explaining the rationale.
-
Includes Relevant Assets: If the PR has UI changes, including screenshots, gifs, or videos can be very helpful for reviewers.
-
Has Been Self-reviewed: Before submitting, the author should review their own PR. This can catch many small issues like typos, console logs, or forgotten debug statements.
-
Passes Continuous Integration: If the project uses CI tools, the PR should pass all checks (like building without errors, passing tests, lint checks, etc.)
-
Addresses Feedback: After receiving feedback, the PR author should make the necessary changes and might need to clarify if something isn't clear. A good PR evolves through collaboration.
-
Links to Issue: If the PR addresses an open issue, it should link to or mention that issue. This provides context and allows for tracking the resolution of bugs or features.
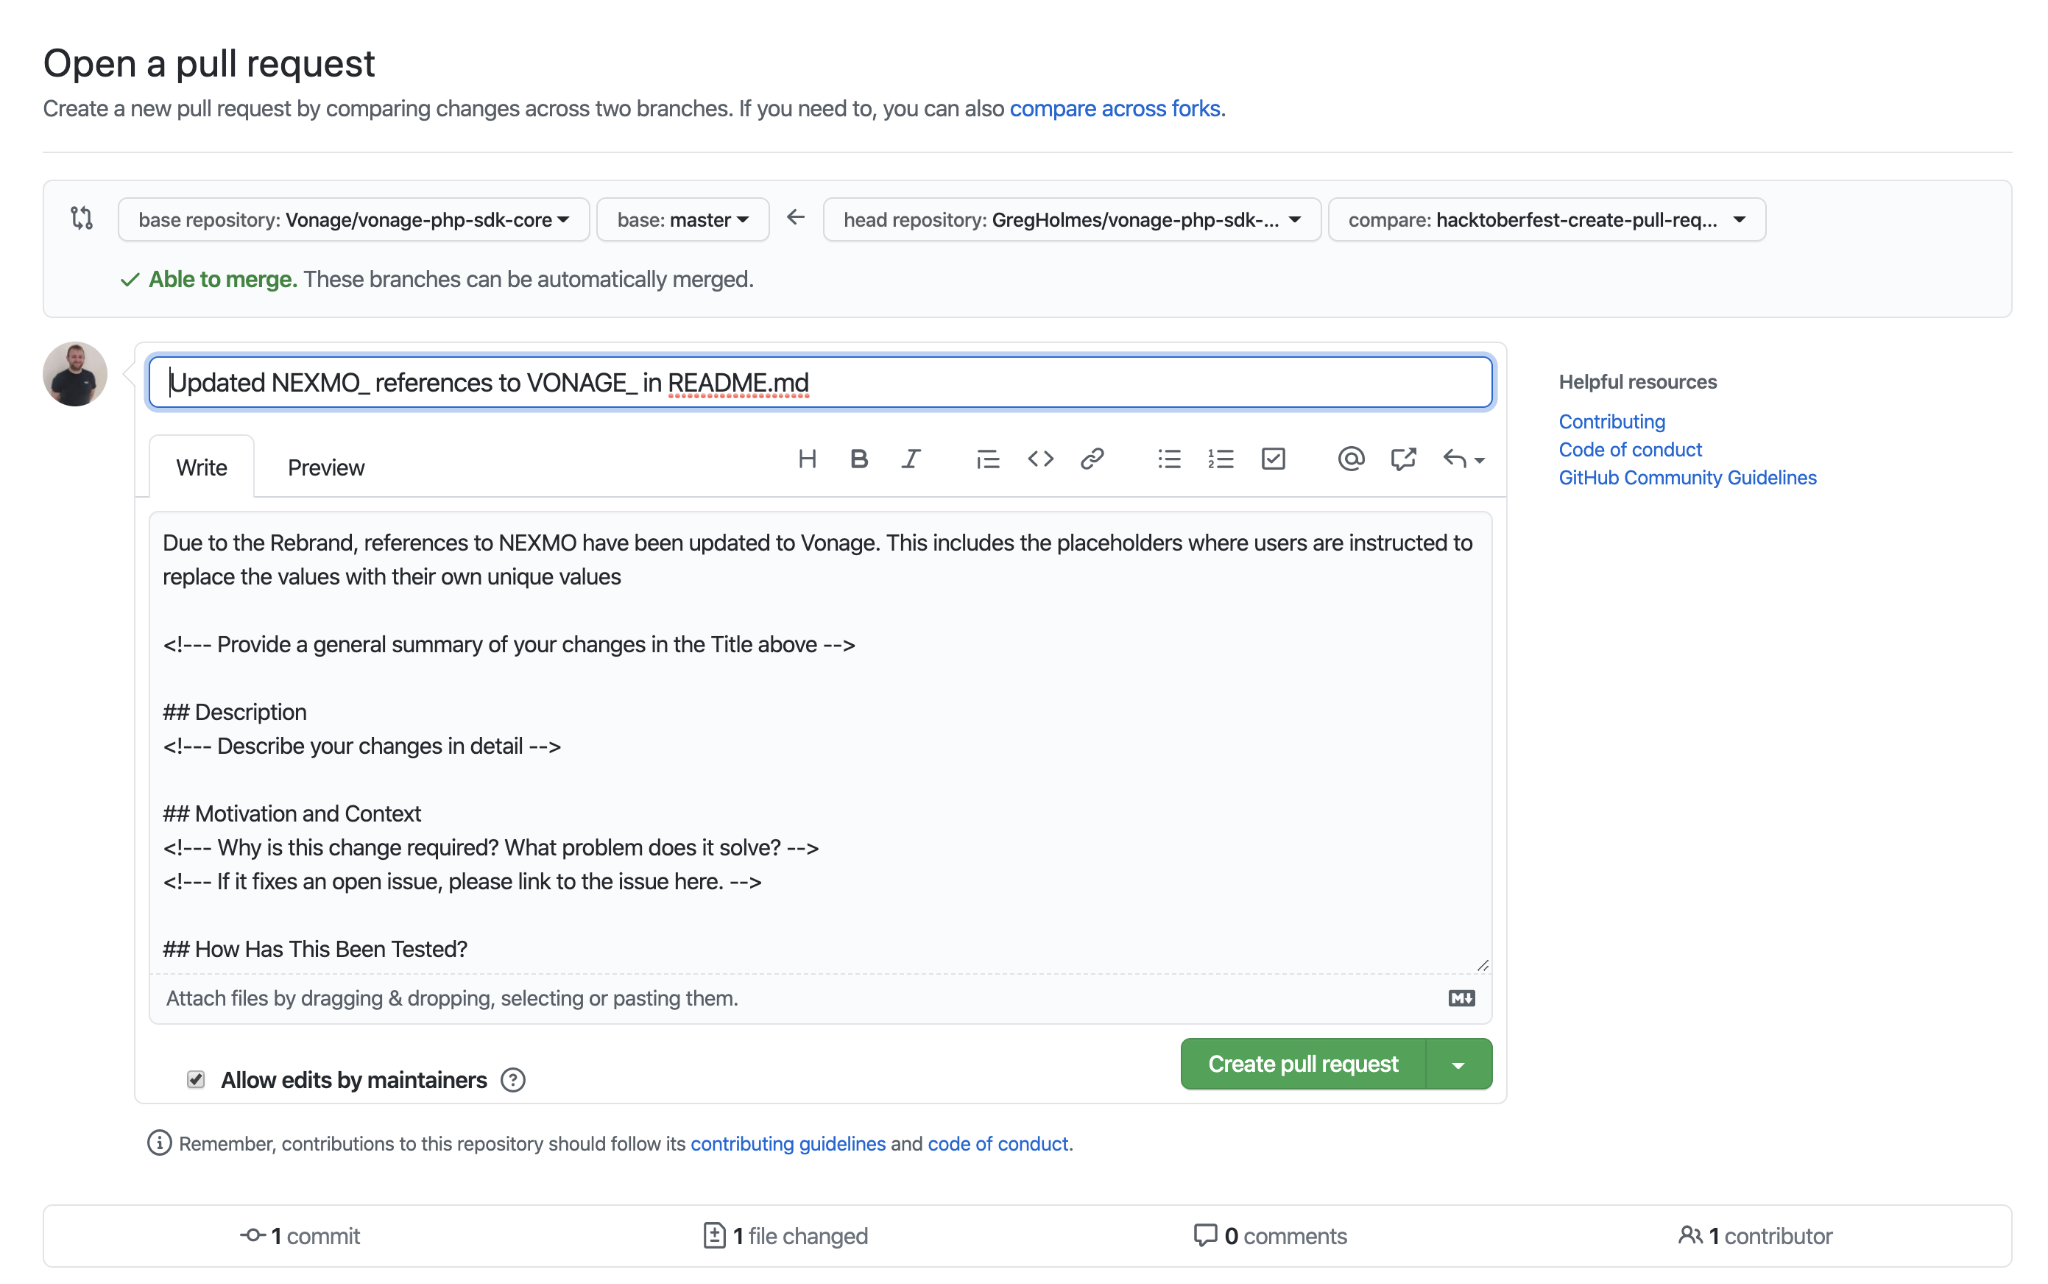
How To Create a Pull Request With GitHub Desktop (vonage.com)
Testing and automated testing in the pipeline
Software testing is crucial for ensuring that applications meet quality standards, function correctly, and deliver a positive user experience. It's a vital part of CI/CD because it helps developers catch bugs early and build confidence in their code changes. When the build pipeline runs, it runs your automated tests. If the automated tests fail, then therefore the build pipeline will fail as well. This is important, because this tells the developer that their changes cannot be merged (i.e., integrated and available to other developers) because something is wrong.
There are two main categories of testing:
-
Automated Testing ("Checking"): These tests are predefined (automated tests), can be run by computers, and are coded by developers. They are essential for verifying functionality and performance but very tedious, time-consuming, expensive and boring for a human to do manually.
-
Manual Testing: This involves human judgment and focuses on aspects like usability, aesthetics, and user experience that are difficult to automate.
Checking is like a demonstration. Imagine a chemistry teacher in front of an eager class. The teacher says, "Watch this!" and mixes two chemicals together. Then, everything changes color and makes a pop. The teacher already knew what was going to happen, and in this case demonstrated that fact in front of a class: the chemicals were going to change color, and make a pop. Or, say someone enters in 1+1 in the calculator. There is an expectation that it will always be "2".
Now, contrast this with manual testing: tacit knowledge. You have to write a set of rules to determine if a website is designed well. It's not very easy to write a set of rules, or instructions for someone to determine that. But, it is easy to figure out using our human brains: we try to use the website, and if we are having issues, then we know that it's not usable. But we can't create a document that describes every possible facet in great detail for every possible situation of what usable means. It's highly subjective and complex. It's important to have both types of testing.
There are many types of automated tests, including:
-
Unit Testing: Verifies individual components of code.
-
Integration Testing: Checks how different units of code work together.
-
Functional Testing: Tests the application against business requirements.
-
System Testing: Examines the fully integrated software product.
-
End-to-End Testing: Simulates real-user scenarios.
-
Acceptance Testing: Determines if the software is ready for release.
-
Performance Testing: Assesses speed, response time, and stability.
-
Stress Testing: Evaluates how the system performs under extreme conditions.
-
Security Testing: Identifies vulnerabilities.
-
Usability Testing: Evaluates user-friendliness, which may or may not include a human reviewer.
-
Regression Testing: Ensures new changes don't break existing functionality.
-
Smoke Testing: Identifies major failures early on.
-
Exploratory Testing: Involves less structured exploration of the software.
CI/CD Provider Terminology
Build pipelines (or just pipelines) are scripts that developers maintain to perform useful work — building the application, generating artifacts, or deploying it. The "pipeline" metaphor captures a one-way dataflow through a set of goals that either pass or fail.
Pipelines are central to CI/CD, and developers update them constantly. If the deployment pipeline fails, it must be fixed quickly because it is typically the only automated route to production. Knowing the terminology, the structure, and how to debug a pipeline quickly is therefore essential.
The same concepts go by different names depending on which CI/CD platform you use. The table below maps the most common terms.
| Concept | Generic Term | Jenkins | GitHub Actions | GitLab CI/CD | CircleCI |
|---|---|---|---|---|---|
| A single task or command within a pipeline | Build Step | Build Step | Step | Job | Step |
| The runtime context (OS, tools, env vars) | Environment | Node | Runner | Runner | Executor |
| An ordered set of jobs | Workflow | Pipeline | Workflow | Pipeline | Workflow |
| An event that starts a pipeline run | Trigger | Build Trigger | Event | Trigger | Trigger |
| Sensitive data (passwords, tokens, keys) | Secrets | Credentials | Secrets | Variables | Environment Variables |
| A lightweight executable package | Container | Agent / Docker Agent | Container | Docker | Docker Executor |
| The file(s) that define the pipeline | Configuration | Jenkinsfile | .github/workflows/*.yml | .gitlab-ci.yml | .circleci/config.yml |
| Files produced by a build step | Artifacts | Build Artifacts | Artifacts | Artifacts | Artifacts |
| Stored dependencies or compiled output | Cache | Workspace | Cache | Cache | Cache |
| Running multiple jobs at the same time | Parallelism | Parallel Builds | Matrix Builds | Parallel / Matrix | Parallel Jobs |
| Whether a build passed or failed | Build Status | Build Status | Check | Pipeline Status | Build Status |
Environment naming note: Testing environments also vary by organization. You may encounter "Development", "Dev", "QA", "Staging", "UAT", "PPE", "Testing", "Experimental", or "Beta". These terms carry different connotations depending on the team and deployment process.
What Steps Should a Workflow Have?
Based on analysis of real-world GitHub Actions workflows, step names cluster into these major themes. The frequency counts give a sense of how commonly each type of step appears across open-source repositories.
Release Management (most common)
- Release creation and publication — creating GitHub Releases, identifying upload URLs, handling drafts
- Tag management — extracting or creating version tags
- Version bumping and semantic versioning — incrementing version numbers
- Changelog and release notes — generating changelog entries
Version Control
- Retrieving version data and setting it in the environment
- Extracting and managing branch information
- Checking repository state, managing commit metadata
Build Process
- Compilation and assembly
- General build utilities
- Preparing the build environment (setting up tools, dependencies, platform specifics)
Docker and Container Management
- Building, tagging, and pushing Docker images
- Container/platform configuration (multi-arch targets, labels)
- Docker cache management
Environment and Setup
- Populating environment variables and configuration
- Preparing the build environment, checking system state
Caching
- Managing cache entries and directory paths
- Specialized caching for Node modules, Composer, Gradle, etc.
Testing
- Executing test suites and outputting results or statuses
Miscellaneous Tools
- Timestamp retrieval, GPG setup, workflow utility steps
Takeaway: If you are designing a new workflow, start with the most common patterns: checkout → environment setup → dependency installation → build → test. Add caching around the dependency install step. Add release/publish steps only in workflows triggered by tags or releases, not every PR.
Getting started with GitHub Actions
Throughout this guide, we will explore the key features of GitHub Actions and how to effectively structure workflow files in YAML to maximize the benefits of CI/CD. We'll start by creating a somewhat simple weather application, but make it more complex over time. This is designed to simulate a real world application.
GitHub is a company that has a product called "Actions" (sometimes referred to as "GitHub Actions") that is a set of build servers and software that runs GitHub Actions workflows. These YAML workflows are created by the developer and normally build, test, and lint the code using the GitHub Actions YAML syntax and run on the GitHub Actions build servers.
GitHub is a company, thus, it is not possible to install GitHub--it is not an application. Git is the version control system that can be installed.
If you need more information on the specific intricacies of GitHub Actions, please see the GitHub Actions documentation. GitHub Actions documentation - GitHub Docs
Let's build a pipeline that can do the following:
-
Checkout the code (i.e., clone it onto the runner.)
-
Build the code.
-
Run automated tests, and linting.
-
Publish artifacts to an artifact server, in this case, to GitHub, along with a versioning strategy that will help identify which artifacts you are publishing.
-
Deployed the website to Azure.
Workflow Structure
Here's an overview of how GitHub workflows are structured:
-
1. Events: Workflows begin with events, such as pushes or pull requests, which trigger the workflow.
-
2. Jobs: Workflows may contain multiple jobs, but we will focus on a single job for simplicity. Each job specifies an environment to run in, indicated by a string that corresponds to an operating system and a pre-configured image. This image includes pre-installed software, allowing us to get started quickly and reduce setup times and costs.
-
3. Steps: Each job is composed of multiple steps. These steps can use either the
usesorruncommand: -
- Uses: This command utilizes actions provided by GitHub Actions, sourced from the GitHub Marketplace. These actions are pre-configured scripts that handle tasks like software installation, version management, or building.
-
- Run: This command executes shell commands specific to the operating system defined in the job's environment, using bash scripting for Linux, for example.
-
4. Artifacts: Typically, workflows end with steps for uploading artifacts, though the initial steps may also involve downloading or preparing artifacts.
Below is an overview of a typical workflow structure:
Workflow │ ├── Events (e.g., push, pull_request) │ ├── Jobs │ ├── Runs-on (Runner) │ ├── Needs (Dependencies on other jobs) │ ├── Steps │ │ ├── Uses (Actions) │ │ │ ├── Inputs │ │ │ ├── Outputs │ │ │ └── Environment (e.g., secrets, env variables) │ │ └── Run (Shell commands) │ ├── Environment Variables │ ├── Secrets │ ├── Services (Service Containers) │ └── Artifacts │ ├── Upload Artifact │ └── Download Artifact │ └── Workflow Commands (e.g., set-output, set-env)
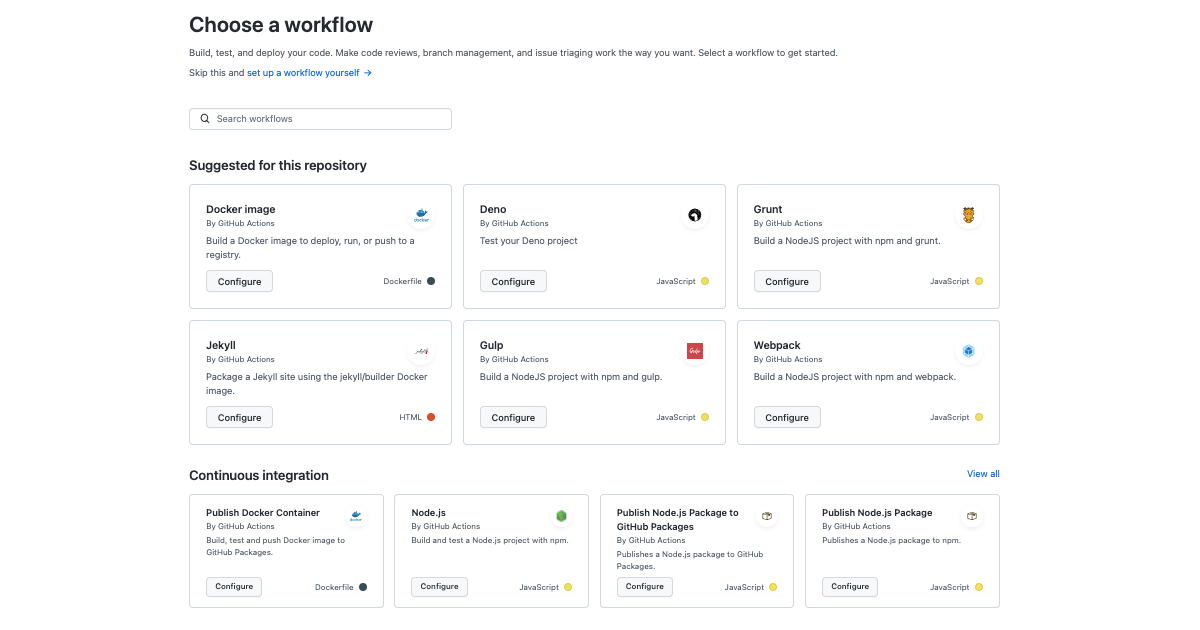
If you want to get started right away, GitHub Actions has several templates for many different project types. Use a template to get started quickly.
Setting up error notifications
When your workflow fails, it means that continuous integration is no longer possible. Implement error notifications to alert your team when the build pipeline fails—especially for production workflows. Consider these notification methods:
- Email Notifications: Configure GitHub Actions to send emails upon failure.
- Messaging Platform Integrations: Integrate with platforms like Microsoft Teams, Slack, or Discord to receive instant alerts (including texts or phone calls).
Ensure your GitHub email settings are correctly configured to receive these notifications. GitHub Actions is a CI/CD platform that automates software development tasks within GitHub repositories. It uses "workflow files," which are YAML-based instructions that define the steps of a CI/CD pipeline, similar to a project manager for your build scripts.
These workflows are triggered by specific events in your repository, like pushing code or creating a pull request. When triggered, they run on virtual build servers provided by GitHub, executing tasks such as building, testing, and deploying your application. These servers are ephemeral -- they're created for each workflow run and deleted afterward, ensuring a clean and consistent environment.
Workflows are organized into "jobs," each containing multiple "steps." Each step represents a discrete action, like running a script or using a pre-built action from the GitHub Marketplace.
Benefits of this structured approach:
-
Clarity and Organization: Named steps improve readability and make it easier to track progress, debug issues, and set up notifications.
-
Security and Isolation: Steps run in isolated environments, protecting sensitive information like secrets and environment variables.
-
Efficiency and Automation: GitHub Actions provides features for parallelization, triggering, resource management, and secret management, simplifying complex tasks.
-
Standardization and Collaboration: The workflow syntax promotes consistency across projects and teams, facilitating collaboration and knowledge sharing.

5 Things to Know About Pipe Scaffolding (supremepipe.com)
| CI server | macOS/Linux | Windows |
|---|---|---|
| name: CI | #!/bin/bash | @echo off |
| on: | echo "Starting CI process" | echo Starting CI process |
| push: | # Assuming Git and Node.js are already installed | REM Assuming Git and Node.js are already installed |
| jobs: | git clone <repository_url> | git clone <repository_url> |
| setup_and_test: | cd <repository_directory> | cd <repository_directory> |
| runs-on: ubuntu-latest | # Note: this depends on the NPM version installed on your computer | npm install |
| steps: | npm install | npm test |
- name: Checkout code | npm test | uses: actions/checkout@v2 | |
- name: Install dependencies | | run: npm install # we will get into later as to why we shouldn't be running npm install, instead, npm ci | |
- name: Run tests | | run: npm test | |
In this example, we demonstrate how you can execute commands on your local computer to simulate what a build server does. You can effectively use your own laptop as a server, albeit with caveats mentioned earlier. As an exercise, consider installing the GitHub Actions agent on your computer. Then, set up a self-hosted runner and execute the build script on it. This process will allow you to recreate or emulate the actions performed by a build server, right from your local environment. See the appendix for more info.
Aside
The script echo hello world is a Bash script. Note that while Bash is commonly used, some scripts might be written for sh, which has slight syntax differences. For Windows runners, remember that these execute PowerShell scripts—not Bash scripts. This guide does not cover PowerShell in detail, but if you are new to Bash, consider reading a beginner’s guide. Given Bash’s long-standing usage, it’s likely to remain relevant for some time.
The feedback loop for workflow changes can be slow—you typically need to edit, commit, and run the workflow on GitHub Actions to see the results. To streamline this process, consider these strategies:
-
Simplify Workflow Steps: Ensure that workflow steps are simple enough to run locally. This improves speed and manageability. Use provider-agnostic scripts (e.g., PowerShell or Bash).
-
Use Docker Containers: Create and use a Docker container that closely mirrors the GitHub Actions environment. This lets you test workflows locally in a similar setting.
-
Utilize the
actLibrary: Theactlibrary lets you run GitHub Actions locally. While it may not perfectly replicate the GitHub Actions environment, it works well for simpler scripts. See the appendix for more details.
Aside end
Workflow files must be stored in the .github/workflows directory of your repository. This YAML file dictates the sequence of operations executed by GitHub Actions during the CI/CD process.
In order to run a workflow, you need a GitHub account and potentially a GitHub Enterprise organization. To create a new GitHub Enterprise repository, you first need to set up an account on GitHub and potentially get access to GitHub Enterprise, depending on your organization's setup. Here's how you can do it step-by-step:
1. Sign Up for GitHub
-
Go to [GitHub](https://github.com/).
-
Click on the "Sign up" button at the top right corner of the page.
-
Fill in your details, including a username, email address, and password.
-
Verify your account by following the email verification link sent to your email.
2. Join or Set Up GitHub Enterprise
-
If your organization already has GitHub Enterprise: You will need an invitation to join from your organization's GitHub Enterprise admin. Once invited, you can log in using the credentials or SSO (Single Sign-On) method prescribed by your organization.
-
If you are setting up a new GitHub Enterprise: You can start a trial or purchase it by visiting the [GitHub Enterprise page](https://github.com/enterprise). Setting up GitHub Enterprise usually requires more extensive IT involvement to handle the installation on cloud or on-premises infrastructure.
3. Create a New Repository
Once you have access to GitHub (and GitHub Enterprise if using):
-
Click on your profile photo in the upper right corner, then click Your repositories.
-
Click the green New button, or if you are on your organization's GitHub Enterprise account, you may need to select the organization context first.
-
Enter a repository name, description (optional), and decide if the repository will be public or private.
-
Configure other settings like adding a README file, .gitignore, or a license according to your project needs.
-
Click Create repository.
4. Clone the Repository
- After creating your repository, clone it to your local machine to start working on the project. You can do this by opening your command line or terminal and running:
git clone https://github.com/username/repository-name.git
Replace username and repository-name with your GitHub username and the new repository's name.
5. Start Pushing Code
- After cloning the repository, you can start pushing your code to the GitHub repository by using:
git add .
git commit -m "Initial commit"
git push -u origin main
An exercise, try putting in the workflow described earlier in the doc GitHub workflow and see if you can figure out how to run it. It should just display Hello World and it doesn't require any code to build.
Workflow Triggers and Patterns
Workflow triggers are ways to automatically trigger your pipeline. When the workflow is triggered, it receives a set of inputs, for example the branch that it was triggered on as well as the date and time.
We'll be using a trigger to automatically trigger when we make a pull request. This means that the pull request will be blocked until the pipeline passes.
These pipelines can also be brought on different branches and triggers, for example, any pushes to the main branch. For example, if you're practicing continuous deployment, you may want to automatically deploy changes that are pushed to the main branch. Therefore, you can add a trigger that will automatically run the workflow if there's a commit push to the main branch.
on:

pull_request:

push:
Just keep listing the items if you want to listen to more events. Note that the "push" event also accepts many options to narrow it down. It also ends with a colon because you can narrow it down with more filters.
Triggers are not isolated; they're evaluated as a set of rules within the workflow file under the on: key, where multiple events like pull_request and push can be listed. This setup allows the workflow to execute under various conditions but can be refined to ensure efficiency and relevance. The workflow runs when at least one of those events are triggered.
Order doesn't matter. I could write it like this, it still works:
on:

push:

pull_request:
Aside start
It's important to configure workflow triggers to respond only to relevant events, helping to prevent unnecessary runs and reduce costs. For example, a trigger set for "pull_request" events can automate tasks like code integration and deployment specifically when changes are proposed to a main branch. To avoid redundant executions in environments with active development, you should define triggers carefully by specifying branches, tags, or paths.There's some more information in the appendix about common files that are typically ignored when changed to prevent excessive pipeline runs.
Aside end
Setting Up Your First Workflow
To create a basic "Hello world!" workflow in GitHub Actions, start by creating a new file named main.yml in the .github/workflows directory in your previously created branch and add the following content:
name: Hello World Workflow

on:

workflow_dispatch:

jobs:

greet:

runs-on: ubuntu-latest

steps:

- name: Say Hello

run: echo "Hello world!"
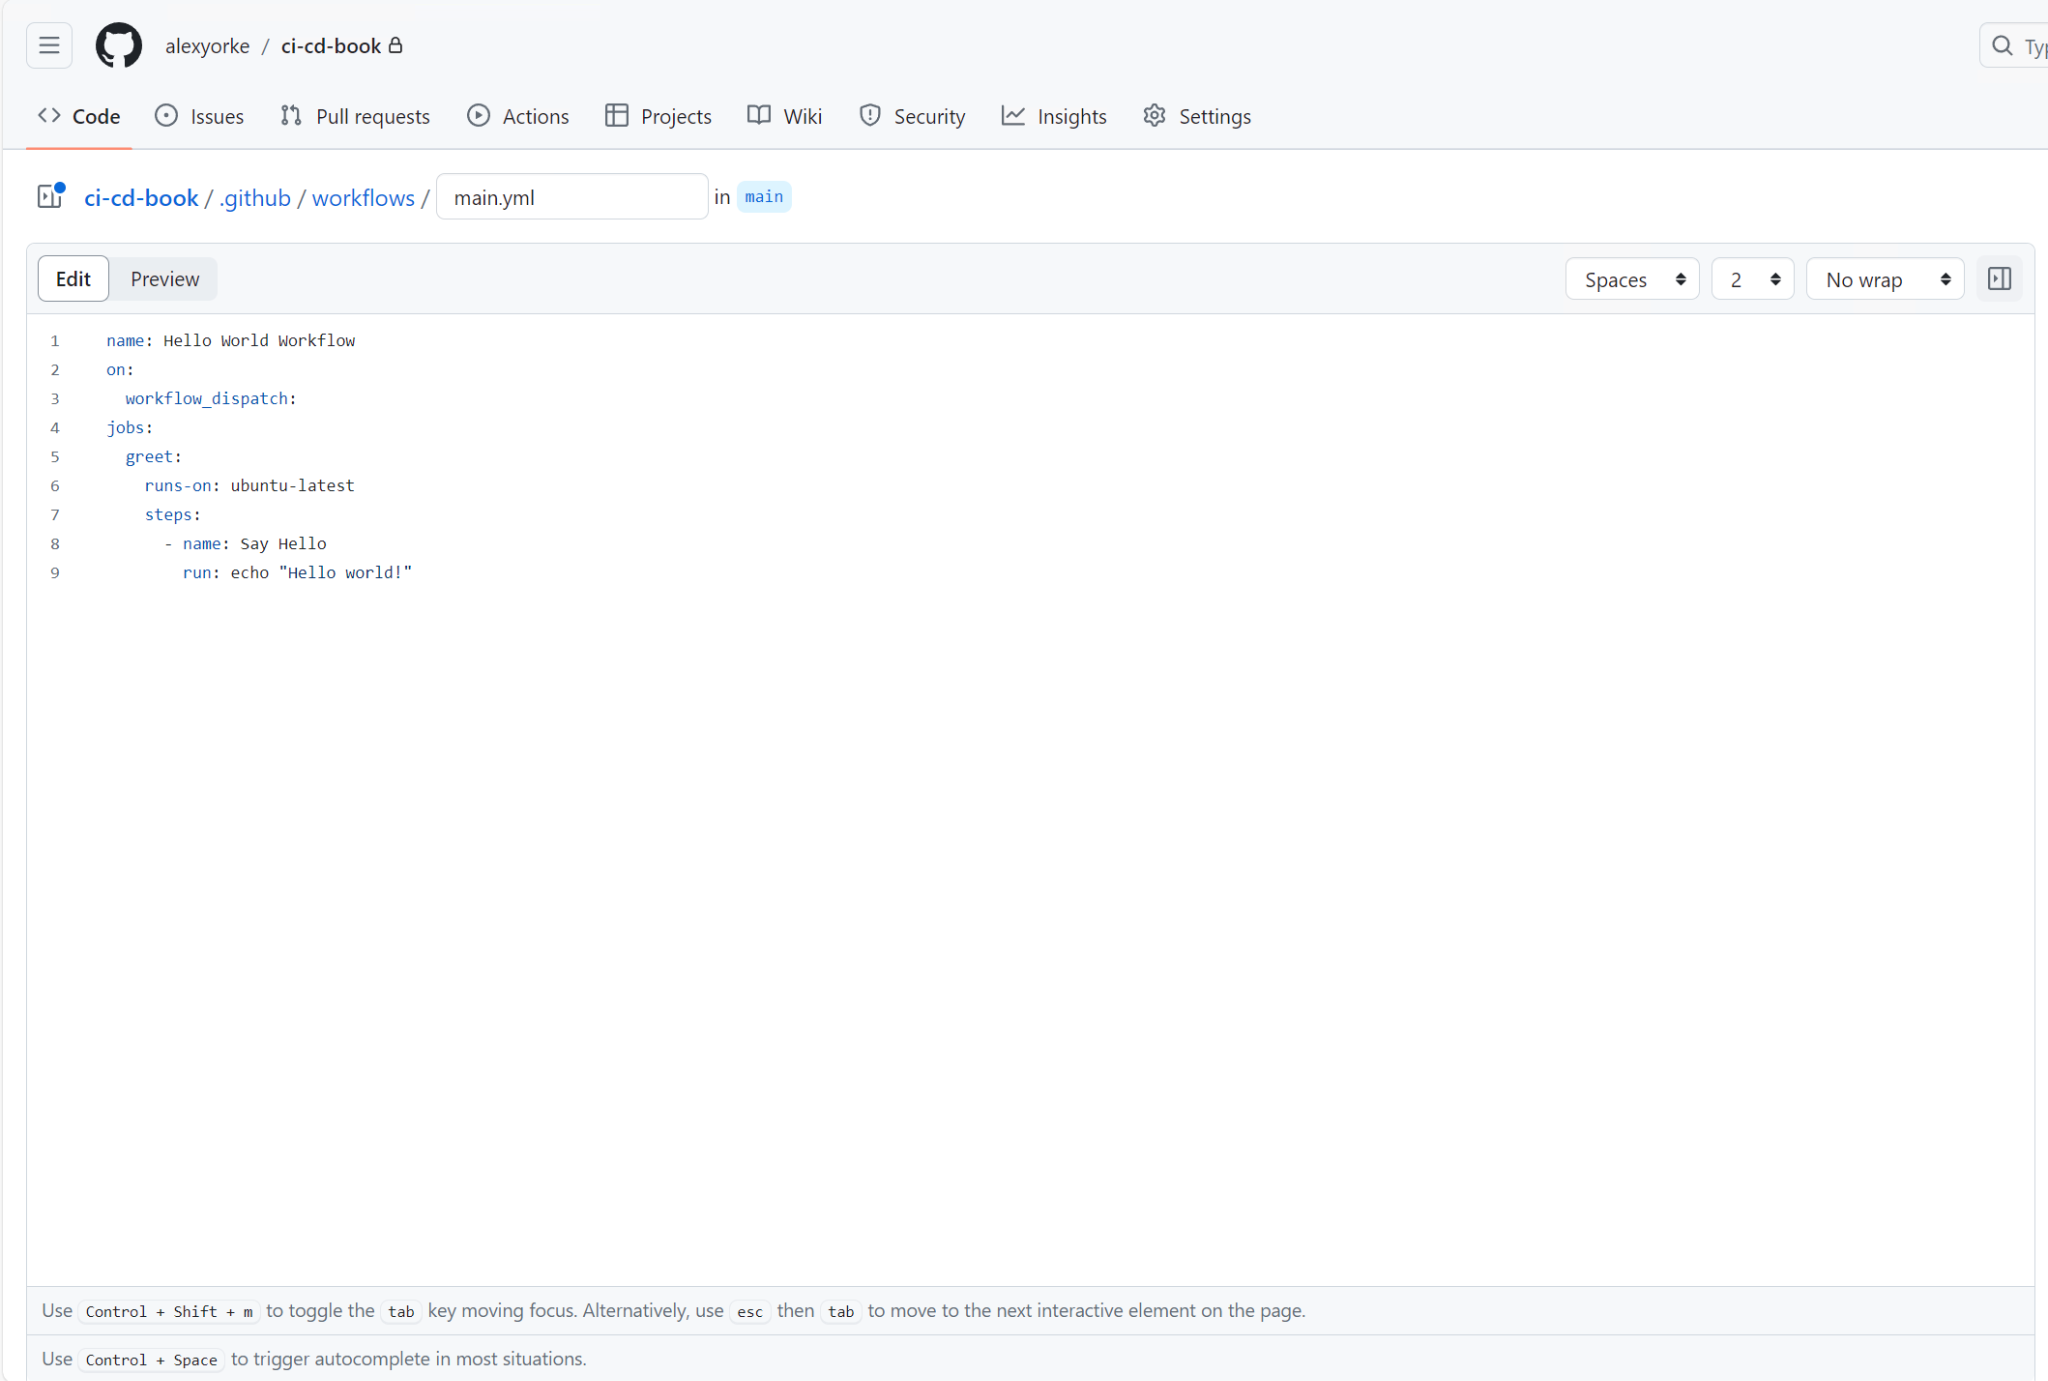
This example introduces the workflow_dispatch trigger, which allows you to manually start the workflow. This feature is particularly useful for debugging purposes. The workflow is set to execute on ubuntu-latest, a Linux-based runner that utilizes the Bash shell---a standard configuration for many GitHub Actions workflows.
Here are some tips for the workflow:
-
Steps in a workflow are used to organize similar scripts or commands, grouping them together for logical execution. Each step in the workflow is executed sequentially, one after the other. To enhance the auditability of the workflow and simplify the debugging process, it is beneficial to keep each step as concise as possible. This approach not only clarifies the structure of the workflow but also makes it easier to identify and resolve issues within specific steps.
-
Tips for the YAML syntax:
-
Indent with two spaces.
-
Use : to indicate options for a key.
-
Quote values to ensure they are interpreted as strings.
-
Validation: Use a YAML linter or language server to avoid syntax errors.
-
For more information see the sample web page called Learn YAML in X minutes.
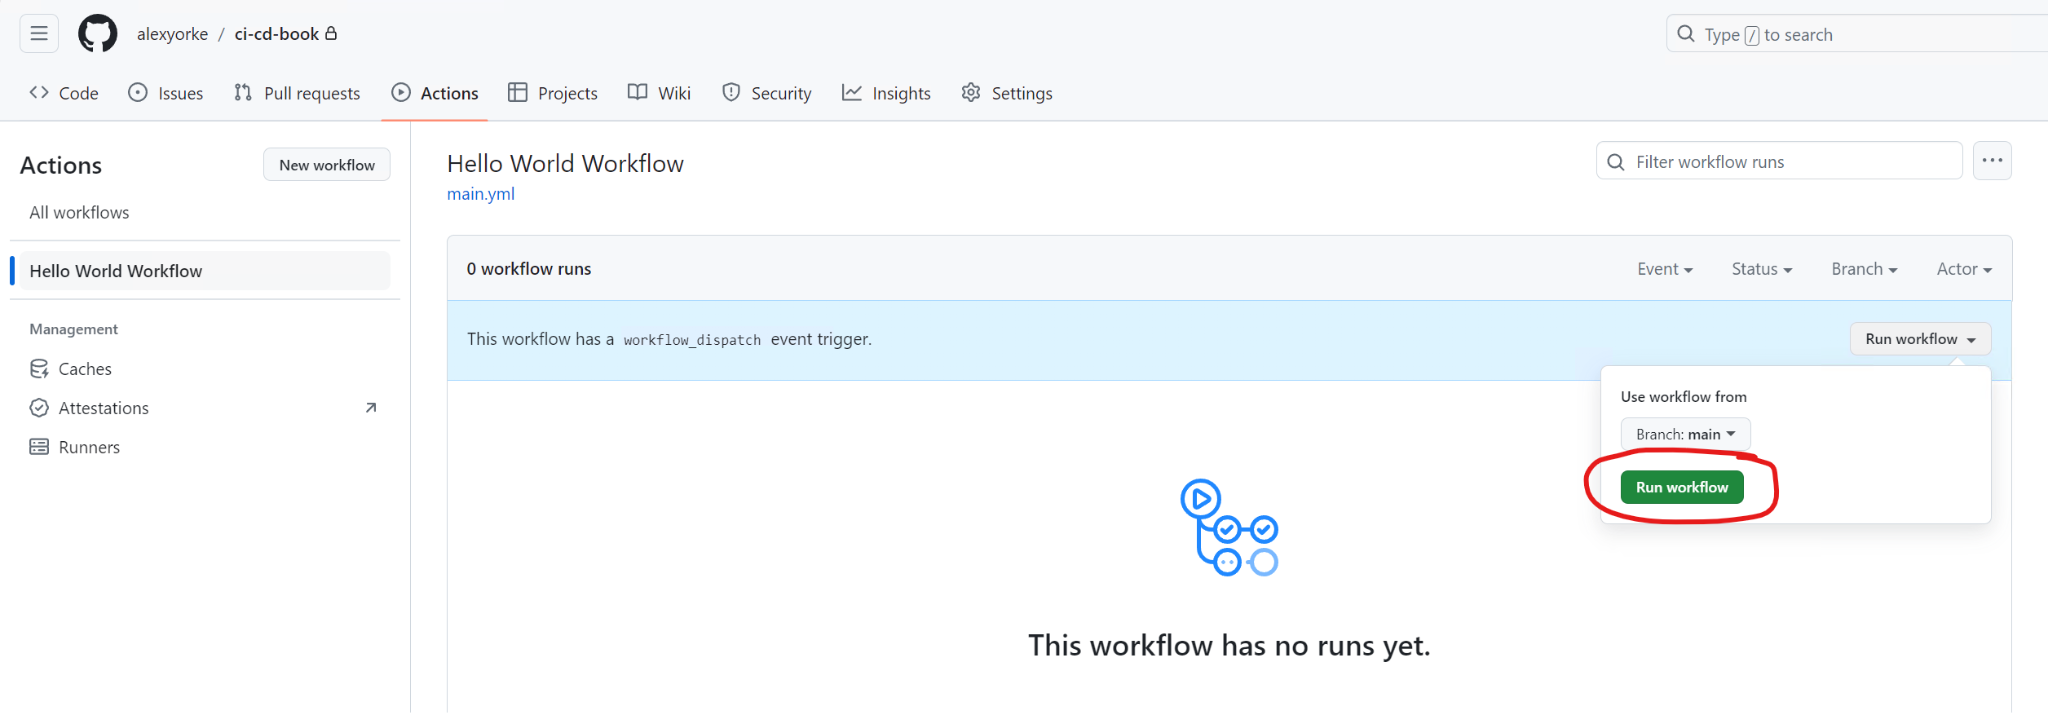
Now commit this file and then push those changes to your branch. You should see the following screenshot.
You should see "Hello World Workflow" in the sidebar on GitHub. Run it and check the output.
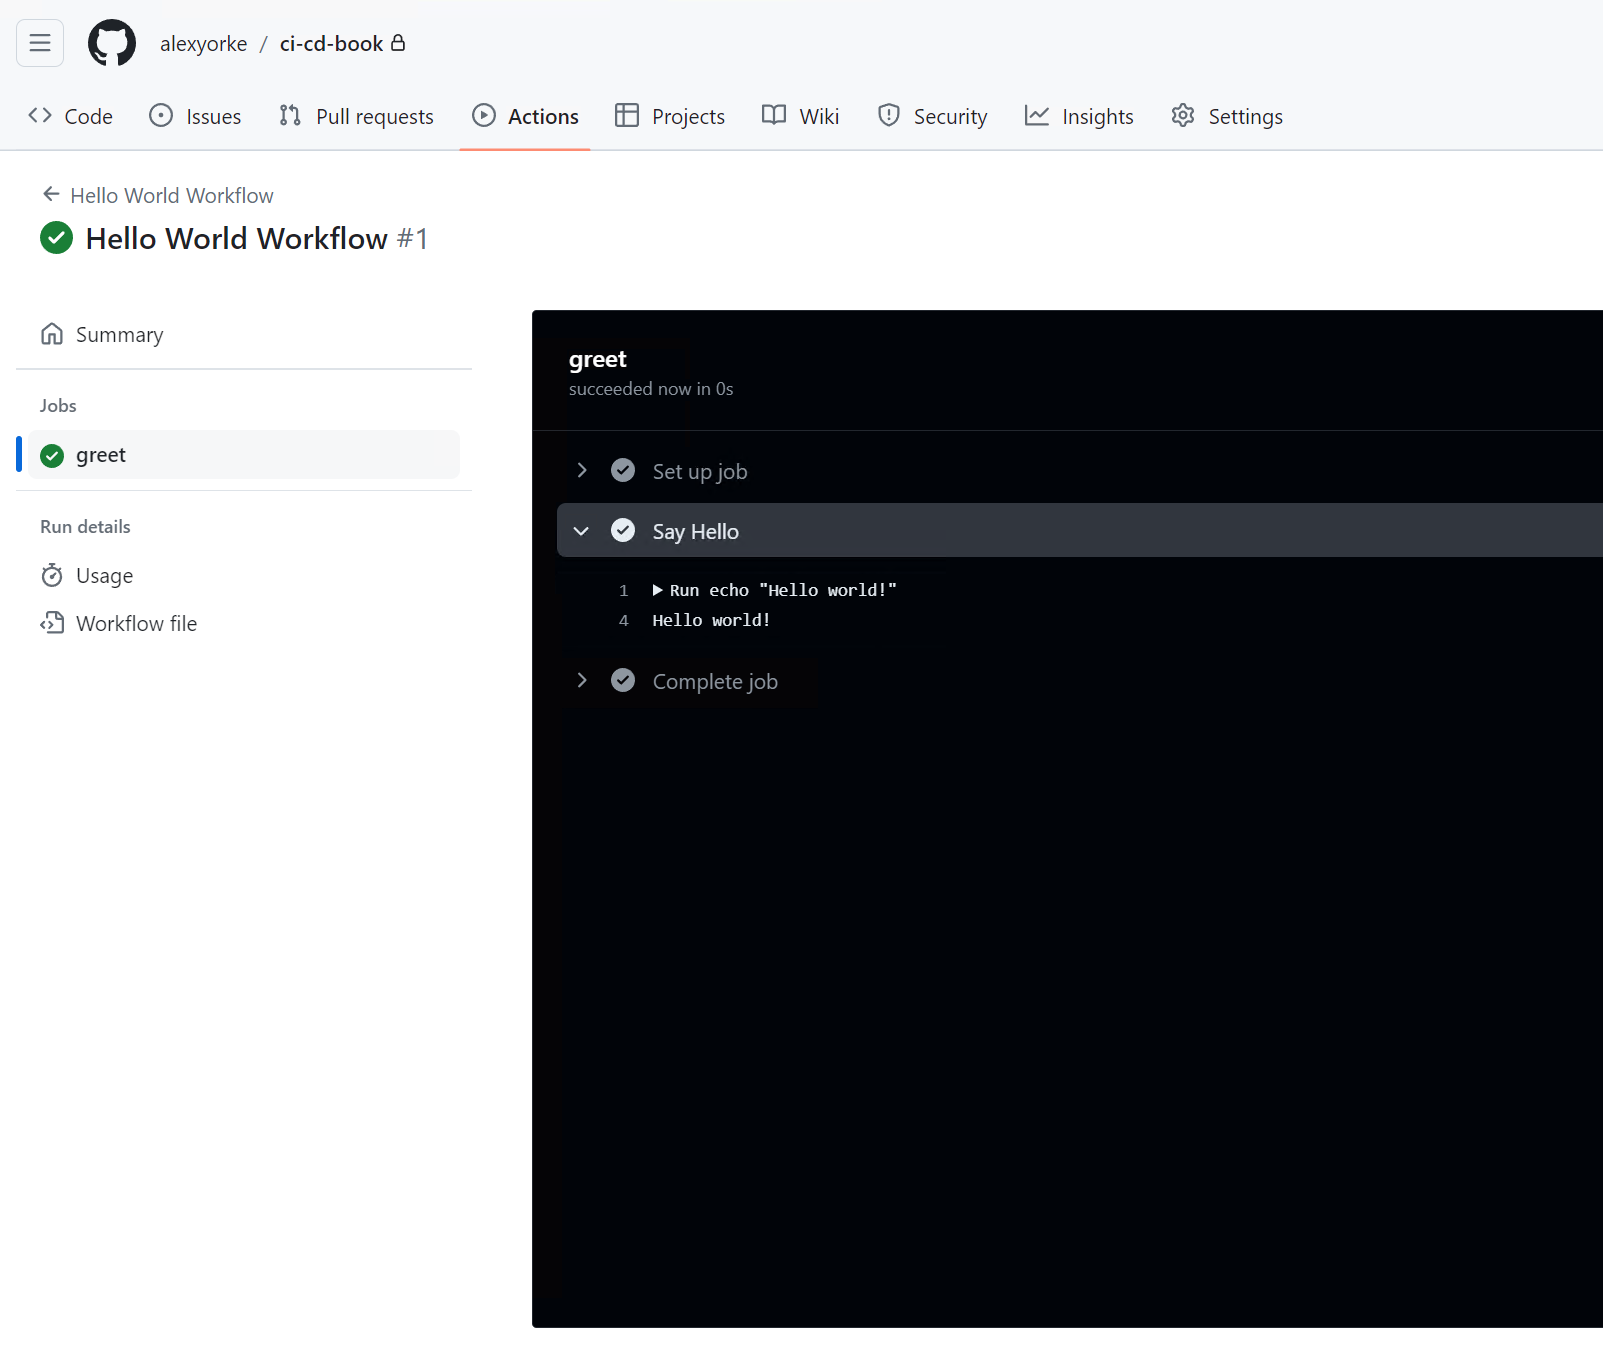
After you've run it, then you should see the output.
Workflow Name
| Workflow Name | Description |
|---|---|
| Hello World Workflow | The workflow's name is "Hello World Workflow". You can find it because we set the name mapping to "Hello World Workflow". This name shows up in the sidebar of your repository. The name mapping specifies the name of the workflow. (If omitted, the workflow’s filename will be used.) |
Triggers
| Trigger | Description |
|---|---|
| on: | The on mapping specifies the list of triggers when this workflow runs. "workflow_dispatch" indicates that this workflow is manually triggered, so you can use GitHub’s UI to start it. |
| workflow_dispatch: | (No additional details provided) |
Jobs
For now, everything goes in a single job called all.
| Key | Description |
|---|---|
| runs-on: "ubuntu-latest" | The runs-on attribute in your workflow file defines the container environment where your job executes. This choice determines the operating system and the pre-installed software available. You should choose an operating system that your developers are using when they test the application. For example, if the vast majority of developers use Windows, then you should use a Windows runner instead. Since GitHub Actions is designed to be cross-platform, maintaining consistency across different environments is important. If multiple team members use different operating systems, different build tools might be used—so it’s crucial that everyone uses the same operating system. |
Popular options:
- ubuntu-latest (Linux): Supports bash and cross-platform scripts (e.g., Node.js).
- Windows runners: For Windows-specific builds and PowerShell/CMD scripts. Considerations:
- Platform compatibility: Choose a runner that supports your required tools and scripts.
- Pre-installed software: Review the available software to avoid unnecessary installation steps. For this guide, we'll use ubuntu-latest with bash scripts. |
Steps
| Step | Details |
|---|
- name: "Checkout code" | Step 1: Uses
actions/checkout@v2to check out the repository. This action handles repository authentication (useful for private repositories) and checks out the correct branch associated with the workflow trigger, setting the working directory to the repository’s content. - name: Say Hello | Step 2: Runs the command
echo "Hello world!"to display a greeting message.
Beyond the basic setup, templates in GitHub Actions offer a foundation for best practices and standards. This advantage is particularly significant for teams or individuals new to CI/CD or those transitioning to GitHub Actions from other systems. The templates can be easily customized and extended, allowing developers to adjust the workflows to fit their specific project needs while maintaining the integrity and efficiency of the initial setup.
Steps
In a GitHub Actions workflow, each task is organized into steps. These steps are detailed in the workflow file and can include various actions, such as running scripts or utilizing user-created actions available in the GitHub Marketplace.
Scripts within these steps can span multiple lines. The scripting language used depends on the operating system specified in the workflow's runs-on attribute. For instance, if you're using the ubuntu-latest runner, the default scripting language is Bash because it's based on Linux. However, you can use other scripting languages provided their interpreters are installed on the runner. Similarly, for runners using Windows, the default scripting language is CMD, though you can switch to PowerShell or others as needed.
What is "actions/checkout@v2"?
This is called an action, and can be written in many different programming languages, but usually TypeScript/JavaScript. Actions can do many things, such as installing software, changing configuration, downloading files, etc. This action automatically clones the branch associated with this pipeline. For more information on what this action does, visit its documentation page for options on how to configure it.
-
Warning: actions can be authored by those other than GitHub. Be careful when referencing actions by their tag as this allows the developer to push any arbitrary code to that tag, which could cause security issues (i.e., they can run any arbitrary code in your repository.) Only use actions from those you trust.
-
Be careful not to use too many actions (only when they are necessary), because they are difficult to run locally on your own computer because they use GitHub's Workflow Engine that, at the time of this writing, does not have the ability to be called from a desktop application. This means that it might be hard to run the action locally to see if it is correct and therefore developers will have a slow feedback loop.
-
GitHub - nektos/act: Run your GitHub Actions locally 🚀 works for most actions.
-
To debug your CI/CD pipelines effectively, consider setting up a temporary self-hosted GitHub agent. This allows you to run builds and inspect the application and build server outputs in detail. You can also integrate "sleep" steps into your workflow to pause execution at key points for thorough examination of the process and file system.
What is a Pipeline?
A pipeline is like a project manager for your build scripts. It orchestrates and automates the steps needed to build, test, and deploy your software.
Key Functions:
-
Workflow Orchestration: Runs build scripts in a defined order across different environments (e.g., Windows, Linux).
-
Parallel Execution: Improves efficiency by running tasks concurrently when possible.
-
Status Monitoring: Provides insights into build progress, individual steps, and error troubleshooting.
-
Build Server Management: Selects appropriate build servers for specific tasks.
Benefits of Pipelines:
-
Increased Efficiency: Automates and streamlines the build process.
-
Improved Reliability: Ensures consistent builds across environments.
-
Enhanced Visibility: Provides clear insights into build status and errors.
-
Faster Feedback Loop: Enables developers to quickly identify and fix issues.
Pipeline Runs:
-
Each execution of a workflow is called a pipeline run.
-
Provides insights into pipeline status and allows for cancellation if needed.
-
Can be configured to send notifications to developers on failures or other events.
Pipeline Status:
-
Green Pipeline: Indicates a successful build. However, ensure your build script is meaningful and actually verifies code quality.
-
Red Pipeline: Signals a build failure. Investigate and fix the issue to unblock software delivery.
-
Remember: A pipeline is only as good as the build scripts it runs. Ensure your scripts perform relevant tasks and tests to guarantee code quality.
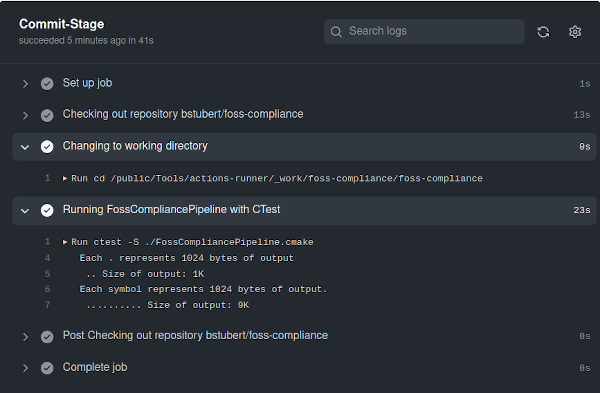
A Basic Continuous Integration Pipeline with GitHub Actions -- Burkhard Stubert (embeddeduse.com)
What is a build server?
A build server is a dedicated machine or cluster that automates the software build process, ensuring consistency and generating build artifacts for production. Triggered by events like code changes or pull requests, it clones the code, executes build scripts in an ephemeral environment, and provides a single point of truth for build results.
Build servers offer several advantages over local builds:
-
Consistency: Eliminates discrepancies between developer environments.
-
Reliability: Provides a stable and controlled build environment.
-
Centralization: Acts as a central point of reference for build status.
-
Build servers are typically disposable and replaceable, existing in pools, and can be hosted in the cloud or on-premise. They remain idle until triggered by a CI/CD system.
Helpful tips and best practices
-
You might find it helpful to use an IDE Plugin, such as Github Workflows plugin in the IntelliJ IDEA IDE to author the workflow files. This is because the syntax can be fussy.
-
Try to keep it to one command per step. It helps make the flow a bit more logical. Why can't I put everything in a single step? In theory, you could, but this would make it very difficult to know which step failed--you'd have to open up the step and check the logs. Notifications to stakeholders commonly include the failed step, so this is a useful debugging tool and helps you segment the logs for faster debugging. They're also needed for matrix builds, but we'll get to that later.
-
Space out your steps by an empty line
-
If the script starts getting long (i.e., more than a few lines), consider making it a separate script file, and then calling it in the runner.
-
It's important to use the OS that you're developing on, because you have to be able to run those build scripts locally. So, if you have bash scripts on your CI server but can't run them locally (for whatever reason), then this means that the environments can't really be reproducible, because you have to ensure parity between the scripts on your computer and the CI. There are pros and cons though, as macOS cannot run cmd scripts for example.
-
Remember that the dash means a new step. For example, the name key is prefixed with dash and this represents a new step.
-
It's good to give steps names, otherwise they might not be clear what they're doing. Names are optional, however.
-
It's very important that you keep this workflow formatted. Therefore, tools like yamllint are very useful. Poor indenting can make it super, super difficult to know what's wrong.
-
If you're really stuck, look at a reference workflow file (that is properly formatted) to get your bearings.
-
Normally, you'd want to set the runs-on to your development environment, assuming that that is the same environment where you are deploying to. If you need to run on multiple environments, you can use matrix builds (an advanced topic.)
Build notifications
Webhooks are a mechanism for one system to notify another system of events or updates in real-time. In the context of continuous integration (CI), webhooks are essential for facilitating automation and communication between various tools and services in the CI/CD pipeline. For example, if a build fails, then a webhook can be called, which can "send" a message to another service, such as Teams, Slack, and many others.
Webhooks are widely supported among many different integration providers.
-
Build notifications are important because stakeholders must know if the build pipeline is failing, as it is the only route to deliver changes to production.
-
Consider the audience for your build notifications. Normally, fixing a broken build is a shared team effort, so create a DL (Distribution List or a Distribution Group) or group with relevant team members. Avoid including individuals like the CEO.
-
Set up immediate email/Slack notifications for pipeline failures through your CI/CD's integrations or webhooks.
-
Note that not all pipelines require build notifications. Only those blocking the path to production, such as main branch pipelines, need them.
-
Configure notifications to alert stakeholders impacted by broken builds using suitable channels like Teams, text messages, or emails, triggered only during failures.
Security
-
Continuous Integration and Continuous Delivery (CI/CD) aim to streamline the development process by swiftly moving changes from a developer's environment to production. However, this rapid process can inadvertently introduce security risks, allowing malicious code to infiltrate production should an attacker gain access to a compromised account. This means that an attacker can easily push code to production--a two-edged sword. Therefore, having a good review system in place, along with 2FA (two factor authentication, requires that employees use their phone or other device to log in), dual-approval (two employees must approve of the changes before they go into production), dependency scanning, security scanning on code via SAST (static analysis), secret management, branch protection to limit who can and can't push to master, and YubiKeys can potentially limit or negate the damage done by attackers. Make sure to use proper identity management techniques by your provider, and don't share accounts.
-
While CI/CD pipelines often run in isolated containers or virtual machines, this isolation isn't a bulletproof shield. Isolation prevents interference with other systems on the host, but it doesn't safeguard the contents within or shield them from potential internet threats. If, for instance, the CI/CD pipeline fetches a malicious resource, such as a malicious package, it could contaminate the build artifacts, propagating to customers, the production environment, or other artifacts.
-
Moreover, CI/CD pipelines often possess secrets, usually in the form of environment variables or temporary files. If malicious scripts exploit these, they can access external resources by exporting the token, potentially racking up costs or jeopardizing sensitive data.
-
Notably, hardcoding application credentials is risky. Even if they speed up prototyping, these hard coded secrets can be exposed, especially in open-source scenarios, leading to unauthorized access and potential misuse. And while storing API keys in a secure location might seem like a solution, at some point, these keys exist in plaintext, making them vulnerable.
-
CI/CD is aimed at making it super easy to deploy to production, but not everyone should be deploying to production, mainly hackers. The answer isn't just about the choice between long-lived SSH keys or temporary tokens, as highlighted in the provided StackOverflow post. It's about a holistic approach to CI/CD security. Tools like YubiKeys provide an extra layer of security, but they aren't silver bullets. Physical devices, while helpful, can be lost or stolen. Thus, backup authentication methods and proactive monitoring are essential.
-
Moreover, SMS-based two-factor authentication (2FA) isn't entirely secure due to risks of SIM swapping and SMS interception. In this realm, requiring multiple engineers to approve critical actions, leveraging platforms like Azure PIM, Google Cloud Identity, or AWS SSO, can add another layer of safety.
-
When it comes to codebase and artifact access, only authorized individuals should have the rights. Furthermore, continuously monitoring the server side to ensure no unusual requests are made is pivotal. Secrets, API keys, or any form of authentication should be kept out of the codebase. Instead, leverage tools like KeyVault to store and access these secrets securely. Also, periodically run static security analysis tools to detect and rectify any exposed secrets in the codebase.
-
Shifting left on security implies embedding security considerations from the start of the development process, rather than retrofitting them later. It's about ensuring that security is integrated from the onset and that reactive measures are minimized. After all, in the dynamic landscape of CI/CD, prevention is always better than cure.
Popular security static analysis tools
Open-Source Tools
- FindBugs with FindSecBugs Plugin: A static code analysis tool for Java that can identify security vulnerabilities with the FindSecBugs plugin.
- Checkmarx: Although primarily a commercial tool, Checkmarx does offer a limited free version that performs static code analysis for multiple languages.
- Bandit: Focuses on Python codebase and is designed to find common security issues.
- Brakeman: A static analysis tool for Ruby on Rails applications.
- SonarQube: Offers various language plugins and detects many types of vulnerabilities. The Community Edition is free.
- ESLint with Security Plugin: A widely-used linting tool for JavaScript that can also be used for security checks with the right set of plugins.
- Flawfinder: Scans C and C++.
- Cppcheck: Another static analysis tool for C/C++ codebases.
- YASCA (Yet Another Source Code Analyzer): Supports multiple languages including Java, C/C++, and HTML, but focuses primarily on web vulnerabilities.
Commercial Tools
- Checkmarx: A leading SAST tool that supports multiple programming languages and is designed for enterprise use.
- Veracode: Offers a static analysis service as part of a larger application security suite.
- Fortify Static Code Analyzer: Provided by Micro Focus, it covers multiple languages and offers integration with IDEs and CI/CD tools.
- IBM AppScan: Focuses on identifying vulnerabilities in web and mobile applications, supporting multiple programming languages.
- Kiuwan: Offers a broad range of language support and integrates with various IDEs and CI/CD tools.
- Synopsys Coverity: Supports multiple languages and offers CI/CD integration.
Integrating with External Services and Tools
Sometimes, your build pipeline might need to connect to other services because it doesn't have all of the information it needs inside of the repository. This is because there are external APIs, artifact repositories, secret managers, etc. that can't be part of the repository.
Why would you want to connect to external services, isn't everything I need in my repository? There are some things that can't be in your repository, because they are integrations, APIs, or managers that don't have a "physical" presence.
Security Reasons
Sensitive information, like API keys, database credentials, and other secrets, should never be stored directly in your repository. It's a security risk. Instead, these secrets are typically stored in specialized tools called secret managers (like HashiCorp's Vault, AWS Secrets Manager, or Azure Key Vault). When your pipeline needs to access a database or an external API, it will first fetch the necessary credentials from these managers. This ensures that sensitive information remains secure and doesn't accidentally get exposed or leaked.
Artifact Management
In many CI/CD pipelines, especially in large and complex projects, compiled code or built artifacts need to be stored or fetched. These artifacts are stored in artifact repositories like JFrog Artifactory or Nexus Repository. Connecting to these repositories can help fetch dependencies or store new ones post-build.
Integration and End-to-End Testing
Modern applications often rely on a myriad of microservices. When testing, it's crucial to ensure that these services work well together. For this, your pipeline might need to connect to service stubs, mocks, or even real services in a staging environment to perform integration or end-to-end tests.
Setup would depend on your CI software. You may need to connect a service to it.
After that, the secrets are normally available via environment variables in your pipeline. Typically, connecting to a service will pass along the inherited identity from the pipeline to the service, thereby authenticating you to it. Sometimes, you will need to manage these secrets manually.
Exercises
Set up a very simple pipeline. This pipeline should initially not be attached to PRs but instead run after a commit is merged. This is because there might be many mistakes while you set up the pipeline, and it might add an unnecessary blocker to those trying to merge. The pipeline should be as simple as possible and should just build the code and then run the simple test suite. Don't worry about publishing build artifacts, it should only build the code and return a status regarding if the build succeeded or failed. Make sure that the test suite runs and confirm in the logs that the test name and status show up correctly so as to diagnose any failing tests. Try to use a build template to build your application, and make sure that the template reflects the build script as closely as possible.
Set up the continuous integration server (or build server) to compile and run the code. Using the information derived from the planning stage, set up the build server to compile and build the code as a baseline. Developers will perform changes on the codebase, and should have sufficient tooling on their workstation to test the changes. This tooling should match what is run on the continuous integration system. It is important that developers have a stable copy on their workstation so that they can perform changes to the code because otherwise it would be overwritten by other developers' work. It is important that the tooling on the developer's machines matches the tooling on the build server because the build server's artifacts will be what is deployed. There should be sufficient tooling on the continuous integration system to make sure that there is a reasonable level of confidence that the changes are good. Choose activities that are prime for automation and are difficult for humans to do, such as compiling code, checking (tests), etc.
Continuously review and refine: Continuously review and refine the documented process. Encourage feedback from the team for improvements.
Outputs and Job Communication
Step outputs ($GITHUB_OUTPUT)
Use step outputs to pass small pieces of data (strings) to later steps in the same job.
jobs:
  build:
    runs-on: ubuntu-latest
    steps:
      - id: version
        run: echo "VERSION=1.2.3" >> "$GITHUB_OUTPUT"

      - name: Use version
        run: echo "Version is $VERSION"
        env:
          VERSION: ${{ steps.version.outputs.VERSION }}
Job outputs (jobs.<job>.outputs)
Use job outputs to pass data between jobs (requires needs: so the producer runs first).
jobs:
  job1:
    runs-on: ubuntu-latest
    outputs:
      release_url: ${{ steps.create.outputs.url }}
    steps:
      - id: create
        run: echo "url=https://example.com/release/123" >> "$GITHUB_OUTPUT"

  job2:
    runs-on: ubuntu-latest
    needs: job1
    steps:
      - run: echo "Release URL is ${{ needs.job1.outputs.release_url }}"
Artifacts (files between jobs)
If you need to share files (not small strings), upload/download artifacts between jobs using actions/upload-artifact and actions/download-artifact.
Environments and Environment Variables
Each step runs in its own process. Steps in the same job share the same workspace on disk (filesystem changes persist), but shell variables set inside a step do not automatically persist to the next step.
Persisting env vars across steps ($GITHUB_ENV)
steps:
  - name: Set env var for later steps
    run: echo "FOO=bar" >> "$GITHUB_ENV"

  - name: Read env var
    run: echo "$FOO"
Important caveat: secrets in if:
GitHub does not allow ${{ secrets.X }} directly in if:. If you need conditional logic, pass the secret to an env: variable and test that instead.
Webhooks and External Notifications
Webhooks let external systems trigger workflows. This enables ChatOps-style controls (e.g., triggering a deployment from Slack or Teams). For GitHub Actions, use repository_dispatch for externally-triggered workflows:
on:
  repository_dispatch:
    types: [deploy-production]
Treat webhook triggers as production-impacting: require authentication and authorization. Store webhook URLs and tokens in GitHub Secrets, and limit who can trigger dispatch events.
Setting up your repository: Build tools and more
Introduction
Clicking "Run" or "Start" in an IDE initiates a sequence of command-line tools that compile and manage dependencies to create build artifacts, simplifying the complex process with a single button. This abstraction can obscure the specific tools used, complicating tool selection for CI/CD pipelines.
What do I deliver to the customer, i.e., what are build artifacts? A typical software release often includes several components, tailored to the nature of the software and the target audience. Here are some of the common elements you might find:
- Binaries: These are the compiled code files that are executable on the target platform(s). For desktop applications, these might be
.exefiles for Windows,.apppackages for macOS, or binaries for Linux. For mobile applications, these would be.apkfiles for Android or.ipafiles for iOS. - Libraries: If the software relies on specific libraries, these may either be bundled with the binaries or referenced as dependencies that need to be installed separately.
- Documentation: This can include user manuals, release notes, and API documentation. Release notes are particularly important as they typically outline the new features, bug fixes, and known issues in that release.
- Source Code (in some cases): For open-source software, the source code is often provided along with the binaries. Even in some proprietary contexts, source code may be provided to certain customers under specific agreements.
- Installation Scripts/Programs: These are scripts or executable files that help users install the software on their system. This could include setup wizards for Windows, package installers for Linux, or dmg files for macOS.
- Configuration Files: These files are used to configure the software for initial use, or to customize its operation. They might be in the form of XML, JSON, or other formats.
- Database Files: If the application uses a database, the release might include database scripts to set up schemas or initial data sets.
- License and/or Copyright Information: Legal documentation specifying the terms under which the software is provided.
- Digital Signatures/Certificates: For security, the binaries and installer might be digitally signed to assure users that the software is genuine and has not been tampered with.
- Additional Resources: This can include images, icons, data files, or other resources needed for the software to function correctly.
- Patches/Updates: If the release is an update or patch to existing software, it may only include files that have been changed rather than the entire software package.
The contents of a software release can vary widely depending on the type of software, the platform it's being released on, and the policies of the developing company or organization. In enterprise environments, additional components like deployment guides, training materials, and support information may also be included.
The main artifact is the executable, or code, and are typically produced via your IDE. Sometimes, for manual build processes, there may be a team who is responsible for packaging the various build materials.
Visual Studio (for C++/C#)
- Build Commands
Visual Studio uses
msbuildto build projects. To see the exact commands: - Open the Tools menu.
- Select Options.
- Navigate to Projects and Solutions → Build and Run.
- In the MSBuild project build output verbosity dropdown, choose Detailed or Diagnostic.
- Build Order The build order appears in the output window during a build (especially with verbosity set to Detailed or Normal).
Note: Build logs are primarily for troubleshooting. In legacy or complex projects, you might sometimes need to provide custom commands.
IntelliJ IDEA (for Java)
- Build Commands
- The IDE uses its own builder. For Maven or Gradle builds:
- Open the Terminal tab.
- Run your build tool command (e.g.,
mvn compilefor Maven). - The executed commands are printed in the terminal.
- Build Order
- When using tools like Maven, the lifecycle phases determine the order. The order is also visible in the Build tool window messages.
Eclipse (for Java)
- Build Commands
- Eclipse uses its internal builder. To view detailed build info:
- Go to Window → Preferences.
- Navigate to General → Workspace.
- Enable Verbose output for the build.
- Build Order
- Eclipse handles the build order internally. For more complex projects (often using Maven), the build lifecycle phases clarify the sequence.
Xcode (for C++/Swift/Objective-C)
- Build Commands
- Open Xcode from the top menu.
- Select Preferences and go to the Locations tab.
- Set the Derived Data location to Relative.
- After building, check the Report Navigator (rightmost tab) to view build logs.
- Build Order
- The order is determined by your project dependencies and can be reviewed in the build logs in the Report Navigator.
Overall: Reviewing the output or log pane during builds is the best way to understand the commands executed and their sequence.
Build Tool Selection and CI Best Practices
When choosing build tools and configuring your CI pipeline, consider these guidelines:
-
Favor Specific, Portable Tools Over Hacking A poor tool selection can lead to “CI bad smells.” Relying on custom shell scripts to patch issues may work initially but can later cause maintainability and portability problems. Instead, use established plugins and ensure tool versions do not conflict on your CI server.
-
Avoid Out-of-the-Box Configurations Default configurations for external tools might not be optimal. Involve developers when defining quality gates instead of relying solely on customer requirements. This collaborative approach helps avoid irrelevant warnings and keeps the CI process efficient.
IDE Dependency and Portability Issues
Build scripts can become too tightly coupled with the IDE, leading to several problems:
-
Hard-Coded Paths: Some IDEs install build tools in fixed locations. If your configuration references these paths, it can make your project IDE dependent, limiting portability.
-
Configuration Challenges: Mixing personal IDE preferences with essential build settings can make collaboration difficult. Different environments (including CI servers) may not replicate the same configuration, leading to errors.
-
Reproducibility on CI: Custom IDE settings, specific software versions, or environment variables injected at build time might not be available on CI. This discrepancy can change application behavior and hinder reliable builds.
Identifying Project Build Types
Determining the type of project and its build process can be done using a few heuristics:
-
Use GitHub Linguist: Analyze the project’s primary languages. For example, if a project shows a high percentage of TypeScript and contains a
package.json, it’s likely an npm project. -
Common Build Flows by Language:
-
Java: Code → Bytecode → Run on JVM.
-
Python: Code is interpreted.
-
C#: Code compiles into DLLs or EXE files.
-
Check for Dependency Manifests: Look for files like
package.json,Gemfile,pom.xml, etc., in the root directory. These files indicate the project type and guide you on how to build and test it.
Examples of Dependency Manifests and Build Commands
Below are several examples (from Heroku buildpacks) that illustrate how different project types are detected and built:
-
Ruby
-
Files: Gemfile, Rakefile
-
Build: Not compiled in the traditional sense
-
Test:
rake test -
JavaScript/TypeScript
-
Files: package.json
-
Build:
npm ciornpm install(or corresponding Yarn commands; be cautious if both package-lock.json and yarn.lock exist) -
Test:
npm test -
Clojure
-
Files: project.clj
-
Build:
/bin/buildorlien compile? -
Test:
lien test -
Python
-
Files: requirements.txt, setup.py, Pipfile
-
Build: Use pip to install dependencies
-
Test:
python -m unittest(varies by project) -
Java (Maven)
-
Files: pom.xml (and related variants: pom.atom, pom.clj, etc.)
-
Build:
mvn compile -
Test:
mvn test -
Java (Gradle)
-
Files: build.gradle, gradlew, build.gradle.kts, settings.gradle, settings.gradle.kts
-
Build:
gradlew {check, test, build, etc.} -
Test:
gradlew test -
PHP
-
Files: index.php, composer.json
-
Build:
composer install -
Test: Varies depending on the application
-
Go
-
Files: go.mod, Gopkg.lock, Godeps/Godeps.json, vendor/vendor.json, glide.yaml
-
Build:
go build -
Test:
go test -
C#
-
Files: .sln, .csproj, .fsproj, .vbproj
-
Build: Typically
dotnet build -
Test: Typically
dotnet test -
C/C++
-
Files: Look for Makefile, CMakeLists.txt (for CMake), or .pro files (for qmake)
-
Build/Test: Depends on the build system (e.g., make, cmake, qmake)
-
Note: Makefiles can be used for various project types and might require inspection of the commands (gcc, g++, as, ld, etc.).
Typically, software development projects are complex and there may be different interpretations of what a project is. When organizing code, there are two main approaches: mono repo and multi repo.
Mono Repo:
-
Advantages: Simplifies interdependency management, as all components are in one repository. Easier deployment and versioning together.
-
Disadvantages: Git clone can become slow over time, though this can be mitigated by partial clones or Git VFS.
Multi Repo:
-
Advantages: Each component has its own repository, allowing for independent deployment and versioning. This approach encourages creating public APIs for interaction.
-
Disadvantages: Managing changes across many repositories can be complex, especially when multiple repositories need simultaneous updates.
Security:
- Multi repo offers better access control, as different repositories can have separate permissions.
Flexibility:
- Switching between mono repo and multi repo setups can be challenging and may disrupt Git history. Splitting a mono repo into multiple repos is generally easier than merging multiple repos into one.
If you're working with multiple developers, you may want to set up a GitHub organization to help manage multiple users access to your repositories. However, there are some security settings you should pay particular attention to. Below are the recommended settings when creating a new GitHub organization.
Setting up user accounts on GitHub
Setting up user accounts in GitHub Enterprise and ensuring secure access involves several steps. Here's a comprehensive guide to help you manage user accounts and enforce security measures like two-factor authentication (2FA) for accessing your GitHub repository.
Step 1: Create and Configure User Accounts
For GitHub Enterprise Server (Self-Hosted):
- Login as an Administrator:
- Sign in to your GitHub Enterprise Server as an administrator.
- Navigate to the Admin Dashboard:
- Click on the upper-right profile or organization icon, then select "Enterprise settings."
- Manage Users:
- Under the "Users" menu in the sidebar, click on "All users."
- Here, you can add new users by clicking "Invite user" and entering their email addresses. Users will receive an invitation to join your GitHub Enterprise environment.
For GitHub Enterprise Cloud:
- Organization Setup:
- As an organization owner, go to your organization's page.
- Click "People" and select "Invite member" to add new users by entering their GitHub usernames or their email addresses.
Step 2: Configure Permissions
- Assign Roles and Teams:
- Assign users to specific teams within your organization to manage repository access effectively.
- Teams can be created from the "Teams" tab in your organization settings. After creating a team, you can manage repository access and permissions through the team settings.
- Set Repository Permissions:
- For each repository, you can specify who has read, write, or admin access. Navigate to the repository settings, click on "Collaborators & teams," and then add the teams or individuals with the appropriate access levels.
Step 3: Enforce Security Policies
- Enable Two-Factor Authentication (2FA):
- For enhanced security, enforce two-factor authentication for all users.
- In GitHub Enterprise Cloud, go to your organization's settings, select "Security," then under "Authentication security," choose "Require two-factor authentication for everyone in your organization."
- For GitHub Enterprise Server, navigate to the admin dashboard, select "Settings," find the "Authentication" section, and enforce 2FA by checking "Require two-factor authentication for all users."
Step 4: Secure Connections
- Use HTTPS or SSH for Repository Access:
- Ensure that all users access repositories using HTTPS or SSH.
- Encourage users to set up SSH keys for a secure connection without needing to supply username and password each time. This can be done under their personal account settings by selecting "SSH and GPG keys" and adding a new SSH key.
Step 5: Audit and Compliance
- Regular Audits:
- Regularly audit user access and permissions to ensure compliance with your organization's policies.
- Use the audit log feature to monitor activities. Access this in GitHub Enterprise Server by going to the admin dashboard and selecting "Audit log." For GitHub Enterprise Cloud, find it under your organization settings.
- Continuous Training:
- Continually educate users on security best practices, including the importance of strong passwords, recognizing phishing attacks, and securely managing their authentication credentials.
Additional Recommendations
- Review Third-Party Access: Regularly review and manage third-party application access from your organization's settings to ensure that only trusted applications have access to your data.
- IP Whitelisting: If using GitHub Enterprise Server, consider configuring IP allow lists to control which IP addresses are permitted to access your instance.
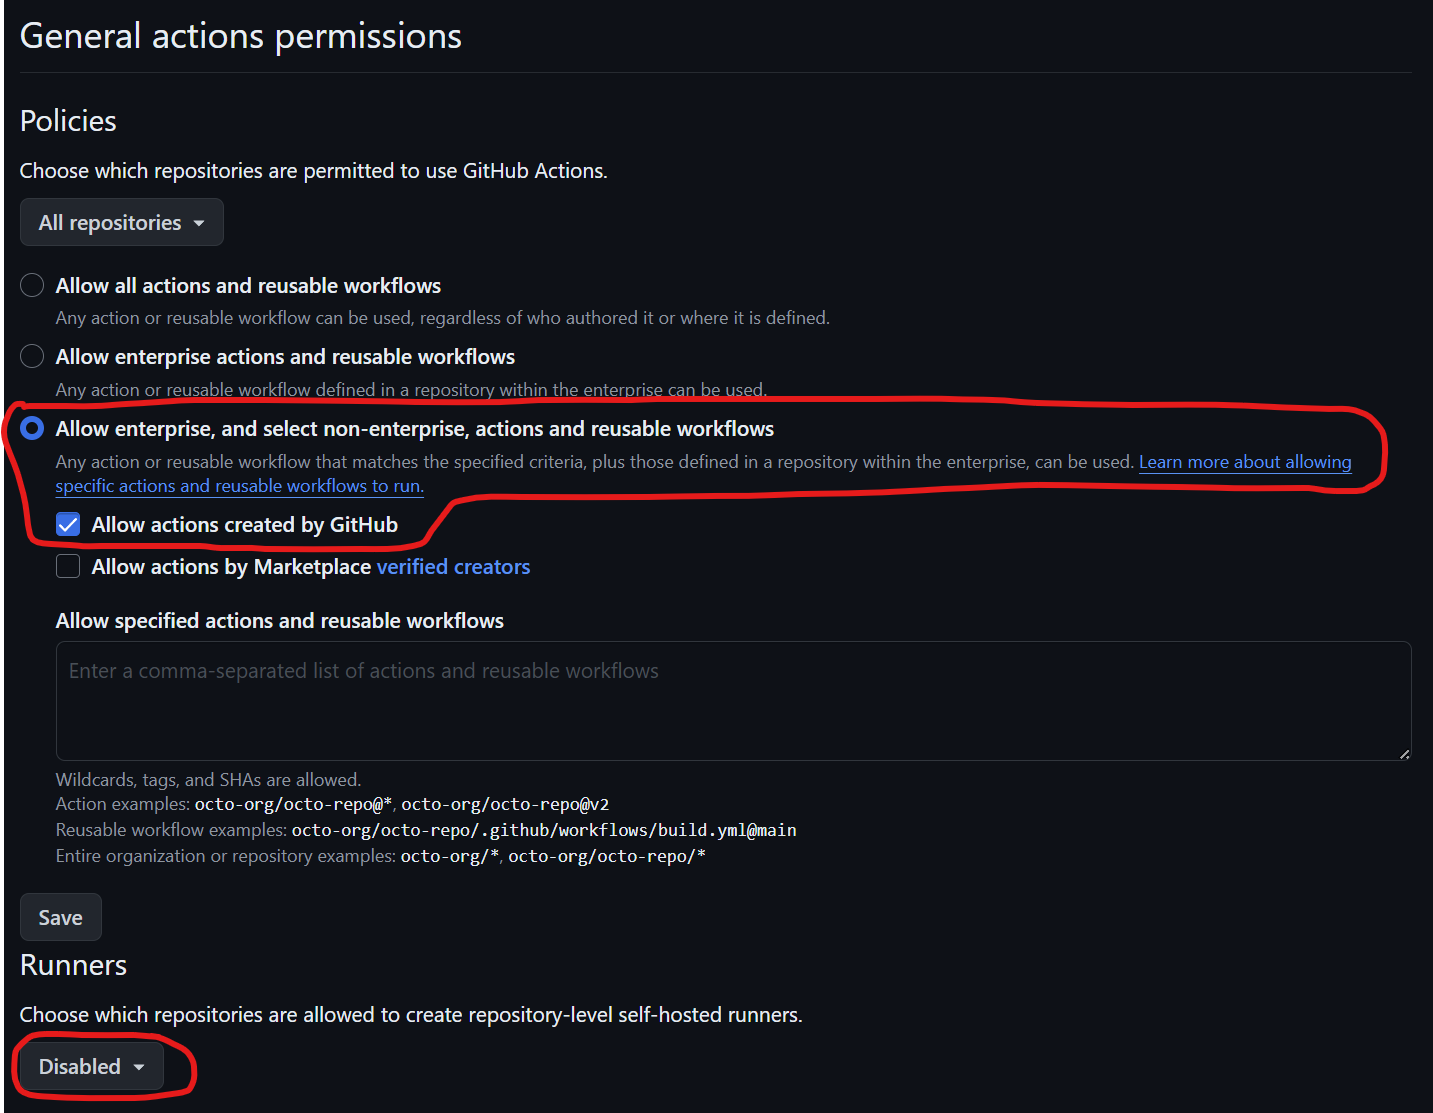
When you first set up your GitHub Actions enterprise repository, you may want to change a few things in the general actions permissions. First, allow "enterprise" and select "non-enterprise" actions and reusable workflows. Specifically, you want to only allow actions created by GitHub and disable the repository-level self-hosted runners. This is because allowing actions created by GitHub is technically a trusted source. However, if you allow actions from the marketplace, you must be careful about the creators you're using. If you only reference the version hash of that workflow file, arbitrary code could be executed. There have been instances where such code was not amenable to what you're trying to run in your repository. Additionally, avoid using self-hosted runners as they might allow someone to control or modify outputs for your runners, potentially injecting malicious code.
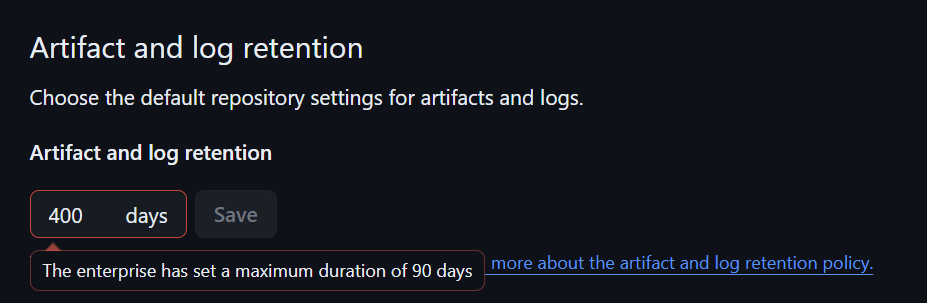
The next one is artifact and log retention. Set it to the maximum value—90 days in this case. This allows you to check for any malicious code that might have interrupted or interacted with your repository by reviewing the logs to see when a certain dependency was injected. It's also useful for debugging. For example, if you want to check if a build was contaminated with malware, or if you’re testing and need to determine which version was vulnerable to a security issue, retaining artifacts and logs is crucial. For an enterprise, it might also support auditing requirements.
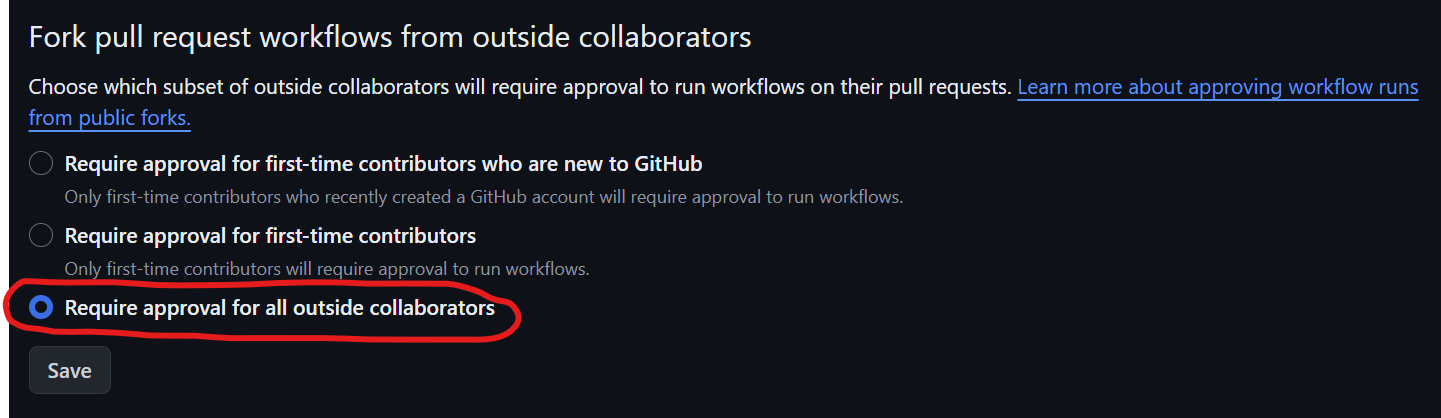
For fork pull request workflows from outside collaborators, enable the "Require approval for all outside collaborators" option. This is crucial because you don't want workflows to run automatically when any collaborator forks your repository and makes a pull request. Without approval, those pull requests could contain malicious code that either consumes your repository resources (like for Bitcoin mining) or tries to access secrets. Although GitHub has improved security, there's still a risk of arbitrary code running on your runners. This is especially important if you're using self-hosted runners, where someone could execute arbitrary code. It's better to enforce these settings at the enterprise or repository level to avoid accidental modifications to workflow files, which could compromise your processes.
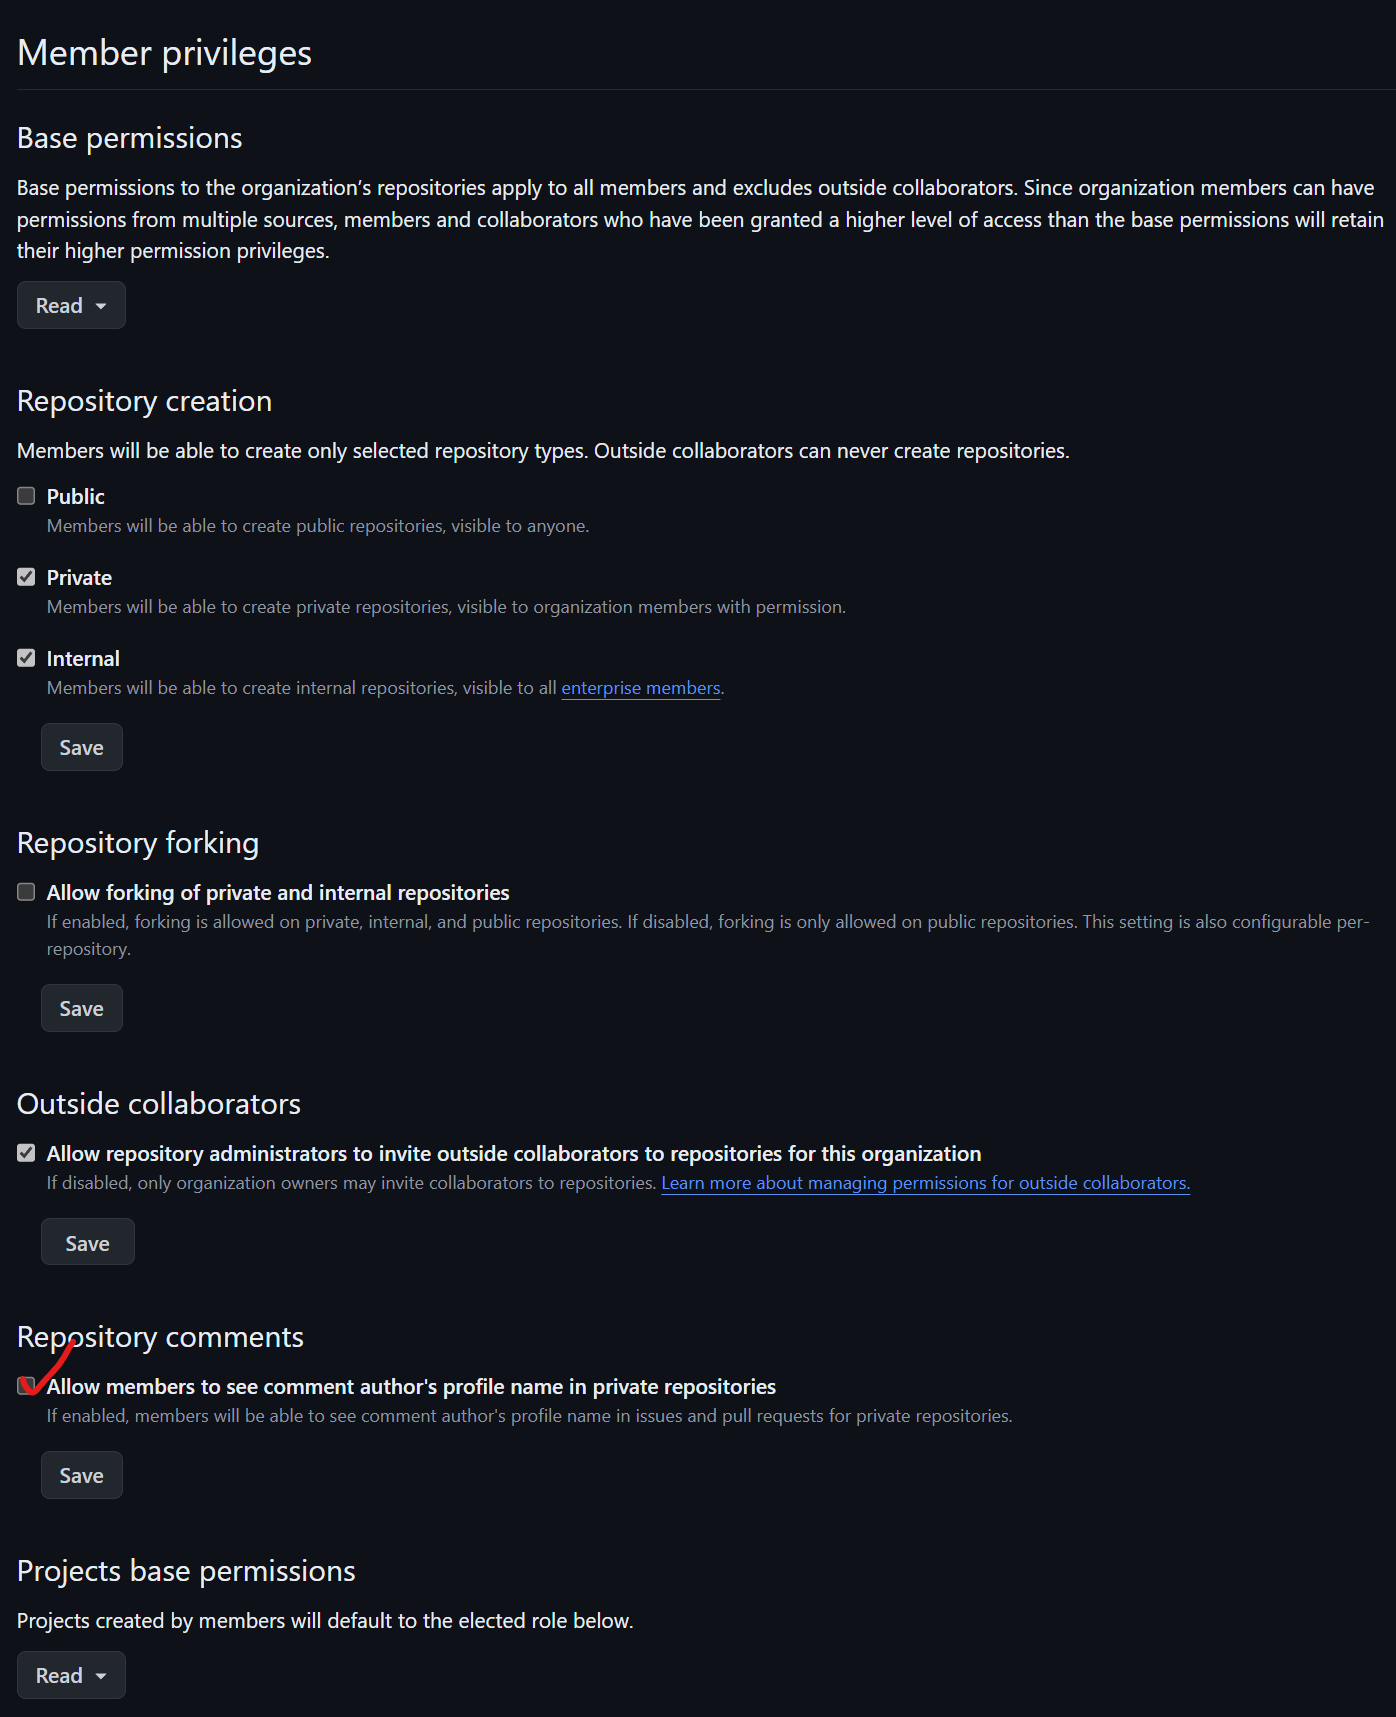
For member privileges under repository comments, check the box "Allow members to see comment authors' profile name" in private repositories. This helps identify who made a comment, providing more transparency and accountability within your team. It’s particularly useful when multiple contributors are involved, ensuring that feedback and discussions are attributed correctly.
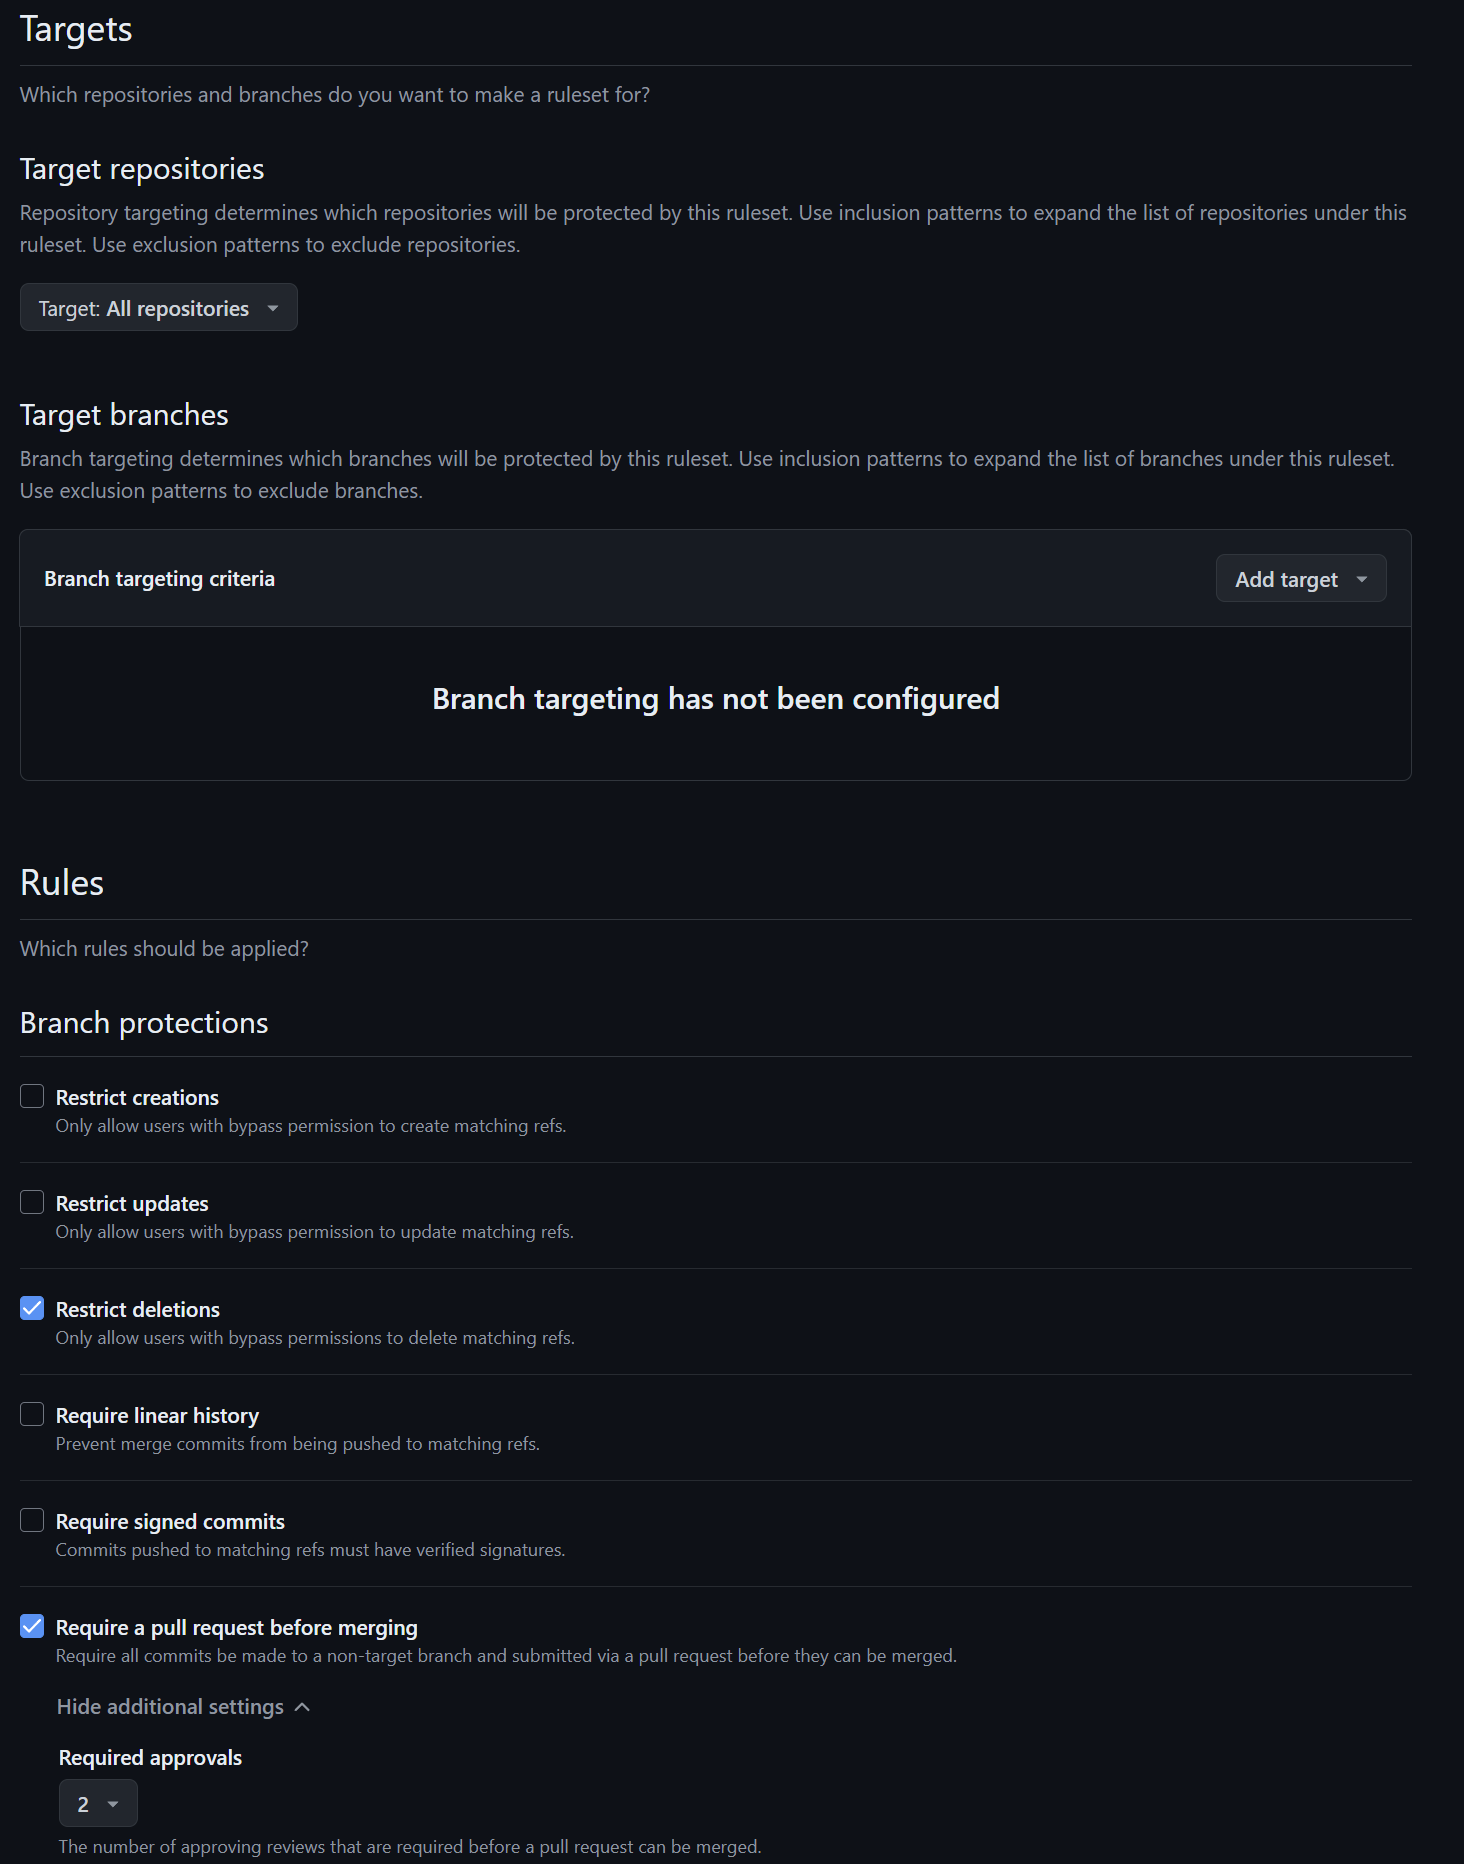
Under Rules, there are several settings to check. First, require a pull request before merging. Set the required approvals to at least two, unless there's only one person on your team. This ensures at least one other person approves the pull request. Requiring a pull request before merging ensures that continuous integration runs, preventing random merges.
Next, dismiss stale pull request approvals when new commits are pushed. This is because an approval is based on the current state. If new code is pushed, it's a different pull request and needs re-approval.
Require a review from code owners to ensure certain parts of the repository get the proper review before updates.
Check "Require approval of the most recent reviewable push." This ties into the required approvals, ensuring each new push gets fresh approval.
Require conversation resolution before merging for auditing and to ensure all feedback is addressed.
Require status checks to pass to confirm continuous integration tests succeed.
This is a critical setting for CI/CD: Configure your CI workflow to run automatically when a pull request is opened or updated (using triggers like on: pull_request). Then, select the specific CI job(s) here to ensure they must pass successfully before the PR can be merged, acting as an automated quality gate.
Check "Require branches to be up-to-date before merging" to prevent issues when merging. However, this can create a bottleneck in large teams, as merging each pull request may take longer.
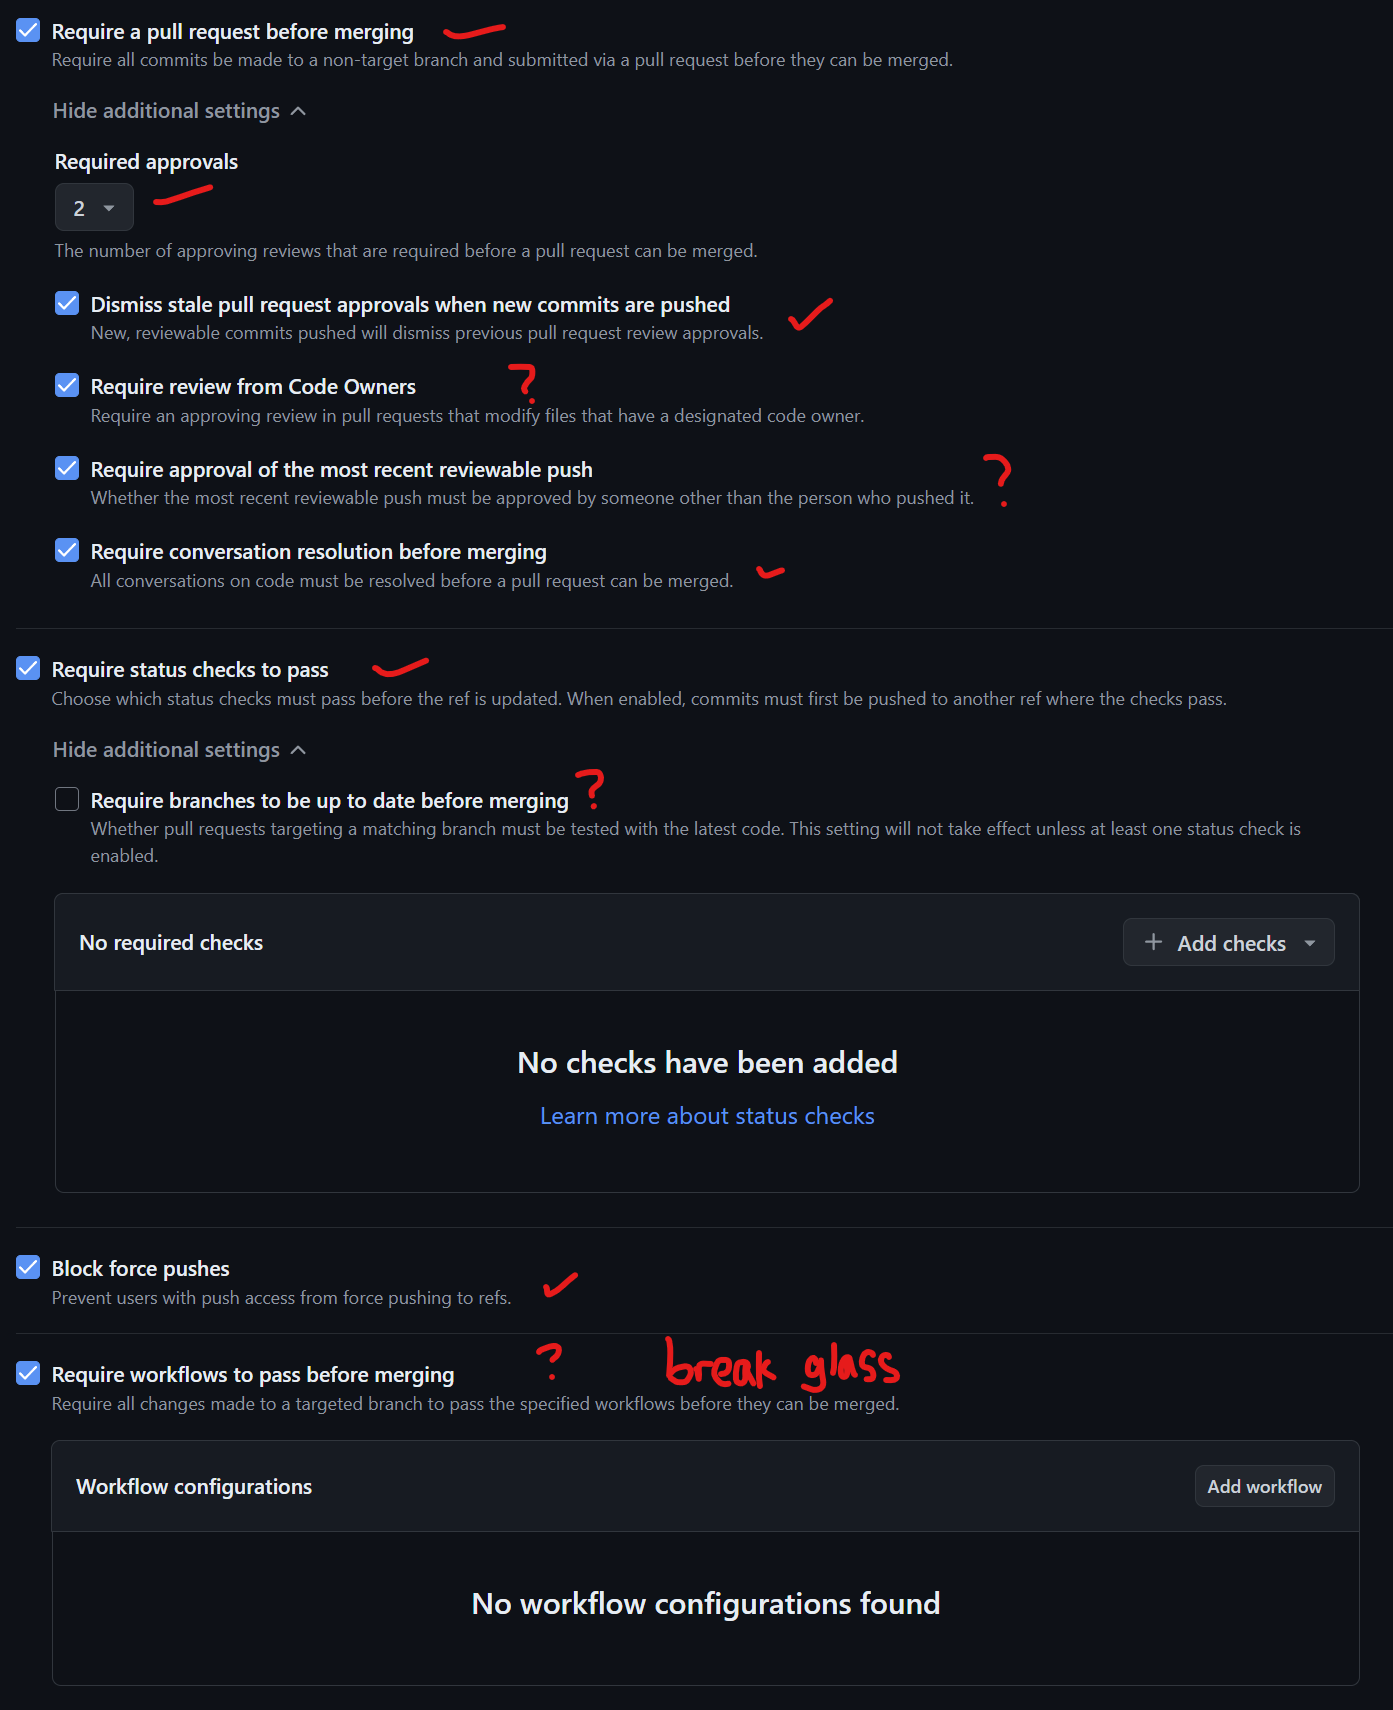
Under Rules, check "Block force pushes" to prevent rewriting history. This is crucial for auditing and ensures that others pulling the repository don't need to rebase unexpectedly.
You might also consider "Require workflows to pass before merging." However, it's wise to have a "break-glass" procedure for emergencies. For example, if your CI system is broken or you need to fix an urgent bug, bypassing checks can be necessary. This approach helps maintain operational flexibility while keeping security and stability in mind.
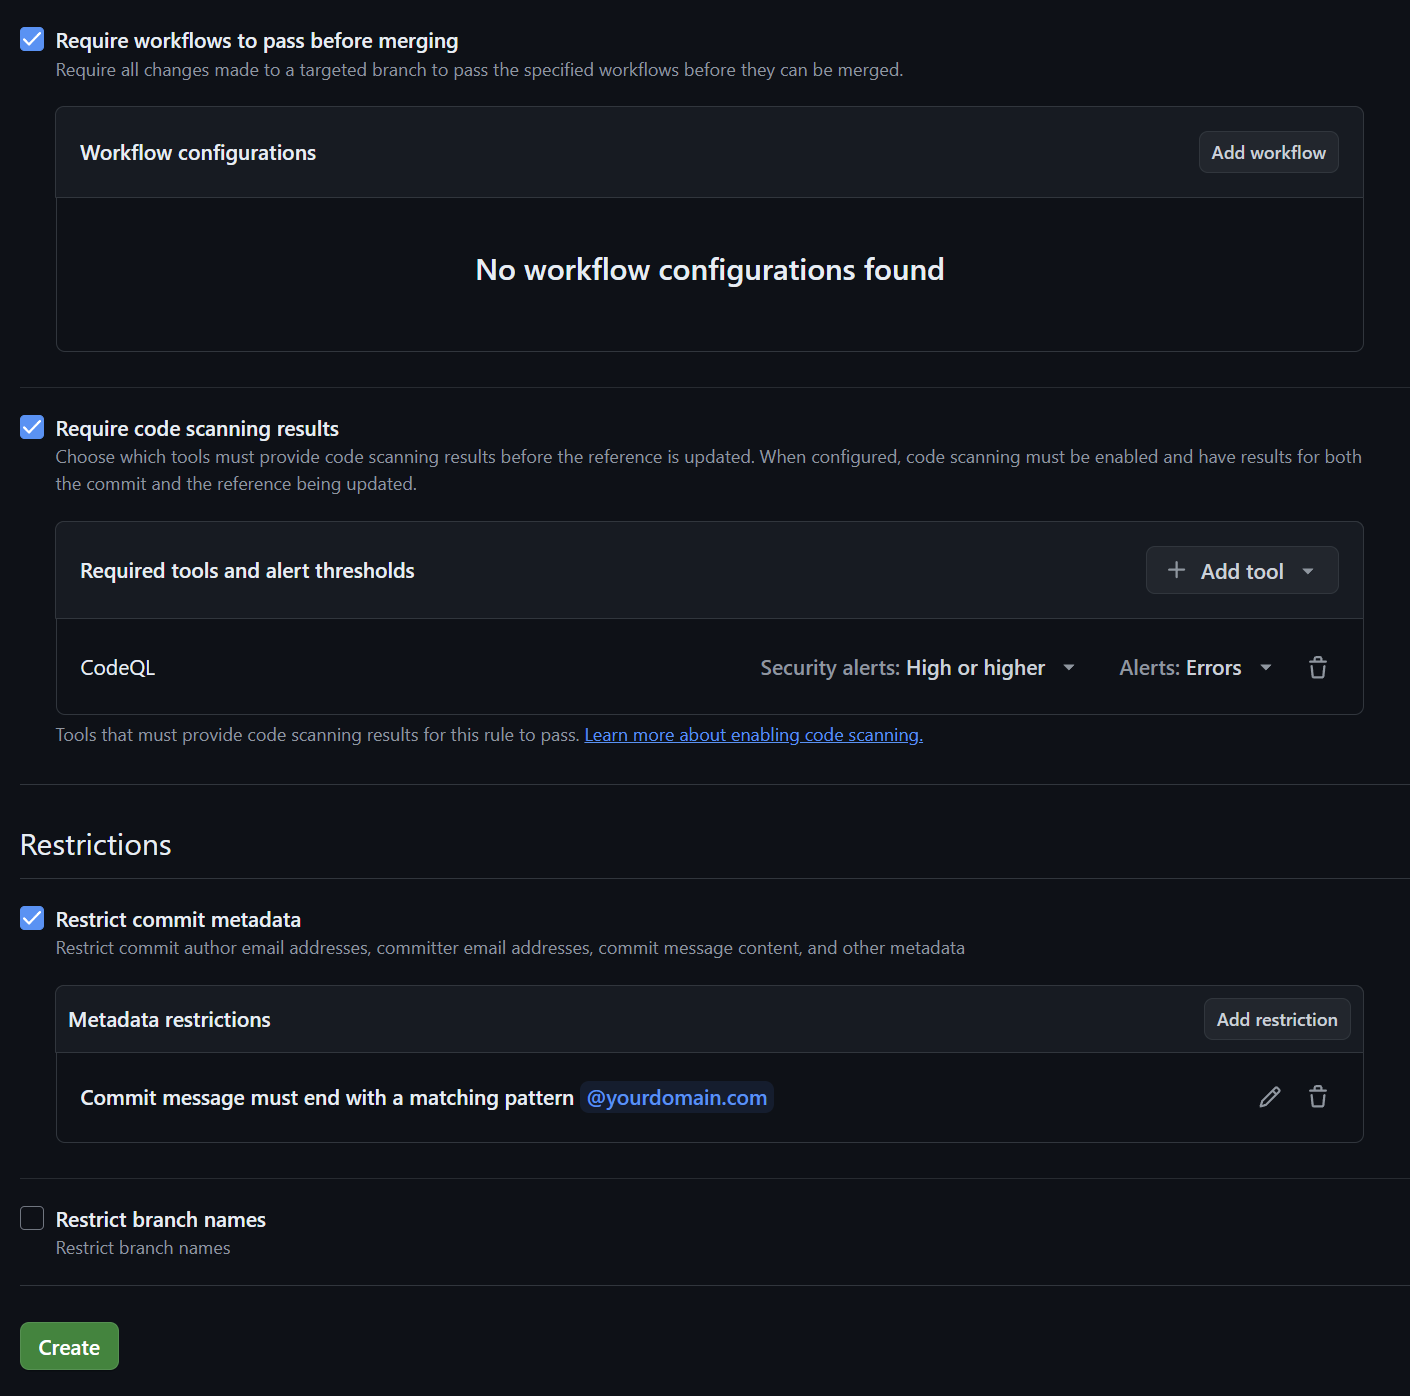
For repository roles, create a "break-glass" role used for emergencies only. Choose a role to inherit, which is write. Add permissions like "Jump to the front of the queue" under merge queue permissions, and "Request a solo merge." For repository permissions, allow bypassing branch protections. This role allows a member to elevate their permissions temporarily in emergencies. A repository administrator can assign this role, allowing them to bypass security checks once, ensuring break-glass procedures work as intended.
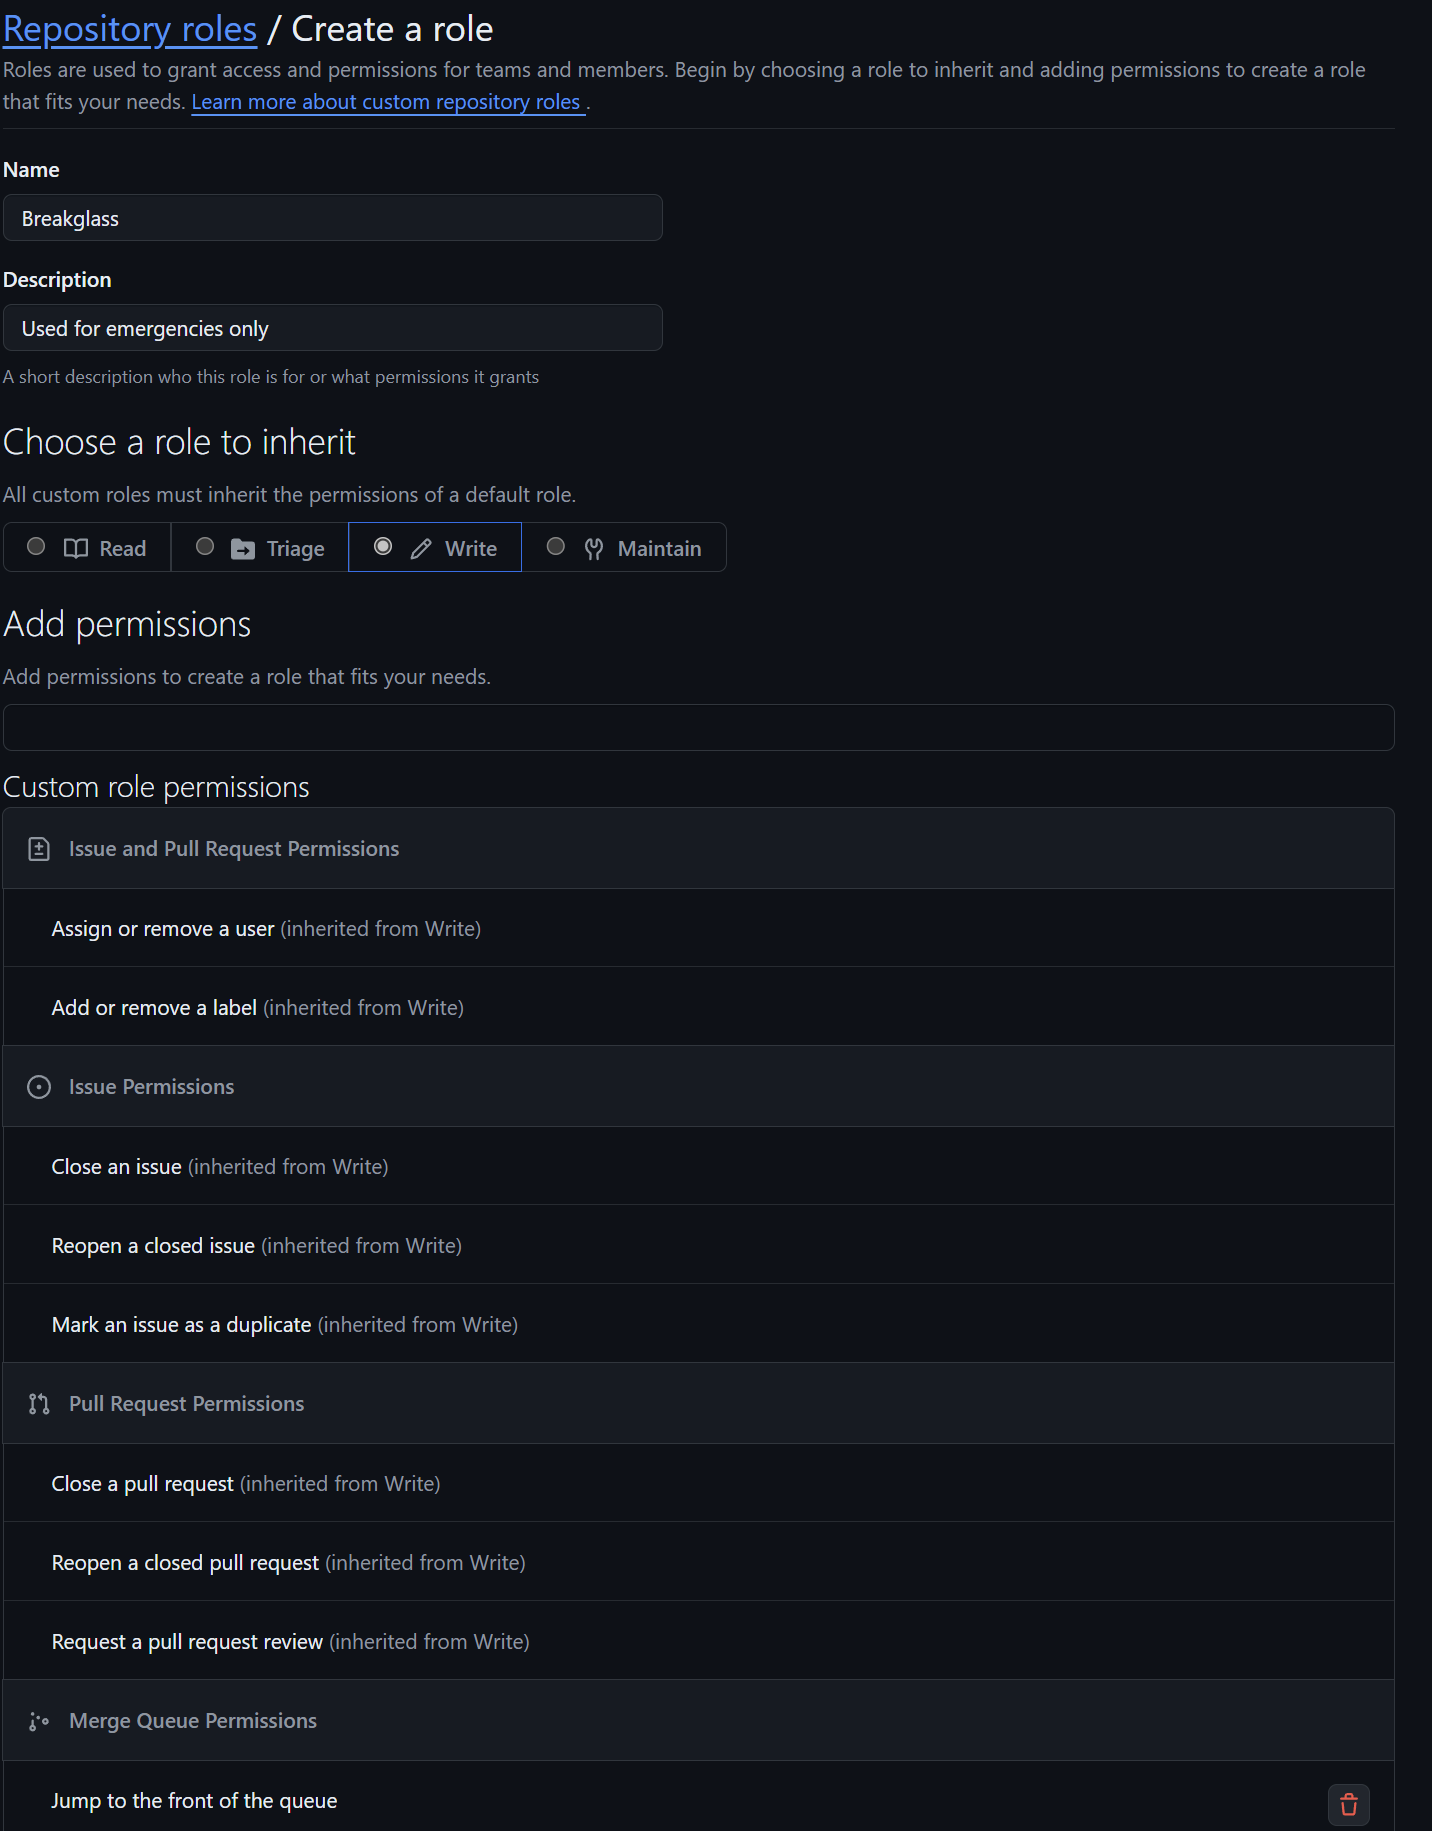
For two-factor authentication, ensure it's enabled. Check the box "Require two-factor authentication for everyone in the organization." This step greatly increases your organization's security.
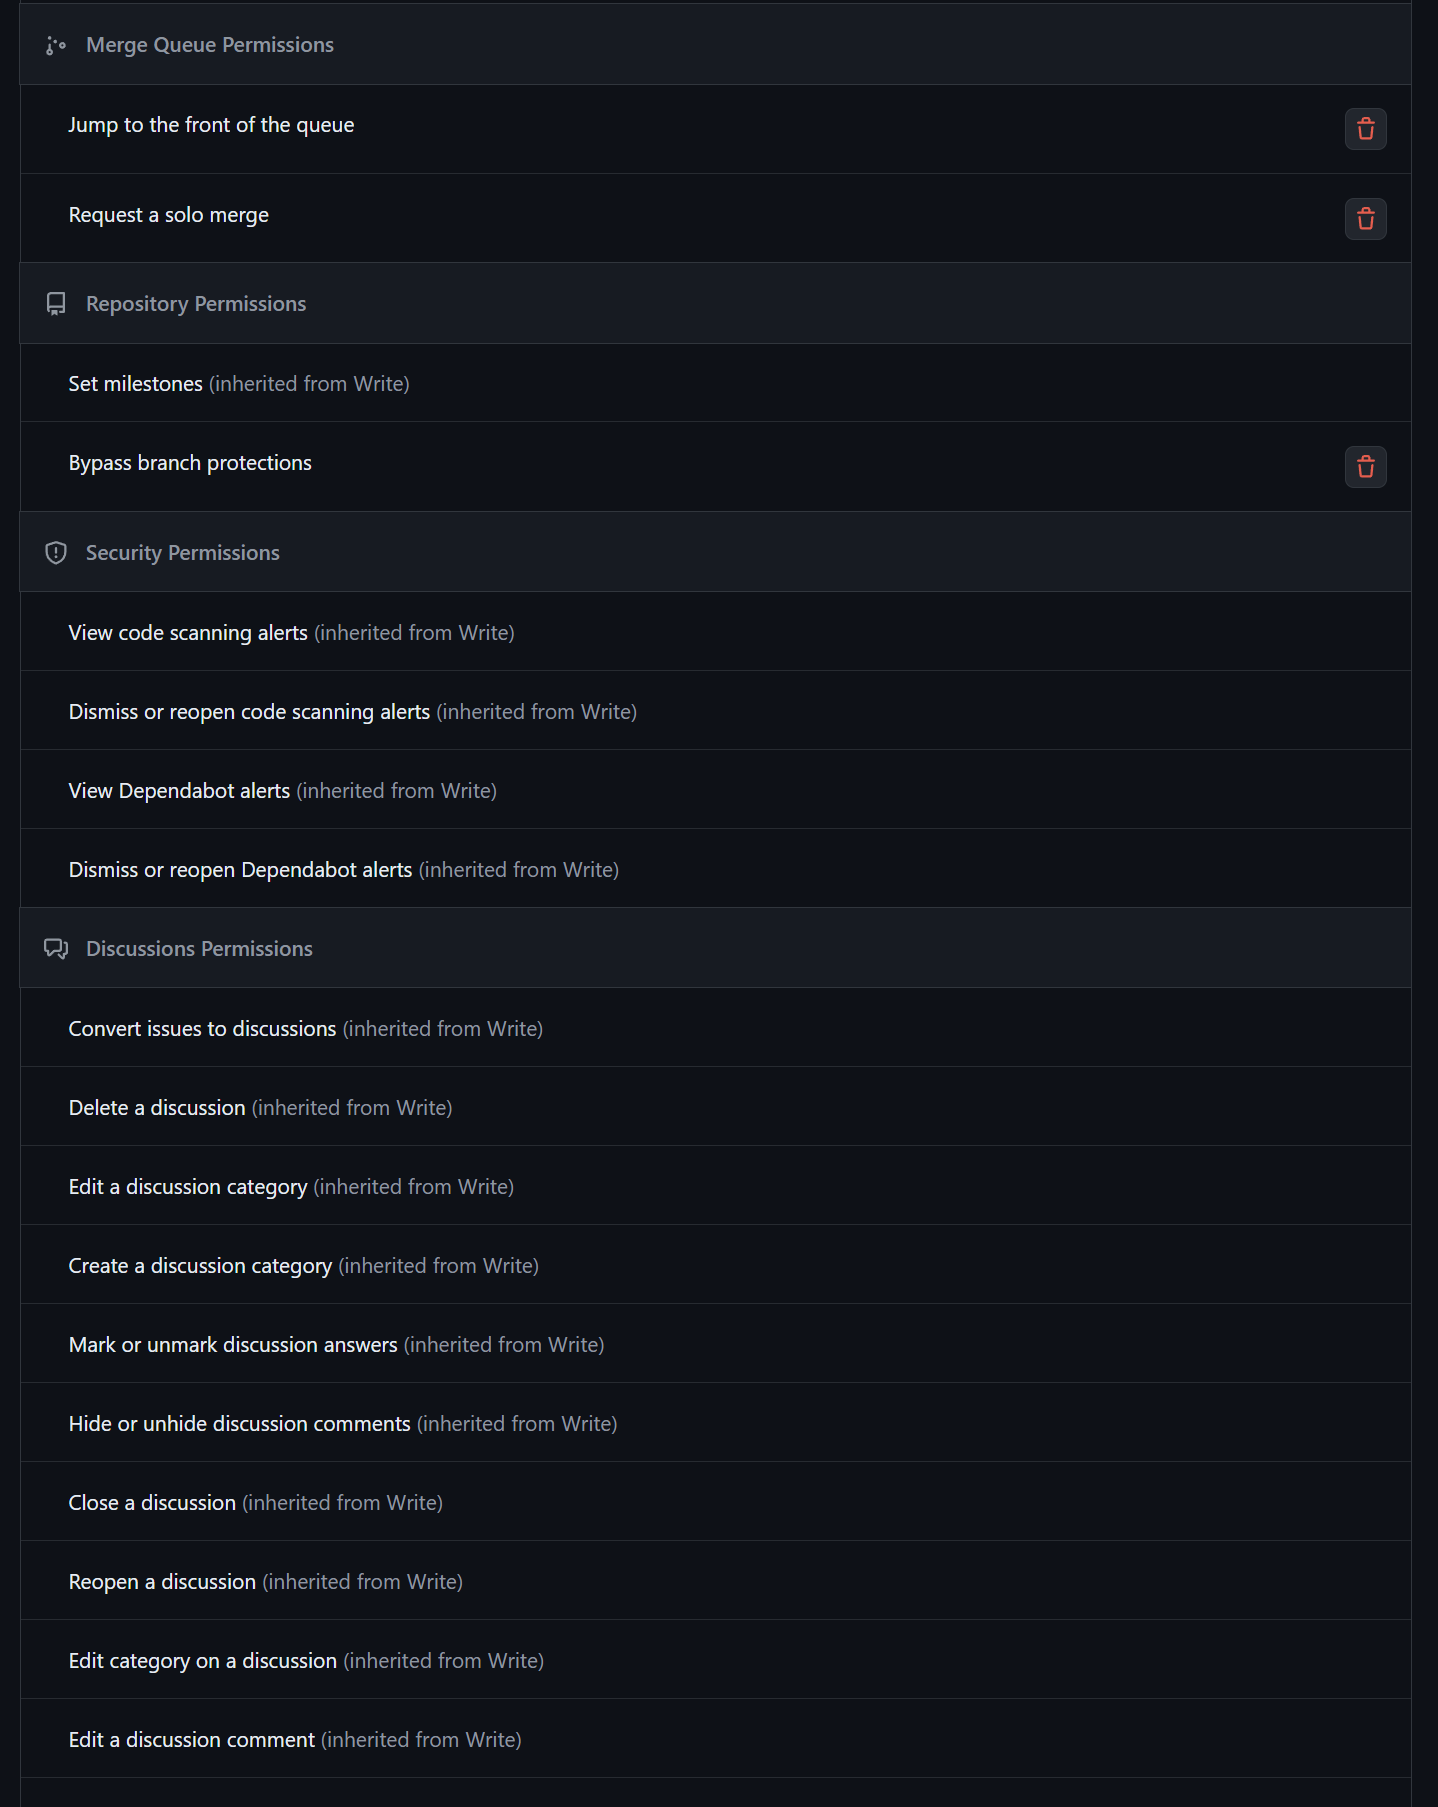
Under Global Settings for Dependabot, you might want to check "Grouped security updates," though this depends on your preference. Also, enable Dependabot on actions runners to ensure it runs properly. If you have only self-hosted runners, check Dependabot on self-hosted runners to keep it in a trusted environment.
For secret scanning push protection, check "Add a resource link in the CLI and web UI when a commit is blocked." This provides helpful context and guidance for developers when they encounter blocked commits.
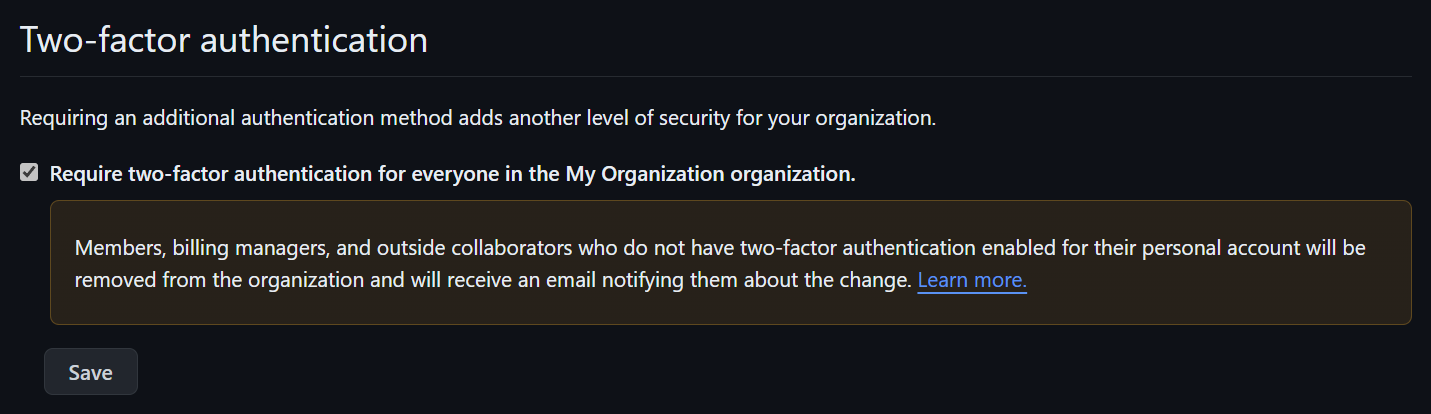
For third-party application access policy, set the policy to "Access Restricted" and allow people to create pending requests. This ensures that applications can't access your entire codebase without approval from the application administrator. This is crucial for security, as it prevents unauthorized access and ensures applications operate only with proper permissions.
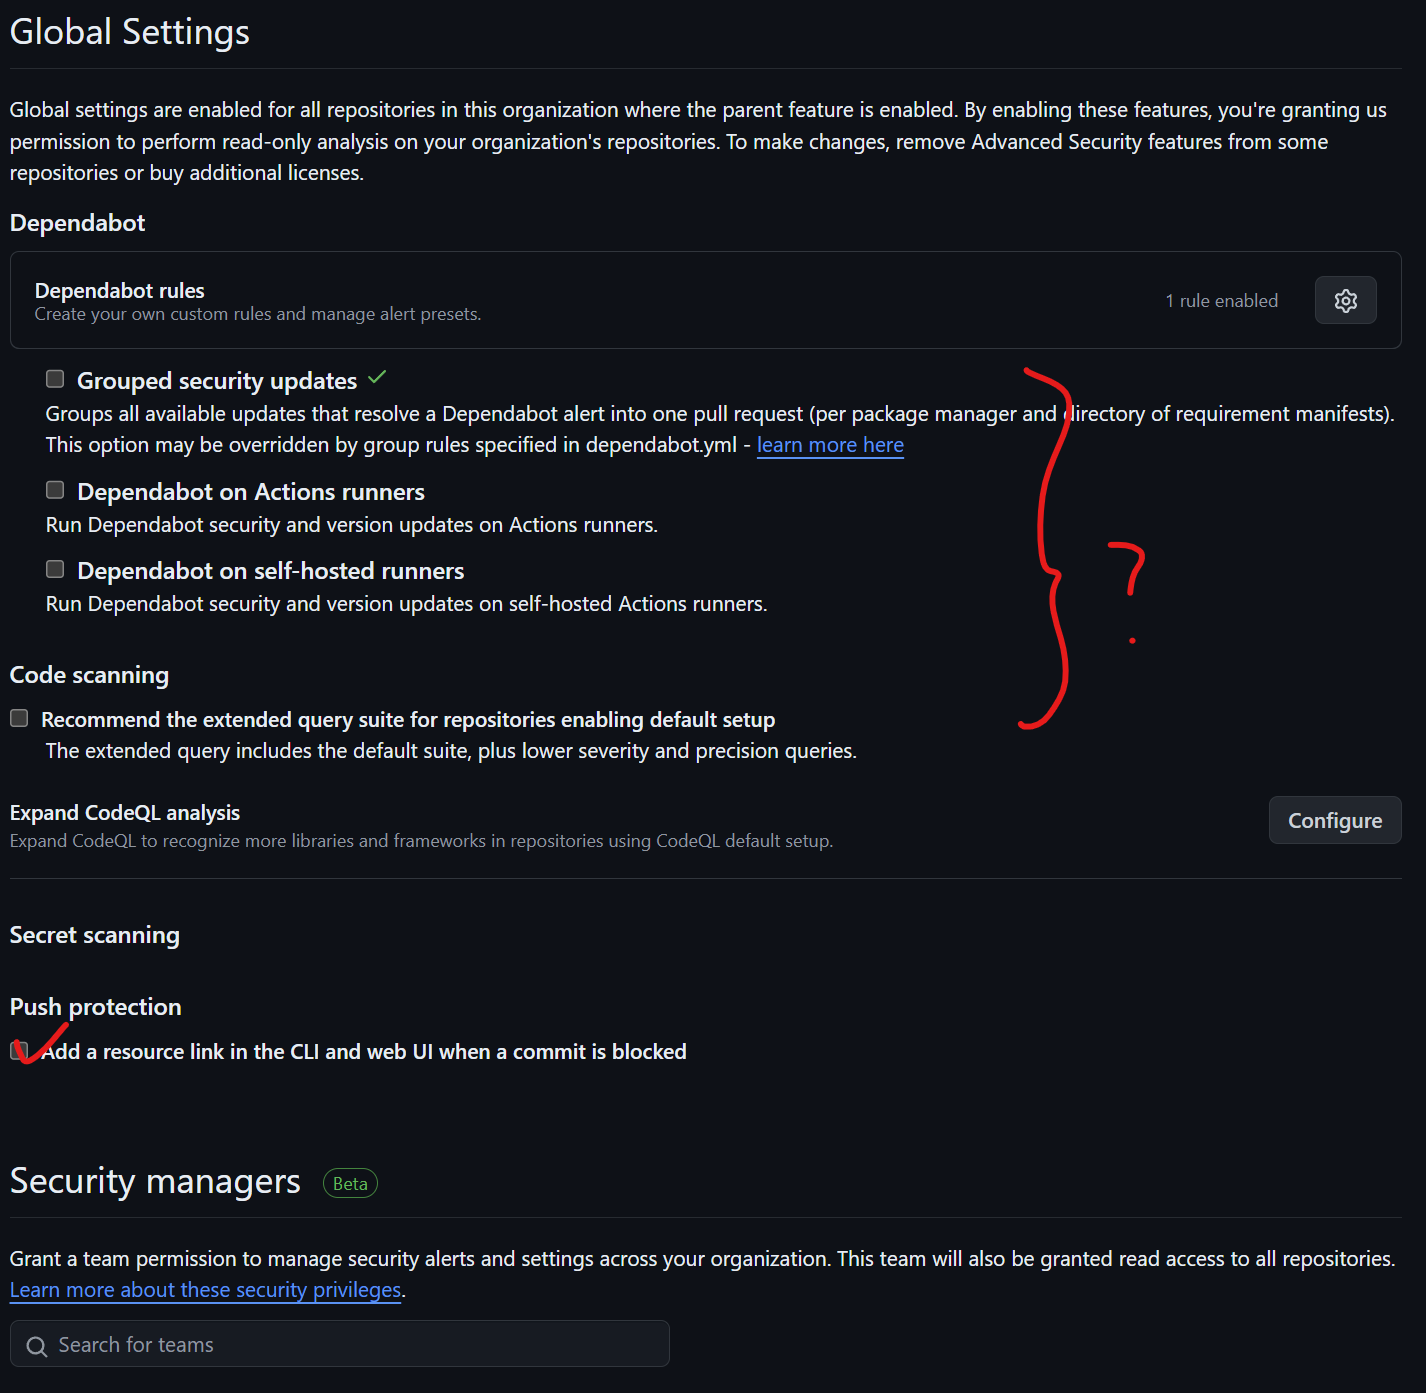
Under Personal Access Tokens, ensure the option "Allow access via fine-grained personal access tokens" is checked. This provides only the necessary permissions for users and applications to access your repositories and organization. Also, set "Do not require administrator approval" for creating tokens to avoid hassle, especially since tokens can expire quickly. Additionally, disable or restrict access via classic personal access tokens, as they lack fine-grained control and can allow excessive permissions unless needed for legacy support.
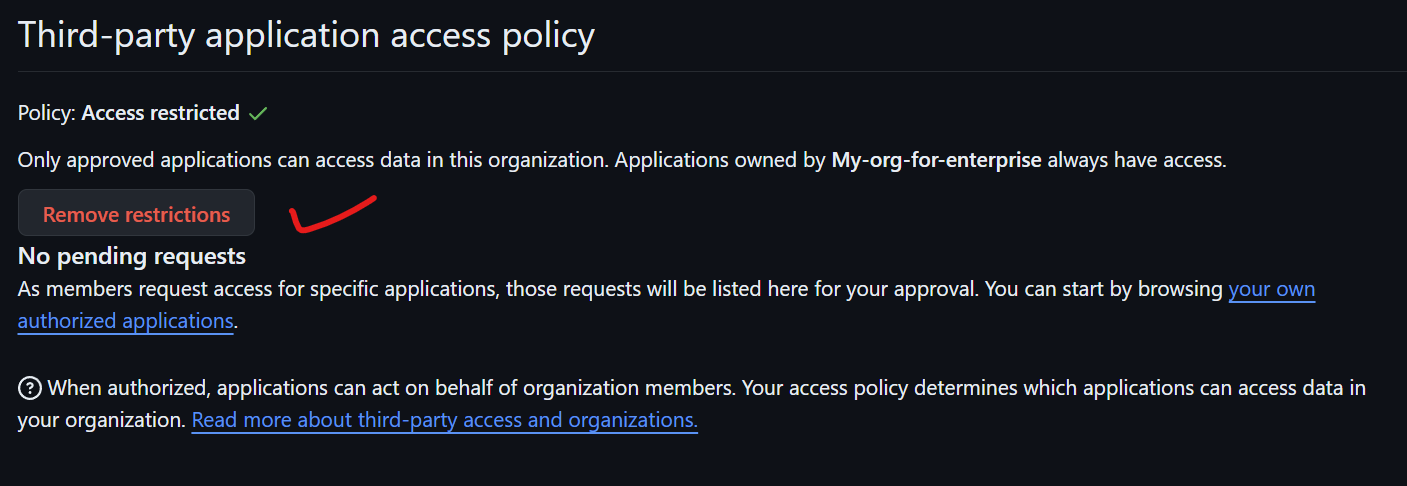
Under Scheduled Reminders, you may want to connect your Slack workspace to notify developers when pull requests are ready for review. This integrates with your workflow, making it more convenient for developers to stay on top of reviews. You might also consider integrating with a webhook or another provider like email to ensure developers receive timely notifications and keep pull requests moving smoothly.
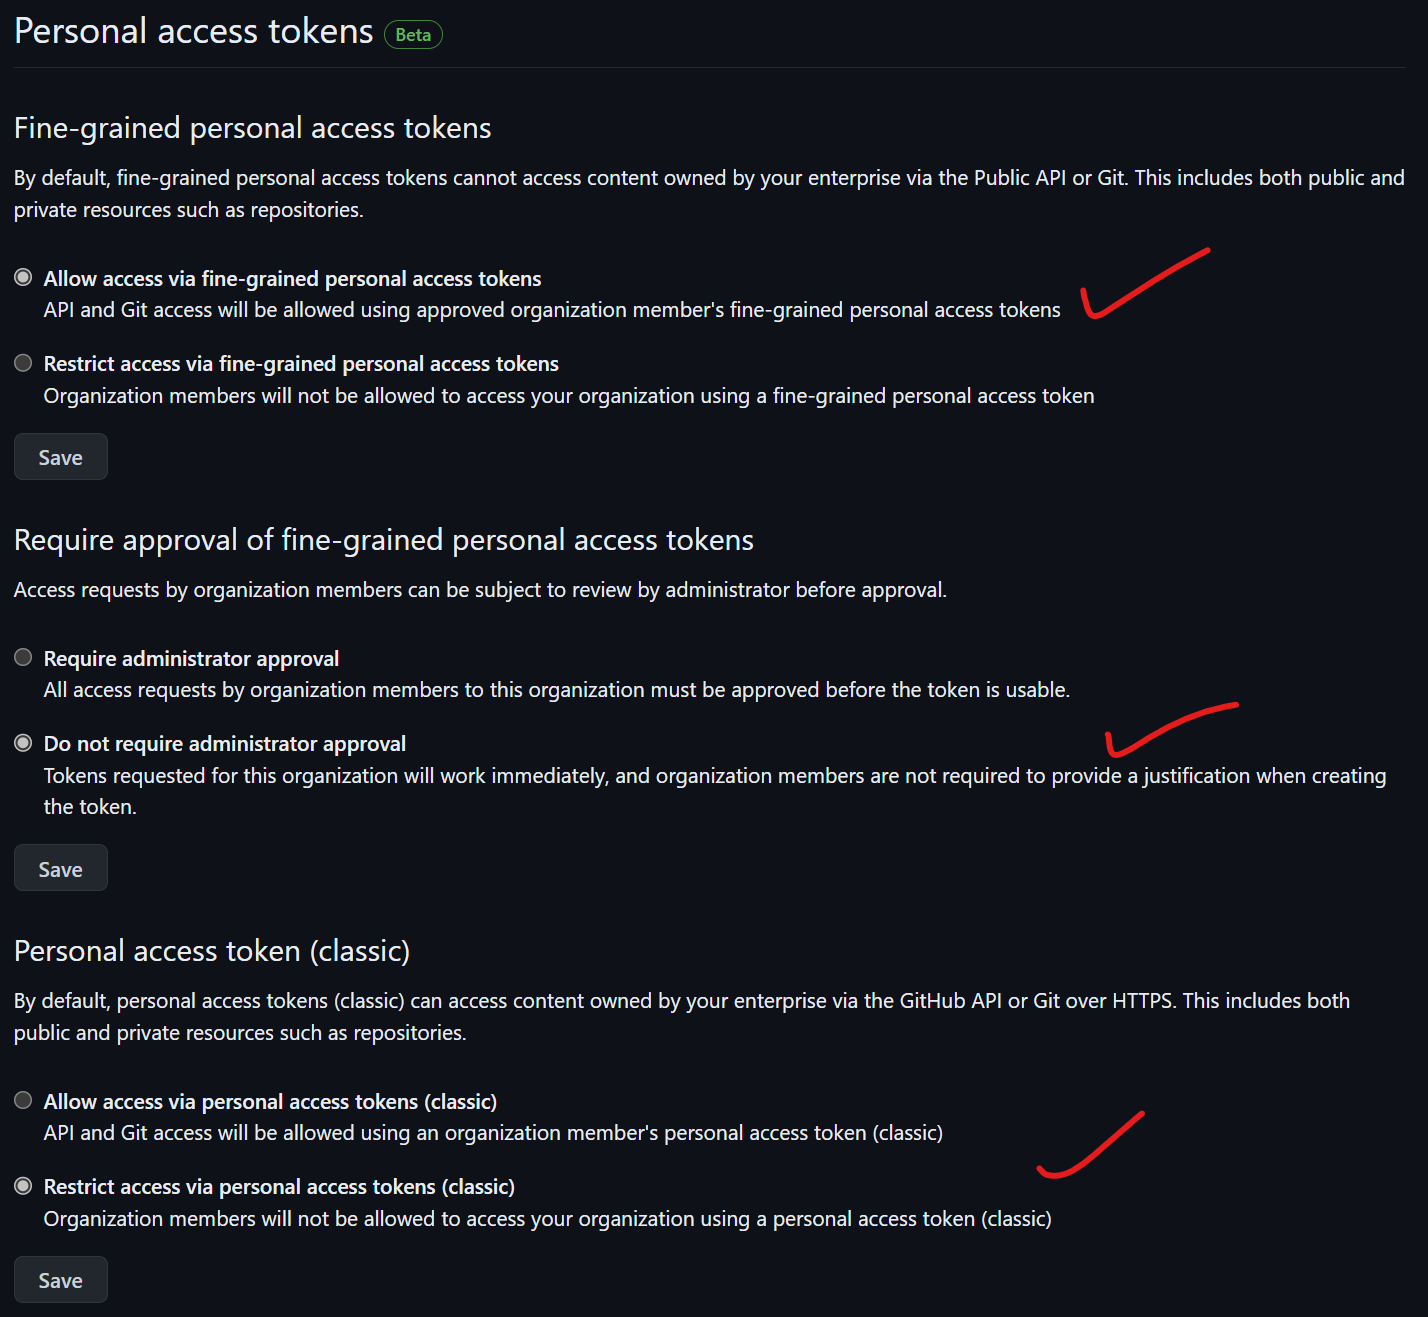
Under Repository Policies, set the base permissions to "Write" for all organization repositories. This ensures members have the lowest necessary access level, and higher permissions granted elsewhere will override it. For repository creation, set it to "Disabled" so members can't create their own repositories, enhancing security.
Disable repository forking to maintain a single source of truth and clear code control. Set outside collaborators to "Repository administrators allowed" to restrict who can invite external contributors.
Set the default branch name to "main." Restrict repository visibility changes to organization owners to prevent accidental exposure.
Disable repository deletion and transfer to maintain auditability and protect code history.
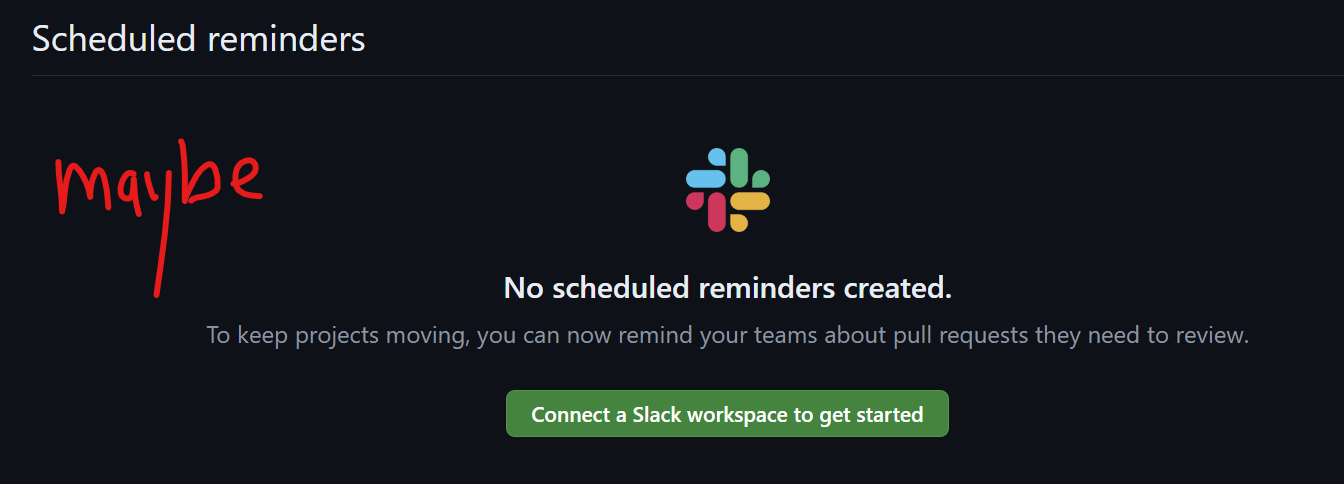
Under GitHub Codespaces, set it to "Disabled" unless you specifically want people to use it. GitHub Codespaces runs in a virtual machine outside your company's network, which can complicate auditing and security. It may also incur costs if developers leave Codespaces open for extended periods. Additionally, Codespaces might not meet your organization's data residency requirements.
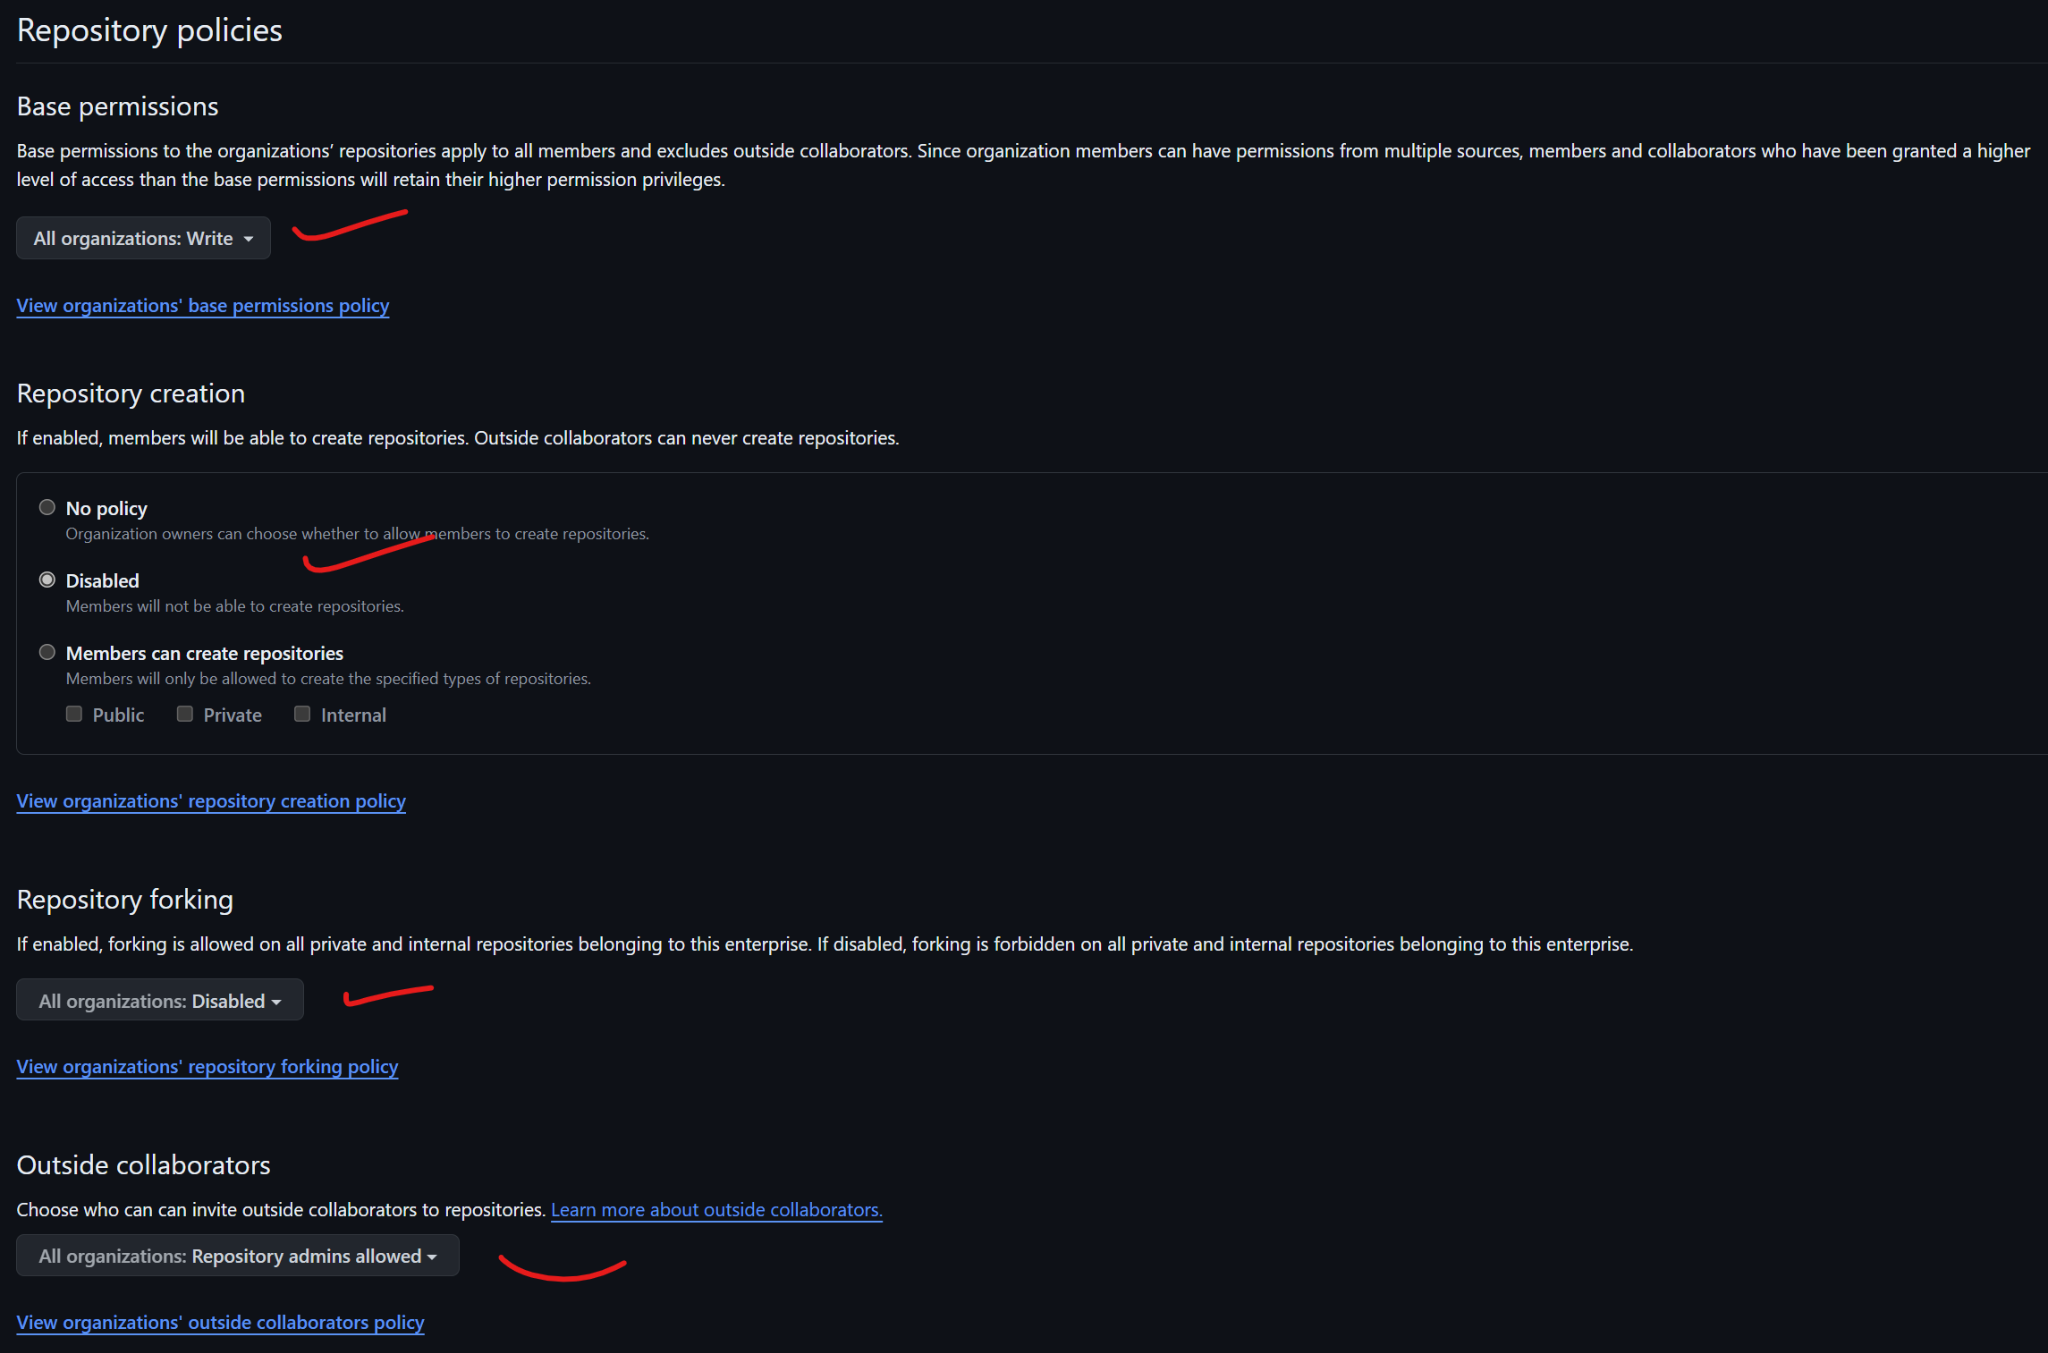
Under Runners, set it to "Disabled for all organizations" to allow organizations to self-manage their own self-hosted runners. Avoid using self-hosted runners unless absolutely required, as they can be difficult to manage and keep up-to-date. They also run in an unsecure environment and operate on your company's network. It's better to keep everything isolated within GitHub. Allow self-hosted runners only if they need to access internal services that can't be run over the internet. Otherwise, disabling them prevents users from running self-hosted runners on personal devices, which could produce untrusted build outputs.
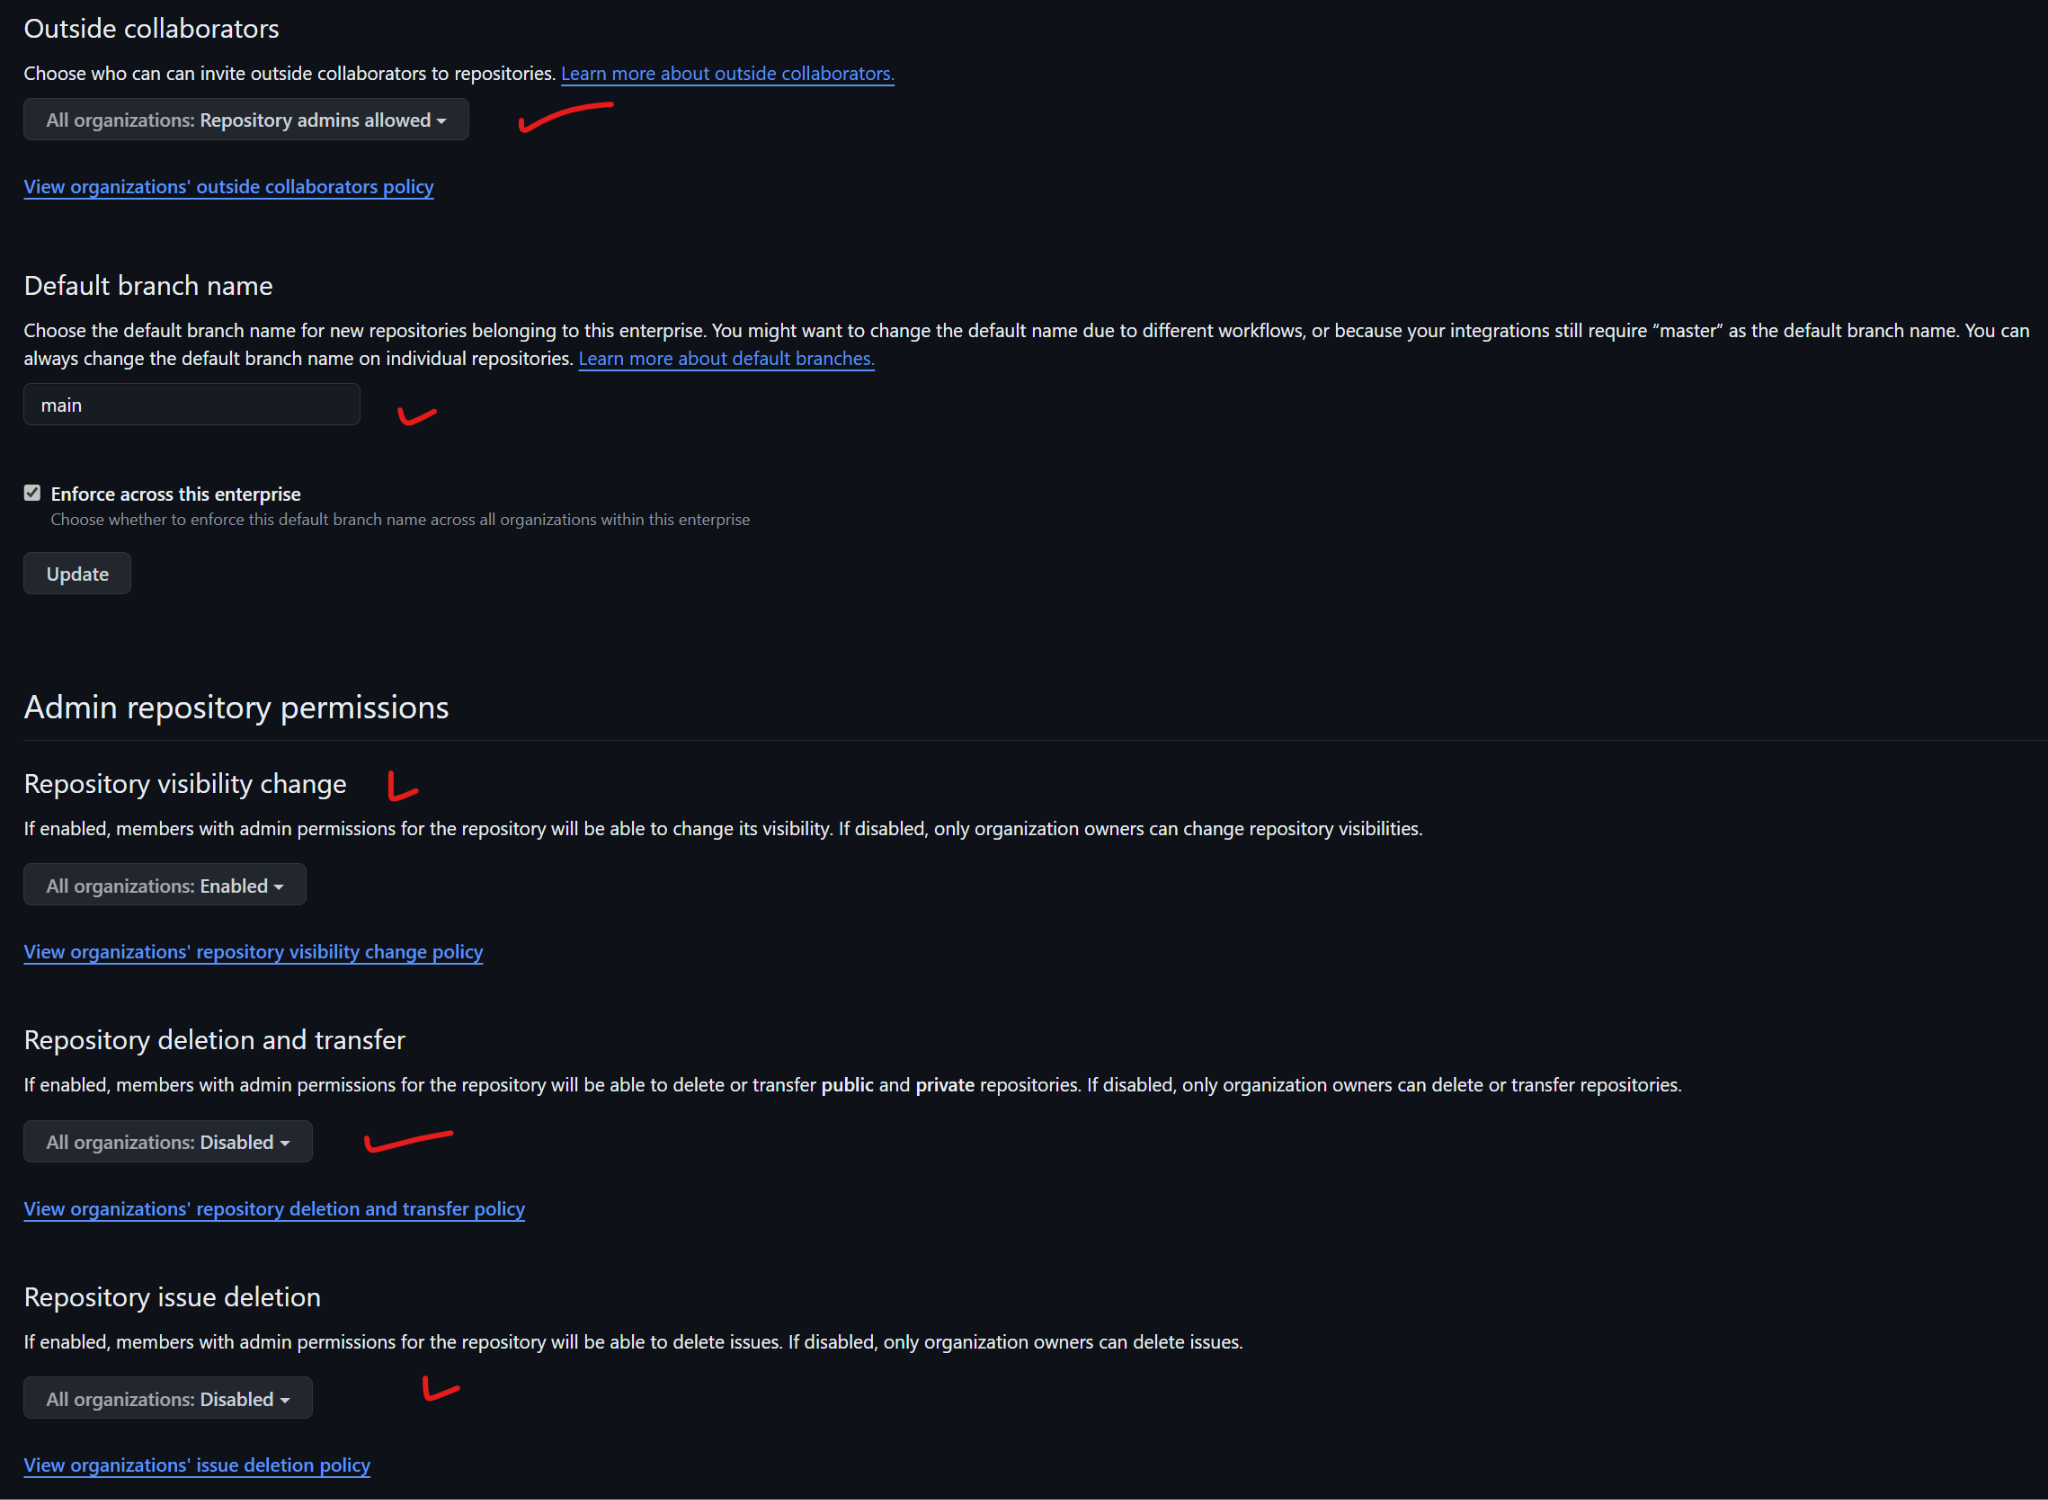
Create a new team called "Engineers" and potentially others like "QA." This avoids assigning permissions directly to each user. When a member leaves, you can remove them from the group, simplifying permission management. Assigning permissions at the team level makes auditing easier and ensures everyone in the group has the same access level.
You can also create a "Break Glass" team to temporarily elevate an engineer’s access for emergencies. Afterward, you can easily remove them, keeping access transparent and controlled.
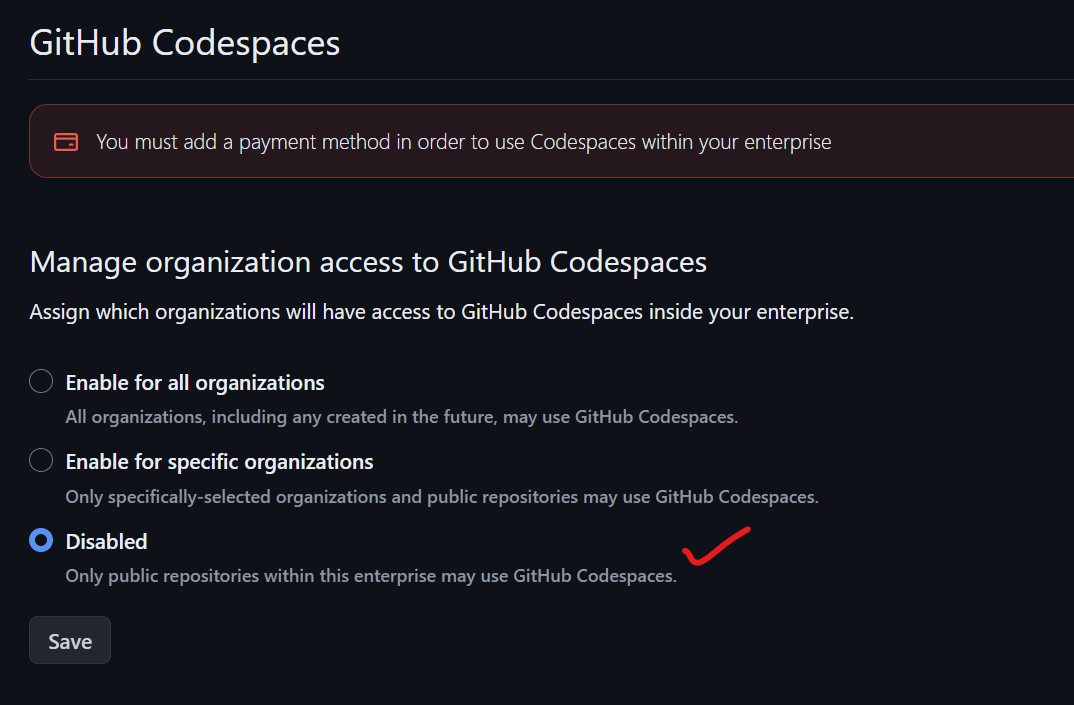
When you set up two-factor authentication for your GitHub account, it's a good idea to set up a security key like a YubiKey. You probably won't want to use it for every commit, as it can be inconvenient to touch the YubiKey every time you commit. Also, install the GitHub mobile app for two-factor authentication. It's more secure than SMS codes and serves as a backup if you lose your phone or change numbers.
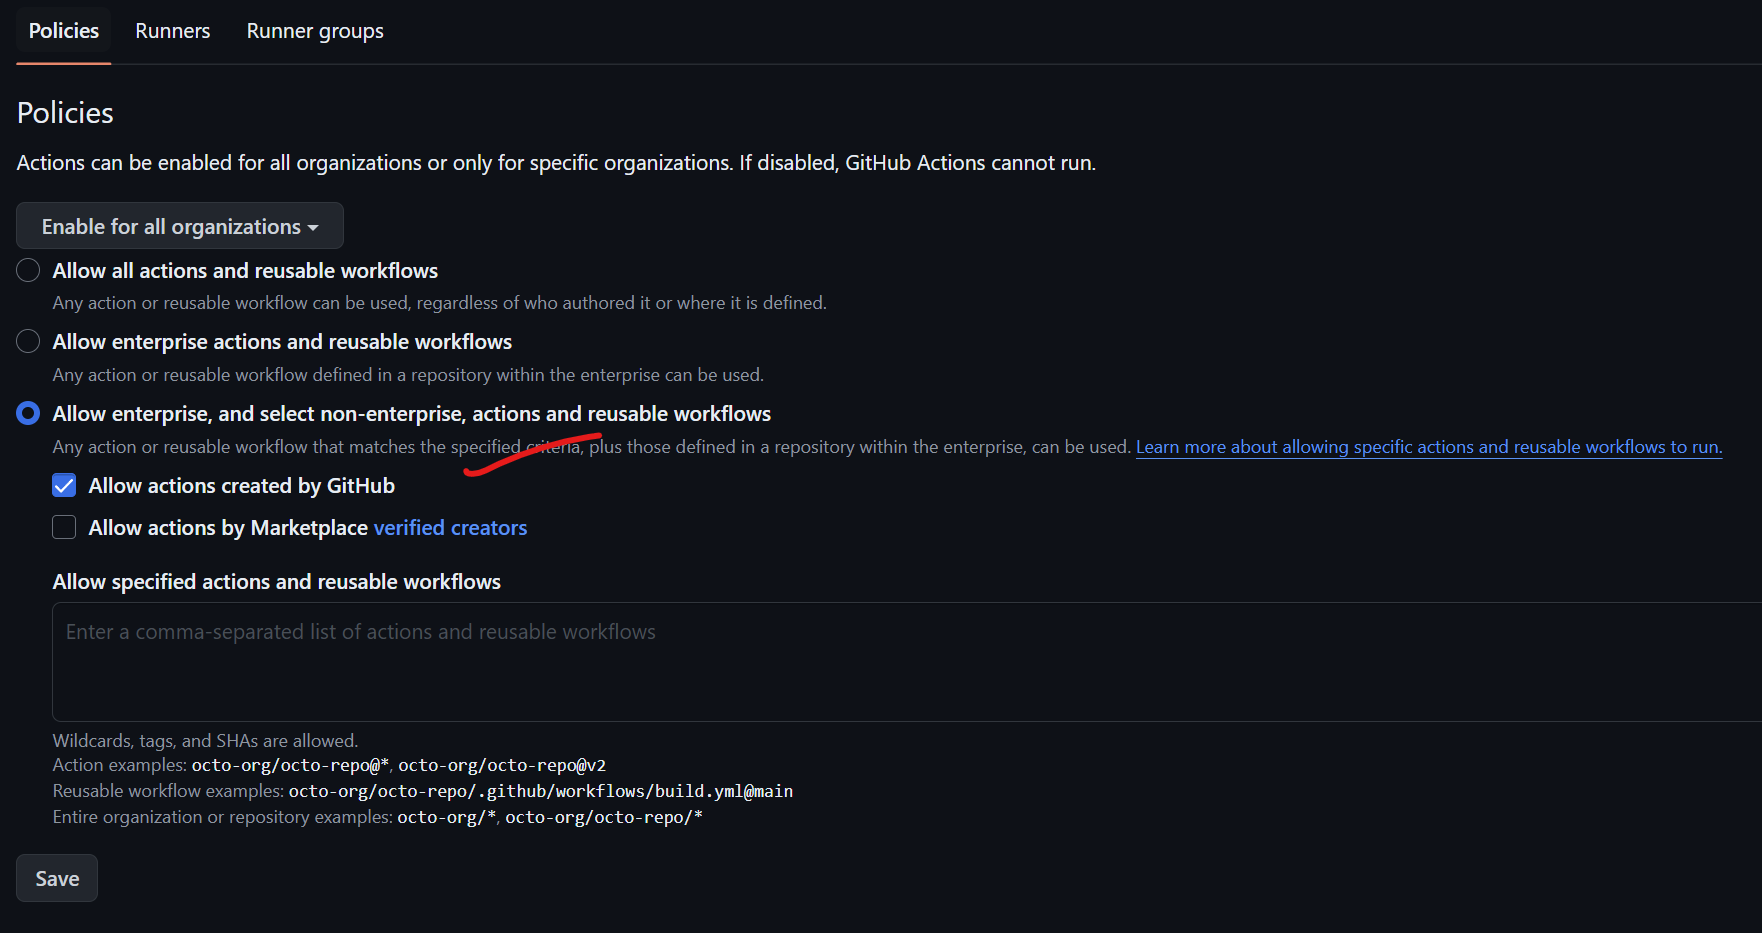
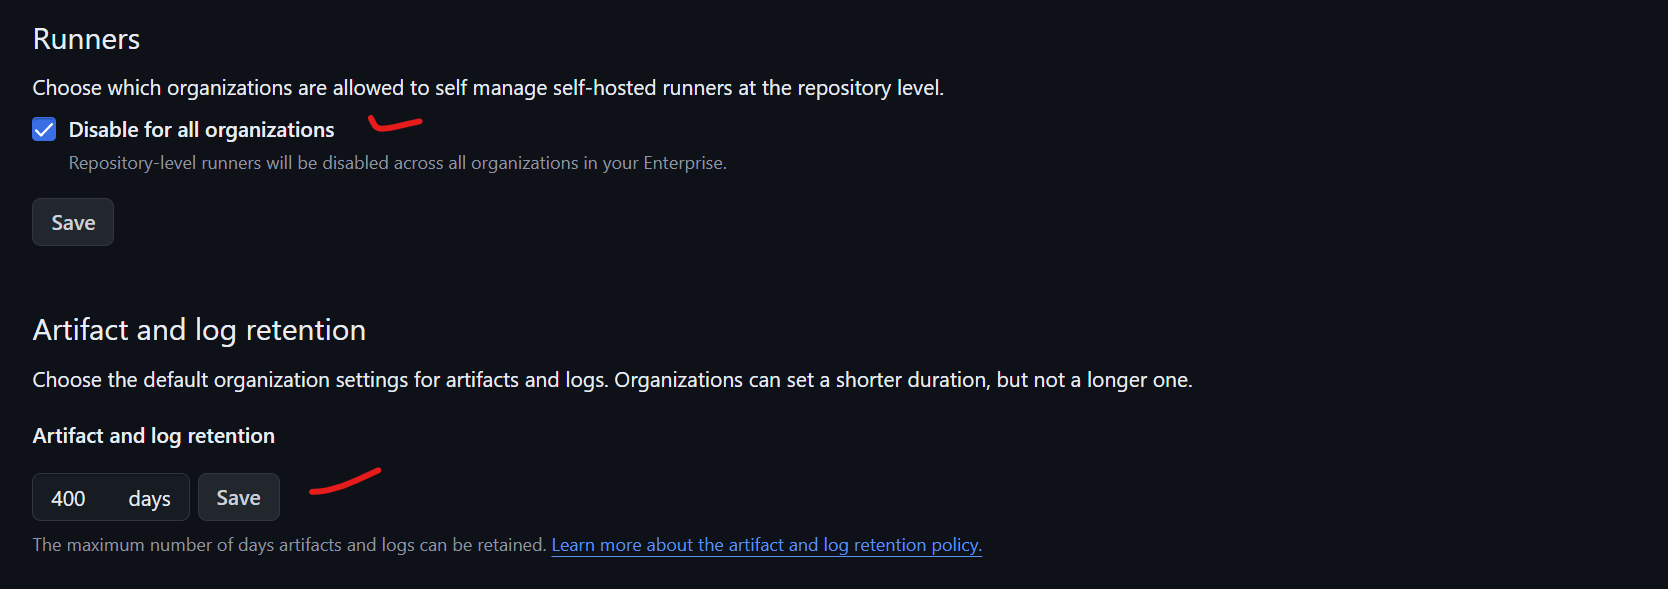
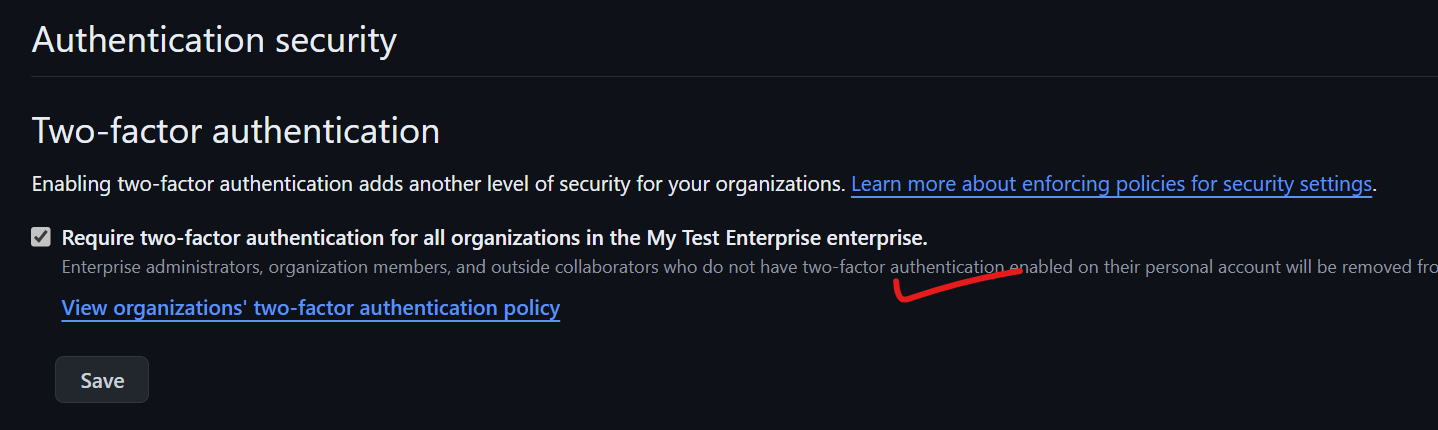
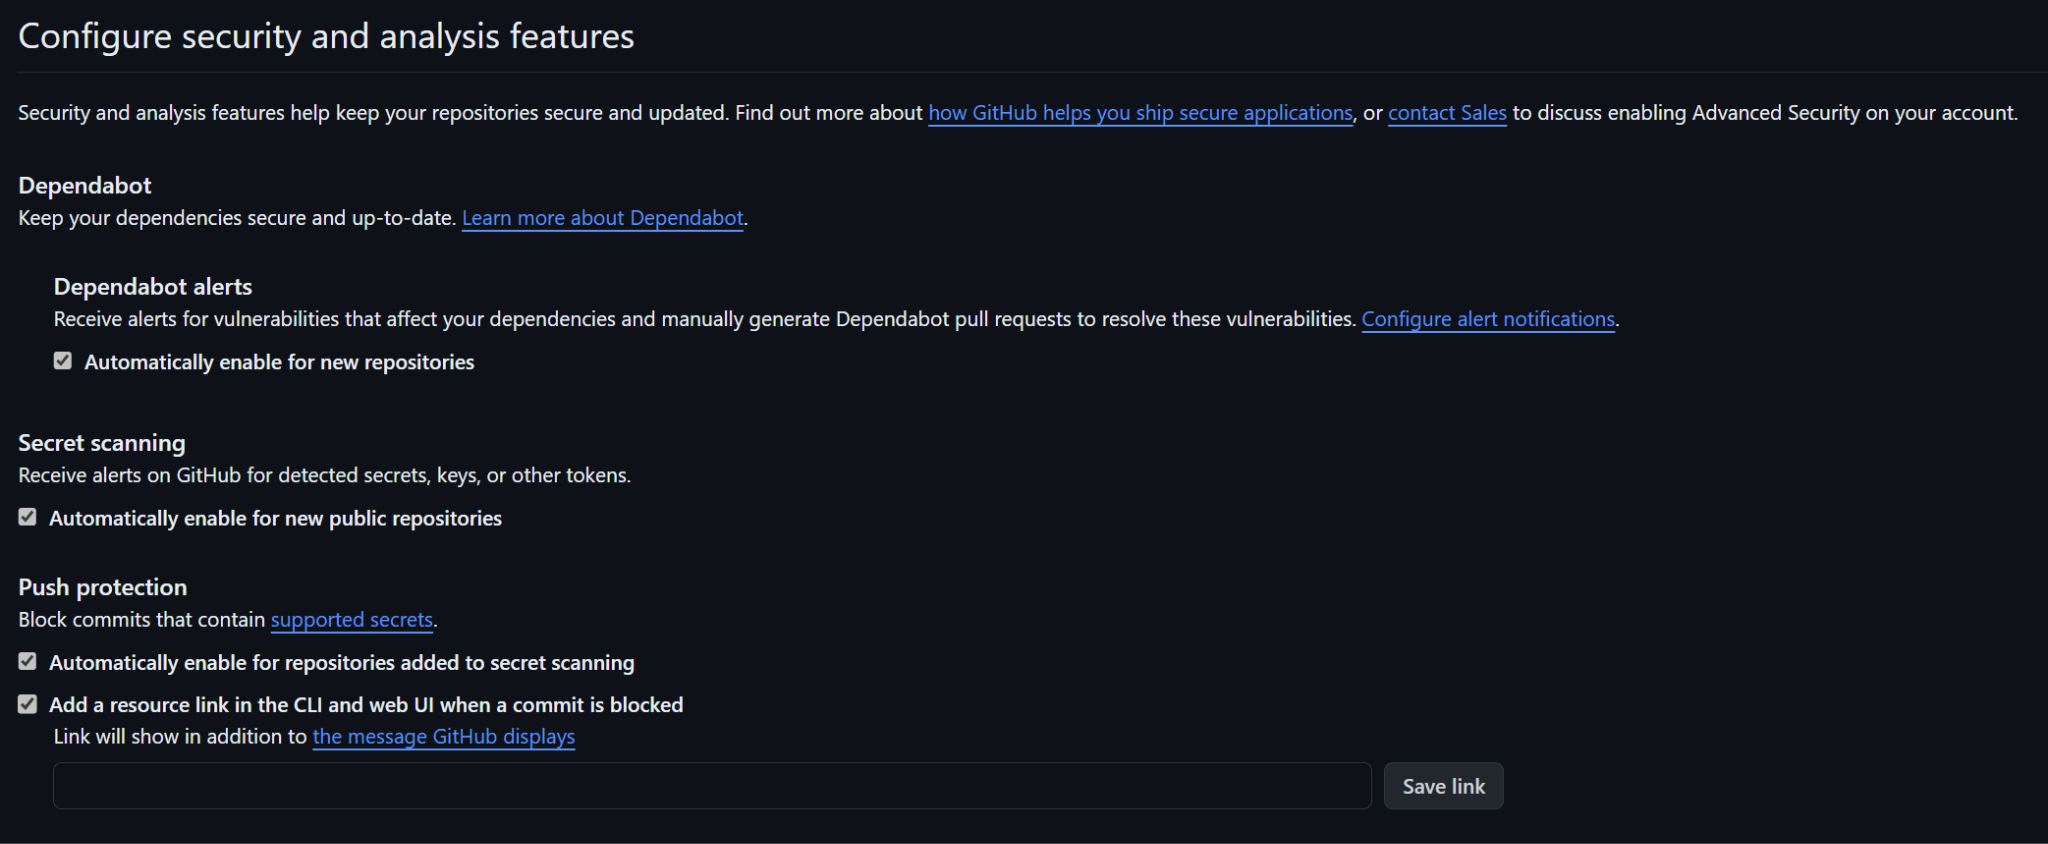
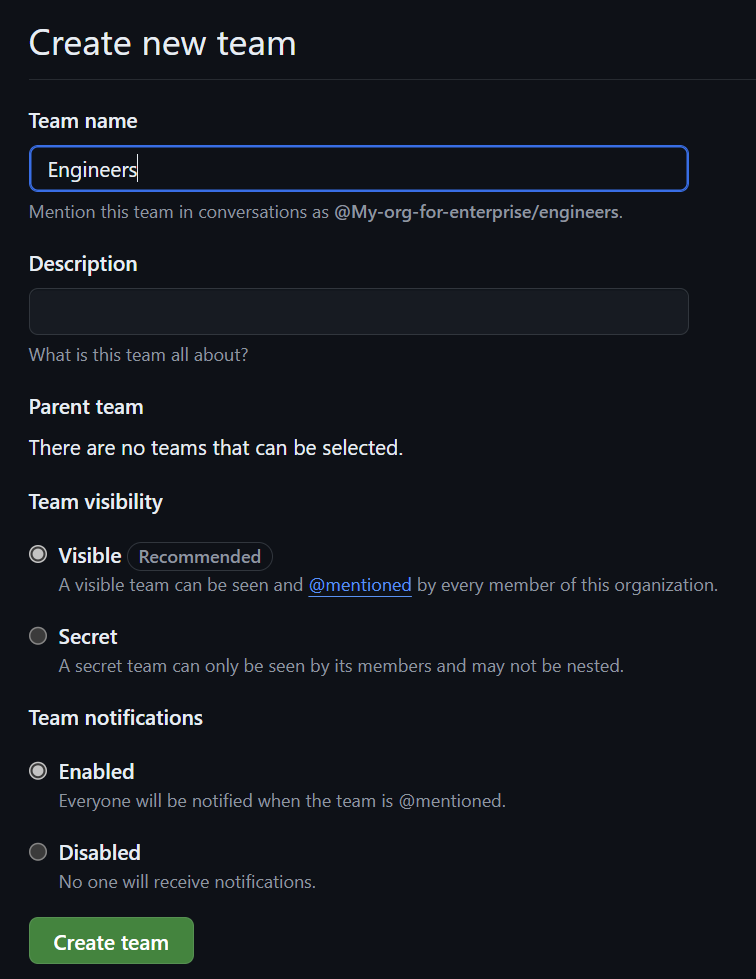
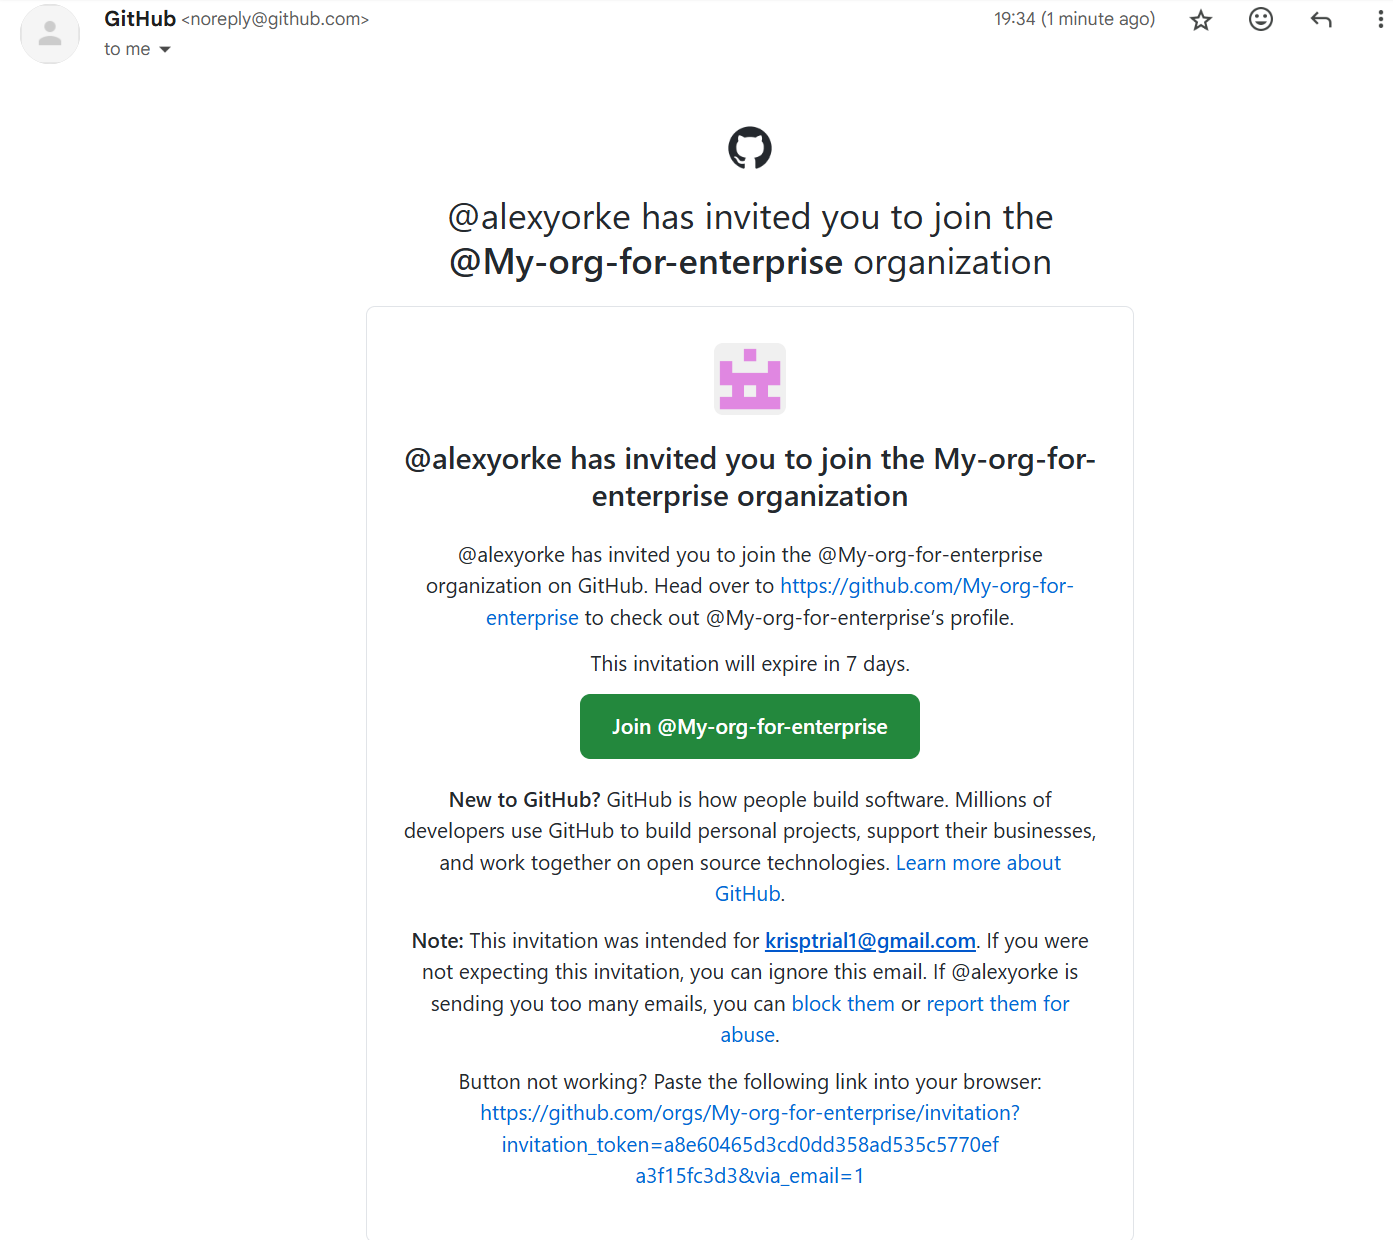
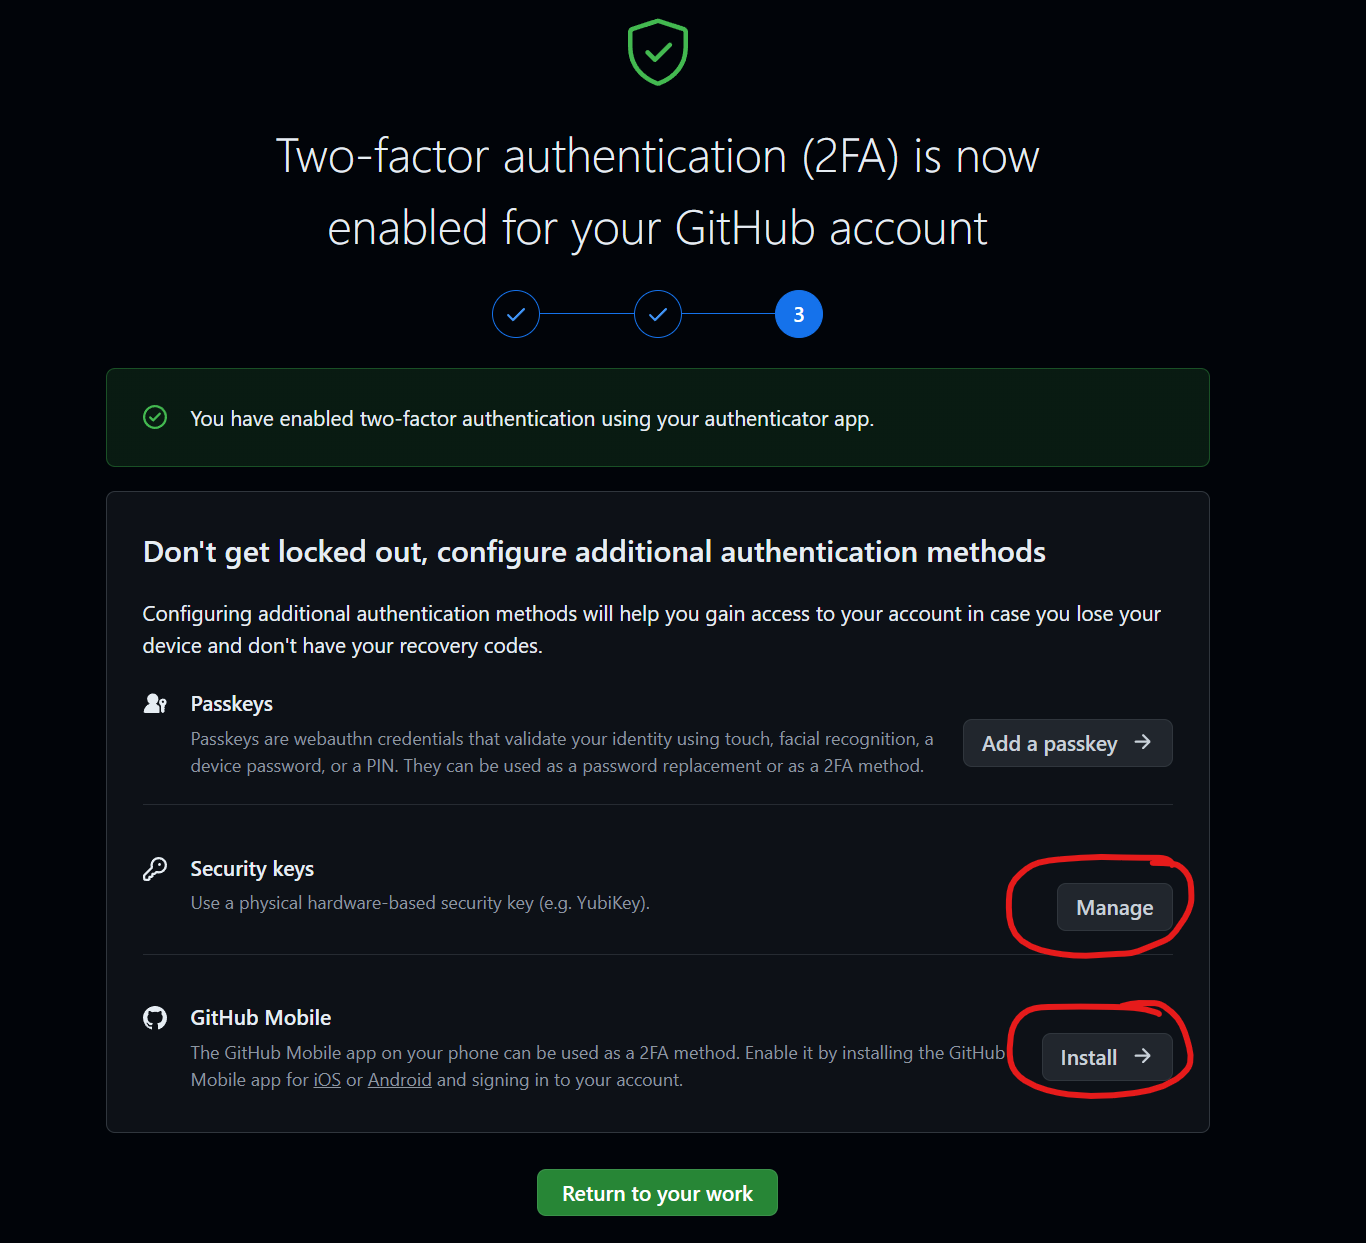
When creating a runner, typically, you would use the OS that most of your team members are using, or, the OS required to build the application
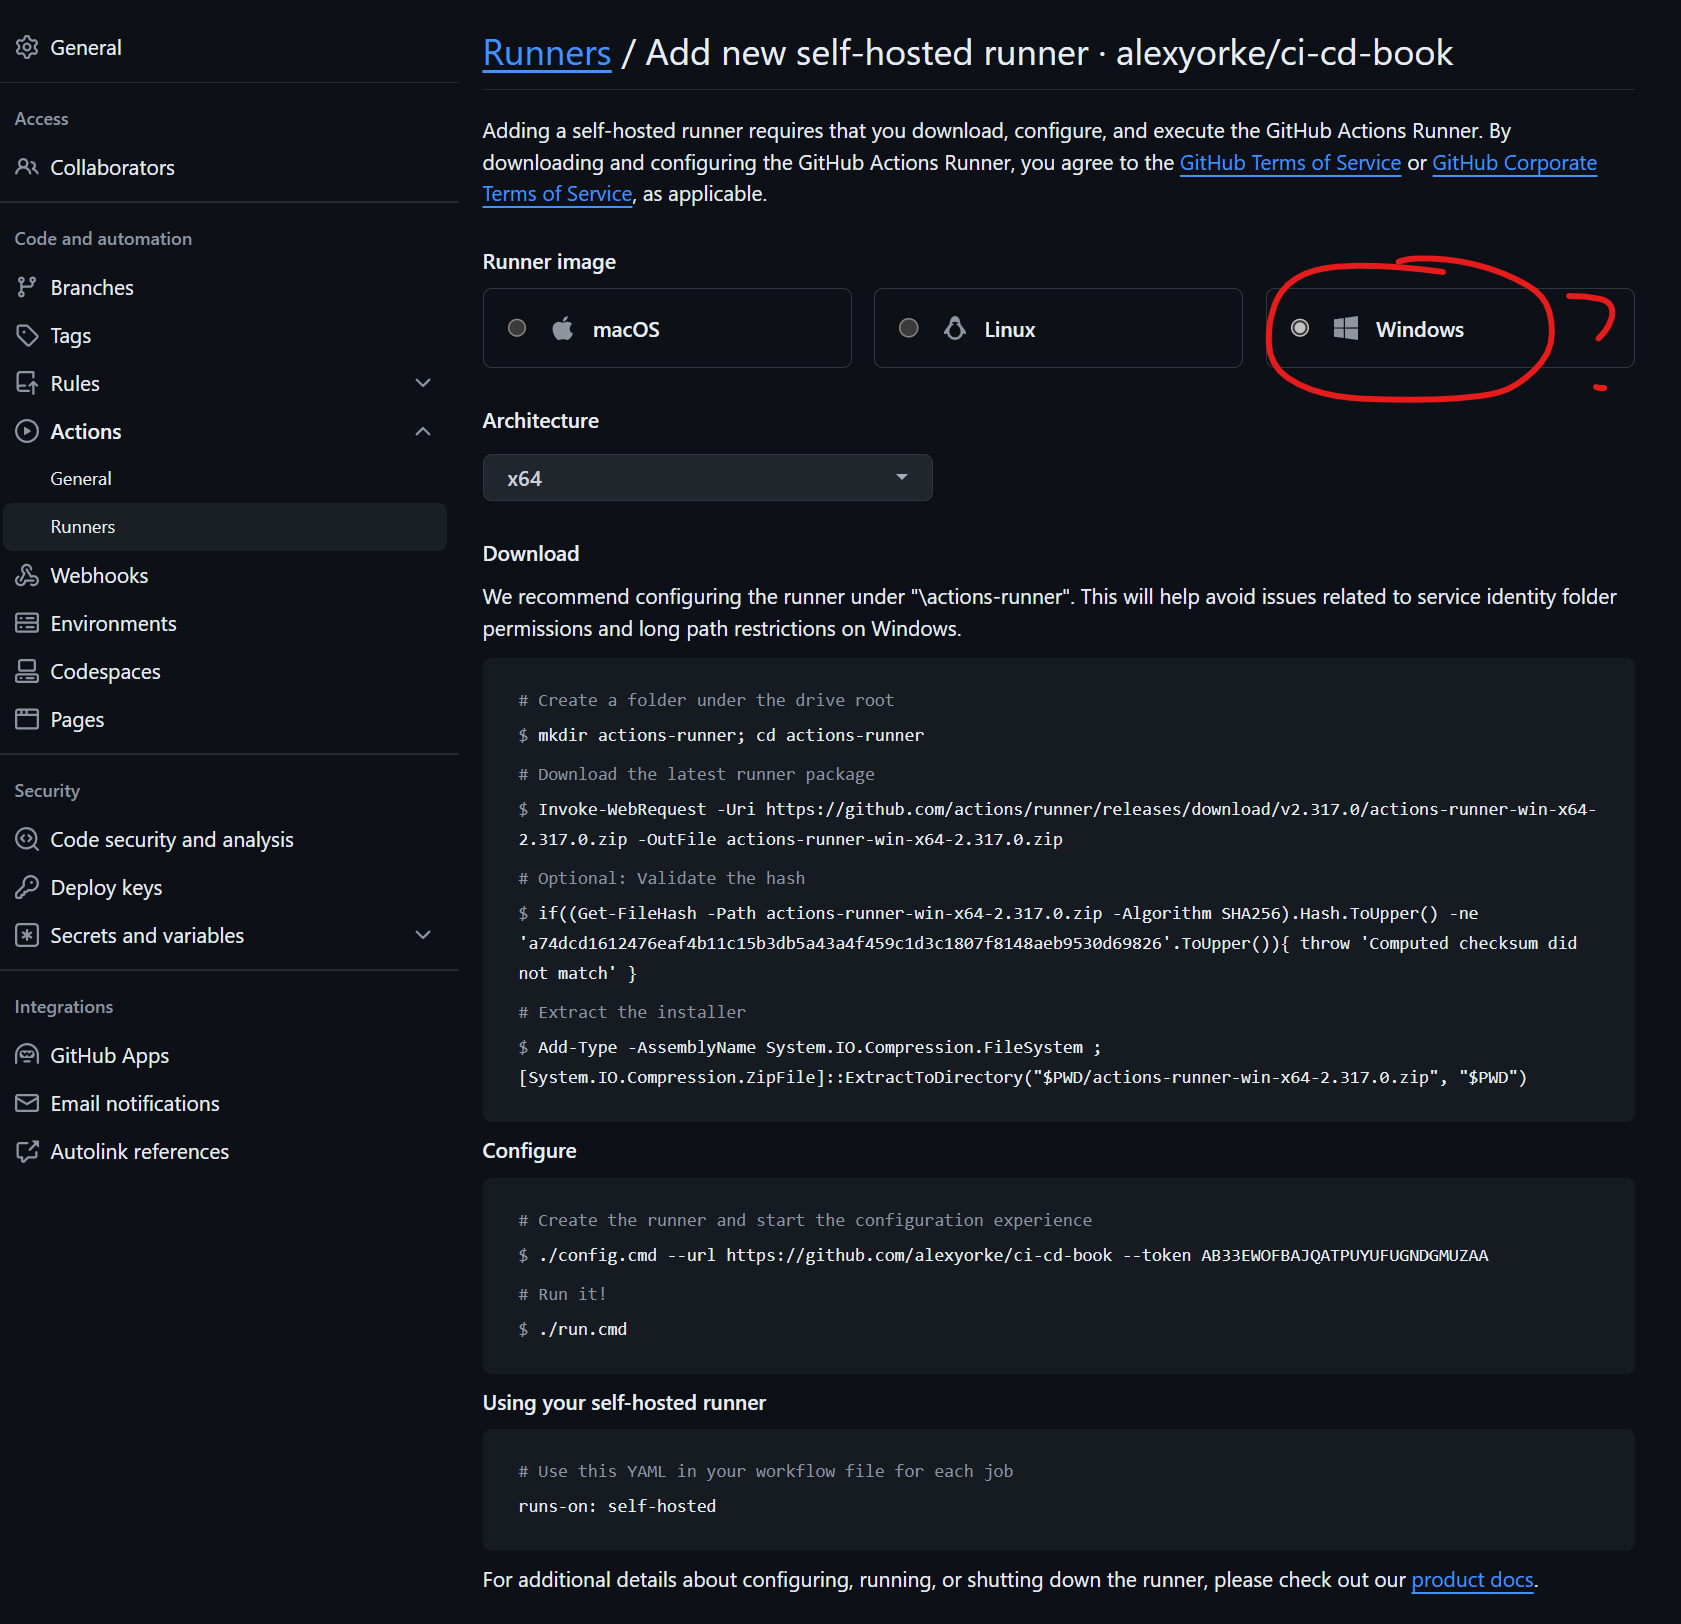
The instructions that github provides is for a stateful runner, much different from the runners cloud hosted by github. You will have to use kubernetes to re-create the nodes.
Trace Context Level 3 (w3c.github.io)
A good dev setup guide (i.,e readme) should be clear and comprehensive. It should:
1. Describe the repository's purpose and fit within the organization.
2. Provide instructions on building, navigating, and using the repository.
3. Include links to wikis for setting up build tools.
4. Ensure the repository is self-contained, with all necessary dependencies easily accessible.
5. Specify contact information for the repository's owner or relevant team.
6. Include thorough documentation and possibly revise how wikis are managed on GitHub.
-
Compromised Server: Attackers gained unauthorized access to one of Handbrake's download servers.
-
Trojanized Software: They replaced the legitimate Handbrake application with a malicious version containing a Trojan (malware designed to disguise itself as legitimate software).
-
User Downloads: Users who downloaded Handbrake from the compromised server unknowingly installed the Trojanized version on their machines.
-
Remote Access and Data Theft: The Trojan gave attackers remote access to infected computers, potentially allowing them to steal sensitive data, install additional malware, or control the system.
How it Relates to Secure Delivery Mechanisms:
The Handbrake incident highlights several failures in their delivery mechanism:
-
Inadequate Server Security: The attackers were able to exploit vulnerabilities on the download server, indicating insufficient security hardening, patching, or intrusion detection measures.
-
Lack of Code Signing: Handbrake, at the time, didn't use code signing for their software releases. This means users had no way to cryptographically verify the authenticity of the downloaded file.
-
No Integrity Checks: The absence of checksums or hashes alongside downloads meant users couldn't easily detect that the file had been tampered with.
Lessons Learned:
The Handbrake breach underscores the importance of:
-
Robust Server Security: Hardening servers, keeping software up to date, and implementing strong authentication and intrusion detection are crucial.
-
Code Signing: Digitally signing software provides users with a reliable way to confirm the software's legitimacy.
-
Integrity Verification: Providing checksums or hashes empowers users to independently check for file tampering.
-
Security Awareness: Regularly remind users to download software only from official sources and to verify its integrity.
In Conclusion:
The Handbrake compromise was a costly and damaging incident that could have been prevented with stronger security measures in their delivery mechanism. It serves as a cautionary tale for all software developers and highlights the absolute necessity of prioritizing secure software delivery.
Local Development Environment and Codespaces
Before you automate anything, ensure the project can be built and tested from the command line on a clean machine. Prefer a consistent, reproducible environment:
- Dev Containers (
.devcontainer/devcontainer.json) for VS Code - GitHub Codespaces for cloud-hosted dev environments
- Docker Compose for multi-service local stacks
Containers reduce "works on my machine" issues by standardizing dependencies and tooling, and speed up onboarding so contributors can start with fewer manual steps.
IDE Build Processes
IDEs often wrap build tools; when debugging CI failures, it's useful to identify the underlying commands (e.g., msbuild, mvn, gradle, xcodebuild). Use IDE "verbose" build output to see the real command line and build order.
- Visual Studio: increase MSBuild verbosity (Tools → Options → Projects and Solutions → Build and Run).
- IntelliJ / Eclipse: prefer using Maven/Gradle tasks and observe the terminal output.
- Xcode: inspect build logs in Report Navigator to see compilation order and commands.
Selecting Build Tools
- Favor standard, portable build tools over ad-hoc scripts.
- Avoid IDE-coupled builds and absolute paths in build logic (CI runners use different paths).
- Pin toolchain and dependency versions where practical to support reproducibility.
- Use quick heuristics to identify the project ecosystem:
package.json→ Node.jspom.xml→ Mavenbuild.gradle→ Gradlerequirements.txt/pyproject.toml→ Python
Adapting Local Commands for CI
| Language | Local development | CI environment | Why |
|---|---|---|---|
| JavaScript (Node.js) | npm install / yarn install | npm ci / yarn install --frozen-lockfile | Ensures reproducible installs by honoring lockfiles. |
| Python | pip install -r requirements.txt | pip install -r requirements.txt | Keep dependency resolution explicit and repeatable. |
| Ruby | bundle install | bundle install --deployment | Locks dependencies to Gemfile.lock. |
| Java (Maven) | mvn install | mvn -B package --file pom.xml | Batch mode for CI; focus on packaging. |
| Java (Gradle) | gradle build | gradle build | Same command; split tests into separate jobs if needed. |
| Rust | cargo build | cargo build --locked | Uses exact versions in Cargo.lock. |
| PHP (Composer) | composer install | composer install --no-interaction --prefer-dist | Non-interactive, faster installs for CI. |
Runner Software and Self-Hosted Runners
CI/CD Provider Landscape
CI/CD platforms provide the infrastructure for automated builds, tests, artifact management, deployment, and environment management. Building this from scratch is possible but rarely worth it — off-the-shelf platforms are tested, scalable, and come with rich integration ecosystems.
A brief history of how we got here:
- Pre-1960s–1970s: Early software used the Waterfall model. Source Code Management (SCMs) like SCCS (1975) and RCS emerged to manage and audit code changes.
- 1980s–1990s: "Integration Hell" was coined as a term for the pain of infrequent merges. Nightly builds became popular to surface integration issues overnight. Microsoft's daily build practice (documented by Steve McConnell) was a significant step forward.
- 2000s: Martin Fowler popularized Continuous Integration in 2000. Tools like CruiseControl, Jenkins, TeamCity, Bamboo, and GitLab CI codified the practice.
- 2010s onward: Git and distributed version control shifted development toward shorter feedback cycles. Jez Humble and David Farley's Continuous Delivery (2010) extended CI toward production-readiness. DevOps culture followed.
Choosing a provider
When evaluating CI/CD platforms, key dimensions include:
| Dimension | What to evaluate |
|---|---|
| Source control integration | Native support for Git, trigger types (push, PR, tag, schedule) |
| Build management | Parallel builds, matrix builds, manual triggers, scheduled runs |
| Security | User authentication, LDAP/SSO, secret management, audit logging |
| Notification integrations | Email, Slack, Teams, webhooks |
| Plugin/marketplace ecosystem | Available actions, plugins, or integrations |
| Installation and hosting | Cloud-hosted vs. self-hosted, cost model |
If you already deploy to a cloud provider (e.g., Azure, AWS), choosing the CI/CD system from that same vendor often simplifies authentication and deployment integration significantly.
Setting Up a Self-Hosted Runner
GitHub provides cloud-hosted runners (ubuntu-latest, windows-latest, macos-latest) that are the default choice for most workflows. Self-hosted runners are useful when you need:
- Access to on-premises resources (databases, private registries, internal services).
- Specific hardware (GPUs, custom CPUs, more RAM/disk than cloud runners offer).
- Cost control at high build volumes.
- Custom pre-installed software environments.
Registration
- Go to your repository (or organization) → Settings → Actions → Runners → New self-hosted runner.
- Select your runner OS and follow the instructions to download, configure, and register the agent.
A Windows registration session looks like this:
PS C:\actions-runner> ./config.cmd --url https://github.com/your-org/your-repo --token TOKEN_HERE

# Authentication
√ Connected to GitHub

# Runner Registration
Enter the name of the runner group to add this runner to: [press Enter for Default]
Enter the name of runner: [press Enter for my-runner]
This runner will have the following labels: 'self-hosted', 'Windows', 'X64'
Enter any additional labels (ex. label-1,label-2): [press Enter to skip]
√ Runner successfully added
√ Runner connection is good

# Runner settings
Enter name of work folder: [press Enter for _work]
√ Settings Saved.

Would you like to run the runner as service? (Y/N) [press Enter for N]

PS C:\actions-runner> ./run.cmd
√ Connected to GitHub
Current runner version: '2.316.0'
2024-05-06 05:19:09Z: Listening for Jobs
2024-05-06 05:20:12Z: Running job: build
2024-05-06 05:20:30Z: Job build completed with result: Succeeded
Using the runner in a workflow
Reference the runner by its label in runs-on:
jobs:
  build:
    runs-on: self-hosted   # or a custom label you assigned during registration
Important: Do not use personal or shared developer machines as permanent self-hosted runners in production. There is minimal isolation between jobs — the runner executes directly on the host, has access to all installed software, and retains state between runs unless you actively clean it up. Use a dedicated VM or container-based runner instead.
Inside a Runner: What Happens During a Job
Understanding what the runner does internally is valuable for debugging. Here is what the self-hosted agent does from the moment a job is assigned:
1. Listener and worker startup
The Runner.Listener process reads credentials and configuration, then launches Runner.Worker.exe to handle the actual job. The worker loads .NET Core runtime libraries (hostfxr.dll, coreclr.dll) and reads Runner.Worker.deps.json and Runner.Worker.runtimeconfig.json to understand the environment.
On Windows, Windows Defender (MsMpEng.exe) scans each DLL as it loads — this accounts for some of the startup latency you see in runner logs.
2. Job preparation
The worker reads .runner and .setup_info for runner capabilities, creates working directories under _work/, and manages pipeline mappings to isolate each job's workspace. Then it downloads the required actions (e.g., actions/checkout@v4 as a zip) and extracts them into _work/_actions/.
3. Action execution (example: checkout)
When actions/checkout runs, the worker:
- Creates directories and files for the repository clone.
- Sets file attributes (read-only, hidden) as needed.
- Writes content to
action.yml,README.md, and configuration files. - Launches
node.exe(the Node.js runtime) to execute the action's JavaScript. - The Node.js process reads
event.json(created by the worker in_work/_temp/_github_workflow/) to get event context, then performs git fetch/checkout operations.
4. Runner file commands
The runner uses a set of special files in _work/_temp/_runner_file_commands/ for inter-process communication during workflow execution:
- Adding paths to
$PATH→ append to the file referenced by$GITHUB_PATH - Setting environment variables → append to
$GITHUB_ENV - Setting step outputs → append to
$GITHUB_OUTPUT - Saving state between steps → append to
$GITHUB_STATE
This file-based approach replaced the older ::set-output:: and ::save-state:: commands (deprecated in 2022).
5. Job completion
On completion, the worker writes final diagnostic info, removes temporary files and directories, and exits. The listener then marks the job as completed on GitHub.
Directory layout
The runner root looks roughly like this:
/home/runner/
├── _work/
│   ├── YourRepository/     ← GITHUB_WORKSPACE
│   ├── _PipelineMapping/
│   └── _temp/
├── runners/
│   ├── 2.316.0/
│   └── 2.316.0.tgz
└── warmup/
Use $GITHUB_WORKSPACE (not a hardcoded path) to reference your repository directory — GitHub may change the underlying path structure between runner versions.
Pre-installed Software and Installing Dependencies
What's pre-installed
GitHub-hosted runners come with a large set of pre-installed tools. The full list for ubuntu-latest is published at:
actions/runner-images: ubuntu/Ubuntu2204-Readme.md
The runner image is updated periodically. This means npm, python, docker, and other tools may be updated underneath you. If builds start failing after no code changes, check whether the runner image was recently updated and whether a newly installed version of a tool changed behavior.
Installing additional software
When the pre-installed software isn't sufficient, there are four approaches:
1. Official package repositories (apt-get, brew, choco)
- name: Install a specific package version
  run: sudo apt-get install -y nodejs=18.*
Advantages: community-maintained, packages are stable per Ubuntu release, fast security patch propagation. Disadvantage: Ubuntu LTS repos lag behind upstream versions. Use a PPA or alternative source if you need a newer version.
2. curl/bash install scripts
- name: Install via official install script
  run: curl -fsSL https://deno.land/install.sh | sh
Risk: the remote script can change, be unavailable, or execute partially (e.g., on network timeout). A partially-executed install script can leave the system in an inconsistent state. Where possible, prefer pinning the script to a specific version hash and verifying the checksum. Avoid curl | bash for security-sensitive tooling — see the Security and Governance aside.
3. Custom Docker images
jobs:
  build:
    runs-on: ubuntu-latest
    container:
      image: my-registry/my-build-image:1.2.3
Advantages: fully controlled, reproducible environment; all dependencies are locked at image build time. Disadvantage: adds complexity (image maintenance, registry authentication, layer management). The image itself needs to be updated for security patches.
4. Private package repositories
Use a private registry (Nexus, Artifactory, GitHub Packages) when you need full control over which versions are available and want an audit trail of what was installed. Authentication requires managing credentials (ideally via OIDC or a secrets manager rather than long-lived tokens).
Recommendation
For most projects: rely on pre-installed tools and apt-get for any gaps. Pin Docker images and lock files for reproducibility. Reserve custom Docker images for cases where the build environment is genuinely complex or must match a specific production image.
Workflow Design Patterns
1. Readable Shell Scripts
-
Avoid long, unreadable command lines with heavy escaping. Instead:
-
Use here-docs for multi-line literals:
```bash
cat << EOF
Line 1 Line 2 Line 3 EOF
* Break long commands with `\` so each step is clear:

```bash
```bash
find . -type f -name "*.txt" -exec wc -l {} + \
| awk '$1 >= 100'
| sort -nr
| head -n 5
| awk '{print "File: " $2 " - Line Count: " $1}'
* Multi-line formatting improves **readability** for pipelines.
* Use **functions** in bash scripts for organization.
* Add **error checking** so you know which command failed.
* Use semicolons (`;`) when chaining commands on one line.

---

### 2. Matrix Builds in CI/CD

* **Matrix builds** let you run the same job across multiple environments (OS, language versions).
* **`if` conditions** restrict steps/jobs to certain environments.

#### Issues with combining matrix + `if`

1. **Redundancy**: You may spin up jobs that immediately skip steps, wasting CI resources.
2. **Complexity**: Too many conditionals make workflows hard to follow.

#### When it’s acceptable

* Most steps are common, with only a few OS-specific conditions.
* Conditional logic is **minimal** and doesn’t bloat the workflow.

#### Best practices

* Use **separate jobs or workflows** if environments differ significantly.
* Keep matrix builds for **similar jobs** across environments.
* Optimize for **clarity and maintainability**—complex workflows become fragile.

#### Conclusion

Combining matrix builds with `if` statements isn’t inherently wrong, but it often introduces unnecessary complexity and inefficiency. Default to **simple, targeted workflows** unless the overlap is strong enough to justify a combined approach.

---

## Designing Workflows with GitHub Actions

A workflow is a YAML file in `.github/workflows/` describing triggers (`on:`), jobs, and steps. Runners are ephemeral by default; each workflow run starts from a clean machine image. Jobs can run in parallel; use `needs:` to create dependencies.

### Minimal CI workflow skeleton

```yaml
name: CI
on:
 pull_request:
 push:
   branches: [main]

jobs:
 build:
   runs-on: ubuntu-latest
   steps:
     - uses: actions/checkout@v4
     - run: echo "build commands here"
.gitignore principle
Do not commit generated artifacts (build outputs, caches, logs, secrets). Prefer committing source, configs, and lockfiles; regenerate outputs in CI.
Control Flow in GitHub Actions
Every step has an implicit if: success() unless you override it. Use these status functions:
success(),failure(),cancelled(),always()
Use continue-on-error: true when a step can fail without poisoning the job. Use needs: to express job dependencies and enable DAG-style workflows.
jobs:
  test:
    runs-on: ubuntu-latest
    steps:
      - name: Run tests
        run: npm test
        continue-on-error: true

      - name: Always upload logs
        if: always()
        run: echo "upload logs here"
File Path Globs by Category
Path filters in on: push: paths: and on: pull_request: paths: use glob patterns. The following table shows common patterns grouped by theme.
| Category | Example Globs |
|---|---|
| Documentation | **.md, **/*.md, docs/**, README*, CHANGELOG.md, CONTRIBUTING.md, LICENSE.md |
| Project Configuration | .gitignore, .editorconfig, .github/**, .vscode/**, package.json, Dockerfile, docker-compose.yml, Makefile, requirements.txt |
| License and Legal | LICENSE, LICENCE, LICENSE.txt, **/LICENSE |
| CI/CD | .github/workflows/**, .github/dependabot.yml, .github/CODEOWNERS, .circleci/**, .gitlab-ci.yml |
Testing Branch Glob Patterns Locally
GitHub Actions uses the minimatch library under the hood to evaluate branch filters (the branches: key in your on: trigger). The following Node.js script replicates the exact options the runner uses, giving you a fast local feedback loop before you push.
const { minimatch } = require('minimatch');

function testPatterns(items, pattern, options) {
  const matches = [];
  const nonMatches = [];
  items.forEach(item => {
    if (minimatch(item, pattern, options)) {
      matches.push(item);
    } else {
      nonMatches.push(item);
    }
  });
  return { matches, nonMatches };
}

const itemsToTest = ['RELEASE/a', 'release/b', 'hotfix/a', 'feature/c'];
const pattern = 'release/**';

// These options match what the GitHub Actions runner passes to minimatch
const minimatchOptions = { dot: false, nobrace: true, nocase: false, nocomment: true, noext: true };

const result = testPatterns(itemsToTest, pattern, minimatchOptions);
console.log('Matching items:', result.matches);
console.log('Non-matching items:', result.nonMatches);
Run with node test-globs.js after npm install minimatch. Branch pattern matching is case-sensitive by default (nocase: false), so RELEASE/a will not match release/**.
Branching Strategies
Introduction
For code to be continuously integrated, it must be incorporated into the main application. This means that while developers' code becomes part of the unified application, it doesn't necessarily imply it's operational or visible to end-users. Integration ensures the code resides in a collective state, allowing other developers to build upon or amend it. You have to deploy it for people to be able to use it.
Part of being able to integrate code is through the use of PRs (pull requests.) This occurs when a developer is working on their copy of the code locally (i.e., a copy of the master, where all of the shared developers contributions are.) This allows the developer to have a stable workspace for just long enough to be able to work on their part. The expectation, however, is that it should be merged back into the master branch, where other developers have access to it and can work off of it. Features are normally complex, and multiple developers might have to work off of their code to build their feature.
Understanding Branching
Branching is a powerful mechanism to separate distinct lines of development work. When working on a pull request, for example, you isolate your changes on a separate branch to avoid interfering with others’ work. The integration of that work into the main codebase is accomplished later through a merge.
Your branching strategy should mirror your internal business processes. For instance, if you need to support multiple versions of an application, adopting long‐lived branches is sensible; each version becomes its own entity that is developed, tested, and maintained separately. Work is intentionally integration-deferred, and may never be integrated, e.g., v2 will never be merged into v1, albeit a few backports. Similarly, if your organization requires a thorough quality assurance process—perhaps due to regulatory concerns—a strategy like Git Flow, or the creation of dedicated release branches, can help manage the deferred integration of changes while allowing bug fixes to be backported as needed.
Continuous integration (CI) and continuous delivery (CD) practices further highlight the importance of how you manage branches. Regularly integrating work into a shared trunk ensures that your code remains cohesive and that issues arising from integration are caught early. Even if you maintain multiple long-lived branches, each branch can still benefit from CI/CD pipelines that validate and test changes continuously.
It is also important to recognize that branching itself is not problematic. A repository can comfortably house many branches—the challenge arises when integration is unnecessarily delayed. In environments where rapid delivery to customers is essential, long-lived feature branches can isolate changes for too long, reducing collaboration and hindering the overall responsiveness of the development process.
Finally, the evolution of development tooling has provided robust mechanisms to simulate production environments locally or via cloud automation. This enables early detection of integration issues, reduces reliance on extended QA cycles, and allows practices like feature flagging to gradually roll out new functionality. By aligning your branching strategy with both business objectives and modern CI/CD practices, you can ensure that changes are integrated efficiently and reliably into the production environment.
The Shift with Modern Development Tools
Historically, things were a bit different. Automated testing, linting, building, and having access to development environments was not as common. This meant that developers couldn't easily instill confidence in their changes, thus, they had to delay integration so that things could be tested. Let's look into the rationale behind trunk-based development by looking at what an older technique, GitHub Flow, provided and why it was so popular.
Trunk-Based Development Explained
One is trunk-based development, which encourages developers to merge everything into a single shared state, much like a puzzle. This branching strategy is normally preferred for new projects. Working from a single, shared state (i.e., trunk-based development) will require a very different way of working, and trunk-based development is the primary method of development which can enable CI/CD.
"Trunk-based" development (abbreviated as TBD) means to use the master branch as the main application. The branch is typically called "master" or "main", but the strategy is called "trunk-based". If something is merged into the "trunk", it is merged into the "master" or "main" branch.
Typical Developer's Workflow in Trunk-Based Development:
-
Sync Up: The developer starts by pulling the latest changes from the trunk.
-
Short-Lived Branch Creation (optional): If they choose to work in a branch, they create a short-lived branch off the trunk.
-
Development: Make code changes, refactorings, or add new features.
-
Commit Frequently: As they work, developers commit their changes frequently, even if the feature isn't complete.
-
Use Feature Flags: If they're working on a new feature that's not ready to be made public, they use feature flags to hide this functionality.
-
Merge to Trunk: Once they're ready, they merge their changes back to the trunk. Given the short-lived nature of their branches, this happens frequently, sometimes multiple times a day.
-
Continuous Integration: Upon merging, automated build and test processes kick in to ensure the new changes integrate well with the existing codebase and that the trunk remains in a releasable state.
-
Feedback Loop: If any issues arise from the integration, testing, or build processes, developers address them immediately to ensure the trunk remains stable.
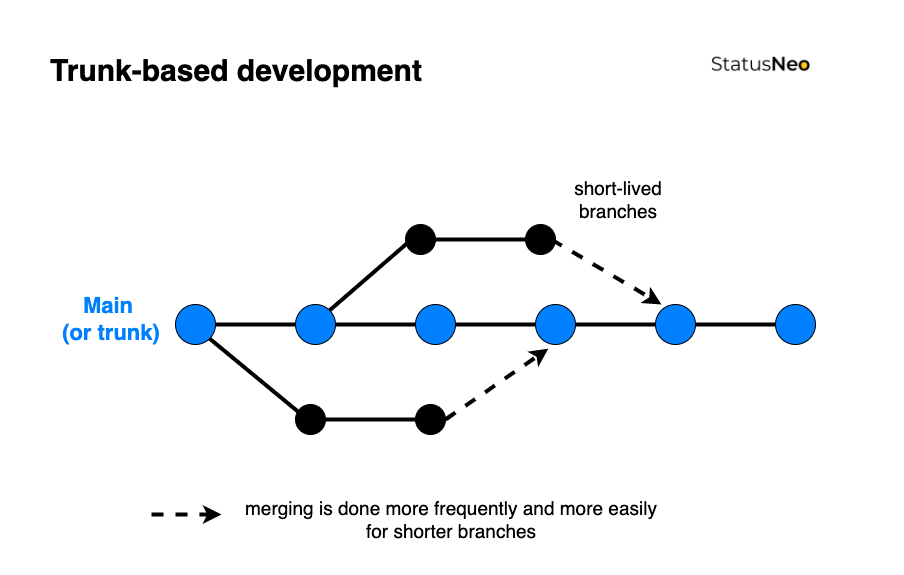
Beginners Guide to Trunk-Based Development (TBD) - StatusNeo
-
The branching strategy has become prevalent with the rise of web applications. For example, if a web app works in one browser, it's likely to work in others due to consistent environments. Most modern apps, like Amazon or Facebook, automatically show the latest version, without version selection. This method is especially effective when developers control the user's environment, such as with mobile apps. With master-based development, the development process is streamlined, continually integrating work into a shared state. The application should always be ready for release, easily verified through automated testing. Note that releasing does not mean that features are available to customers, only that they exist in the application (but are hidden.) Ready for release does not mean done.
-
This is especially useful for web applications because their environment is tightly controlled: it is sandboxed within the user's web-browser, which itself is continuously updated. This means that one has many ways to test it locally before releasing.
Differences with Other Branching Strategies
-
Git Flow, a branching strategy where it structures development into multiple branches:
mainfor official releases,developfor integration,featurebranches for new capabilities,releasebranches for preparing new releases, andhotfixbranches for urgent fixes, designed for projects with scheduled release cycles, and GitHub Flow, are still in use today, still have relevant business cases, but are a less popular strategy. For example, say you are deploying to an uncontrolled environment. In the past, your own infra was considered an uncontrolled environment because it was probably messy. Nowadays, this can refer to environments that are highly diverse, such as desktop applications, specialized hardware, or where extreme-extreme stability is required (this will significantly decrease ability to release new features, where even controlled environments may not be fully controllable.) Therefore, a heavy-weight approach, such as GitHub Flow or Git Flow might make more sense. This is because the branching pattern better reflects the business use case: the act of integration should be delayed because work is not truly integrated. Developers do not have confidence that their changes actually work, therefore, if other developers integrate on top of it, it could be a mess. Another situation are tasks that can't be broken down, such as large infrastructure changes or framework upgrades. This should be an exception to the norm, however. -
A user's web browser is much more of a sandboxed, controlled environment than a desktop app.
Typical Developer's Workflow in Git Flow:
Start from Develop: Developers usually start by syncing up with the latest changes in the develop branch.
Feature Development: When starting work on a new feature, they create a new branch prefixed with feature/, branching off from develop. They make commits and changes to this feature branch during development.
Integrate Feature: Once the feature is complete, they merge the feature/ branch into develop. The feature branch can then be deleted.
Preparing for Release: When it's time for a release (say a sprint end), a release branch is created off develop. This branch might be named something like release/1.2.3.
Any final adjustments, like bug fixes or documentation updates, are made in this branch.
Release: Once the release is ready, the release branch is merged into master and also back into develop to ensure that develop has all the changes. A tagged commit is created in master for the release, e.g., v1.2.3.
Hotfixes: If a critical bug arises in production, a hotfix/ branch is created off master. Once the hotfix is complete, it's merged back into both master and develop.
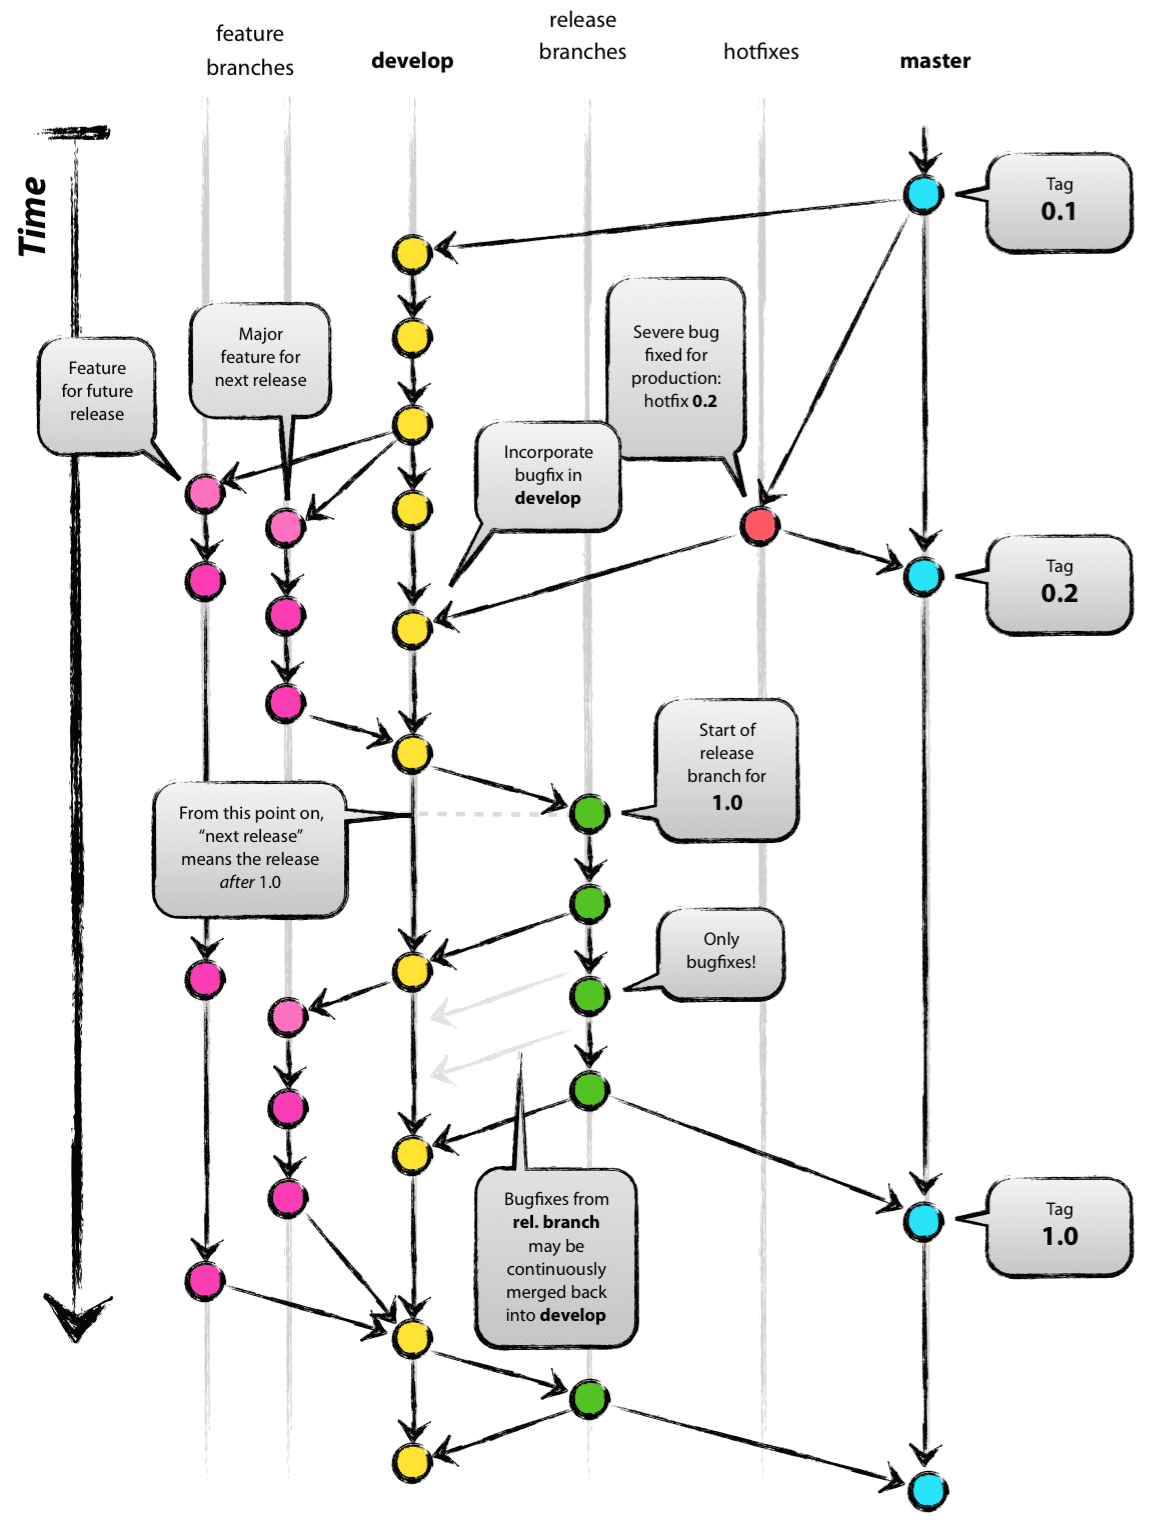 A successful Git branching model » nvie.com
-
In this case, it might be impossible to replicate the environment locally because it is a special environment procured by the vendor.
-
Another reason is that the software might be incredibly complex, requiring significant QA time (such as with a physical hardware device) that cannot be automated or emulated or would be incredibly cost-prohibitive to do so. In this case, the act of integration is more ambiguous because the software has to run on the device in order to work. Normally, however, with advances in development tooling, it should be possible to emulate these devices locally such that it is possible to have a fast feedback loop, which CI/CD aims to promote. In this case, Git Flow or GitHub Flow might be preferred because significant rework may be required because changes cannot be validated. However, it is still possible to partially practice continuous integration and deployment (see HP case study.) This is a rare situation, and won't be discussed in depth in this book.
-
Some branching strategies, like Git Flow or GitHub Flow, are designed to delay or slow down integration.
Git Flow structures development into multiple branches: main for official releases, develop for integration, feature branches for new capabilities, release branches for preparing new releases, and hotfix branches for urgent fixes. It's designed for projects with scheduled release cycles.
-
In the past, these strategies were especially popular because it wasn't clear if work was truly integrated if it was merged because development environments were difficult to create, and automated testing was not as prevalent. Developers could not be confident that their changes worked. There still are a few situations where this branching strategy makes sense, such as when the environment that it is being deployed to cannot be de-complexified in advance (and you do not have control over it), but is much less common in CI/CD because of the need to rapidly integrate.
-
The cloud was less dominant, and replicating on-premises hardware was prohibitive. Ensuring parity between production and development environments was challenging, leading to an increased testing burden. With manual testing being the primary method, it was costly to evaluate every commit. Consequently, larger, more infrequent releases were the norm, and they were introduced to production with much caution.
-
Development tooling to set up environments, and automated testing were less prevalent, so therefore this strategy allowed for manual testing to take place. Additionally, organizations may have worked in silos, making collaboration more difficult, thus, the act of integration was necessary because of complex dependencies that were not known beforehand. Developers were not confident that their changes were ok because they can't test them easily. The end-environment didn't exist, was unknown, or was not possible to set up. It was less common to use feature flags to selectively enable features in production, thus, the act of knowing if something was integrated was difficult. Therefore, it makes sense to delay integration: otherwise, the release might be totally broken perpetually as everyone keeps committing at break-neck speed with questionable commits--the state of the application's releasability is unknown. There wouldn't be any opportunities to pause and fix bugs otherwise, or to do a QA test pass as there would be more and more commits. One had to be very confident that their software worked, because rolling back or doing incremental deployments was more complex, and verifying your changes by sending them out to a few customers was difficult, thus, it was difficult to have a fast feedback loop. Given these constraints, i.e., not having access to a stable testing environment, not being able to experiment, limited monitoring, cultural things, it made sense to have a very comprehensive and careful approach to get changes into production. Developers don't know if their changes were integrated. A single bad change could cause production to go down, and would have been difficult to fix because rollbacks or infrastructure changes may be complicated. It may have impacted many thousands or hundreds of thousands of customers (depending on the application), resulting in significant downtime.
-
Comparing trunk-based and Git Flow strategies
Topic/Aspect Git Flow (Feature Branches) Trunk-Based (Master-Based)
-
Purpose Facilitates the separation of in-progress work and allows for different development stages. Encourages rapid, continuous integration into a unified mainline. Code is often deployment-ready.
-
Pace Development can be paced based on feature completion and milestones. Promotes a faster development pace with smaller, frequent commits, enabling quicker feedback loops.
-
Integration Work is maintained in distinct branches until deemed ready for integration. All developers integrate their changes frequently, fostering a shared understanding.
-
Complex Changes Provides flexibility for handling extensive changes, e.g., framework upgrades, large database schema upgrades, or architectural overhauls. Can handle extensive changes, often with the use of feature flags for incremental development.
-
Testing Code in feature branches can be tested independently before integration. Code is designed for continuous integration, allowing for frequent testing in shared environments.
-
Feature Flags Can be utilized when integrating changes, with an emphasis on management and oversight. Commonly used for partial feature rollouts and incremental changes. Management is crucial.
-
Merge Conflicts By keeping branches updated with the main branch, merge conflicts can be minimized. The nature of frequent integrations and smaller changes naturally minimizes merge conflicts.
-
Visibility & Collaboration Work in branches allows for focused development; explosive collaboration occurs during merging. Continual visibility of ongoing work encourages immediate feedback and collaboration.
-
Deployment & Testing in Prod Deployment to production is often milestone-driven, allowing for scheduled testing periods. Continuous integration permits immediate deployment and testing in production, often behind flags.
-
If you're using a trunk-based strategy, it doesn't mean that you can never ever create feature branches. Rather, it should be the default 99% of the time to stick with merging to the trunk, and then reaching out for a feature branch for complicated situations. If you are going to use a feature branch, make sure that you pull in changes regularly to keep it up to date.
-
It is now possible to continually verify the changes because computing power has increased significantly, allowing for builds to be done per PR, sometimes in parallel. This contrasts with the concept of a "nightly" build, which occurred after hours because it was a blocking operation and was usually very slow and complex, due to the lack of computing power and tooling.
Conclusion
-
Part of integrating continuously is acknowledging that software is messy, complicated, requires multiple dependencies and working with multiple people, all working on features that depend on each other implicitly. The act of integrating is much more than having changes from the master branch merged into your feature branch. It is about the act of integrating the ideas generated from the code, concepts, documentation, etc. with other developers. Developers have to be able to see and work with the code that others are working on in order for them to integrate this into their minds. Think back to the puzzle metaphor introduced earlier.
-
This sounds a bit scary--how do I know if my changes are ok? This is where CI comes in: it emphasizes automated testing, code review, building, and linting, to instill confidence in your changes. This allows a fast feedback loop: developers are able to find out if their changes are bad right away before the other developers can build upon them through the use of a build pipeline that automatically runs. Features can also be behind developer-created feature flags, much like the curtain for the puzzle in the art gallery.
Everything is all over the place! How do I keep track of features if they're spread out over commits?
-
Use an issue tracker/task tracker and attach tasks to each PR. Then, you can go to your user story and see a nice list of PRs. You can set up your PR software tool to force attaching a task prior to merging the PR. This would depend on your CI software.
-
Name your PRs well, and include the feature number in the title if possible.
-
Consider using feature branches if it's absolutely not possible to split up a feature. Note that you will not be able to benefit from feature flags.
When can I feature branch in trunk-based development?
-
I hate working in absolutes. There are times when feature branch development makes sense when using trunk-based development. However, it's more of an exception to the rule rather than a sometime-often thing. If you make a feature branch while working in trunk-based development, the whole world will not come crashing down, however, do remember that the work will not be integrated with the trunk.
-
In some cases, this is a desirable property. If you are doing a framework upgrade, and you have to change 1000 instances of a function call, for example, all over the place, over a period of, say a few months, then this might necessitate a feature branch. You don't want it merged with the customers, because a half-way done job is going to crash the application sometimes. And it might not be easily feature flag-able. You might want to deploy just that branch to a testing environment and do some tests on it. You might find it helps to not diverge too much from what's happening on the trunk, so consider merging things into it frequently. Really try and check with your colleagues on if it is possible to break it down, for example, by using the Strangler Pattern for example.
-
Sometimes, however, the problem becomes a bit more ambiguous. When you're working on a large, legacy application, there might be times when the code is so tightly bound together that it is not possible to do things in increments. This means that you should instead need to do some refactoring, to make sure that the application can be testable and maintainable, and open to changes. There is a good book on Clean Code for this purpose.
-
In other types of applications, such as embedded, the act of testing or releasing may necessitate an expensive endeavor, such as a single testing environment. There are some strategies on how to make this more palatable (see case study in Continuous Integration chapter for more information.)
If everything is a river, and keeps flowing, when can I interrupt the flow to do a QA test pass?
-
Consider using continuous delivery instead of continuous deployment if you need a QA test pass. This allows for human intervention to occur before a release is made.
-
Also consider shifting QA left (i.e., QA reviews some risky PRs.) This will make less work for QA in future stages and fixes the issues at the source.
Microservices
-
Microservices are ways to divide a large application up into smaller ones. This is helpful for CI/CD pipelines, because larger applications normally take longer to build, thus compromising the fast feedback loop for developers. It may also take longer to deploy, because there is more stuff. It can be unclear how to deploy it, as multiple services have to be started in parallel.
-
The downside is that it can add complexity, so therefore only transition to microservices once you are very comfortable with the build process.
References
- Source Git Flow Is A Bad Idea - YouTube (very interesting YouTube comments)
The way that features are written needs to change
-
Just doing the same things that you were doing before is likely going to make it so that you're not able to test in production.
-
Small PRs that change a few lines of code are still, technically, small changes but it doesn't mean that you can reliably test them in production, nor send them out. For example, making the login page perfect before working on the log in button makes it not possible to assess whether the backend works, because it's not integrated.
-
Code can't be written in an untestable blob. In order to instill confidence in it, it has to be testable. It has to have integration points where other team members (including yourself) can inject into it. This overlaps significantly with having well-structured code.
-
Consequently, a large, spaghetti codebase that needs many things to change to change a single thing is likely to be more risky than making small changes. It is also hard to flag it. Therefore, code quality is important, and you may need to do refactors.
Example 1: Code Not Easily Integratable
Context: A web application feature that adds a new user profile page.
Code Structure: A single large file, UserProfilePage.js, which combines HTML, CSS, and JavaScript.
// UserProfilePage.js

document.write(`
<html>
<head>
<style>
  /* CSS styles here */

  .profile-container { /* styling */ }
  .user-info { /* styling */ }

  /* More CSS... */
</style>
</head>
<body>
  <div class="profile-container">
    <div class="user-info">
      <!-- User information elements -->
    </div>
    <!-- More HTML content -->
  </div>

  <script>
    // JavaScript logic here

    function loadUserProfile() {
      // AJAX call to get user data
      // Direct DOM manipulation to render user data
    }

    loadUserProfile();

    // More JavaScript code...
  </script>
</body>
</html>
`);
// Additional logic for handling user interactions, etc.
Issues:
- Monolithic Structure: The entire feature is in a single file, making it hard to isolate changes.
- Testing Complexity: Testing individual aspects like AJAX calls or UI components is difficult due to the lack of modularity.
- Integration Challenges: Integrating this with other features can cause conflicts and require extensive re-testing of the entire page.
Example 2: Code Easily Integratable
Context: The same user profile page feature, but designed for better integrability.
Code Structure: Separated into multiple files with clear responsibilities.
- HTML (UserProfile.html)
<div class="profile-container">
  <div class="user-info" id="userInfo">
    <!-- User information will be loaded here -->
  </div>
</div>
- CSS (UserProfile.css)
.profile-container {
  /* styling */
}
.user-info {
  /* styling */
}

/* More CSS... */
- JavaScript (UserProfile.js)
function loadUserProfile() {
  fetch('/api/user/profile')
    .then(response => response.json())
    .then(userData => renderUserInfo(userData));
}

function renderUserInfo(userData) {
  const userInfoDiv = document.getElementById('userInfo');
  userInfoDiv.innerHTML = /* Logic to create user info elements */;
}

document.addEventListener('DOMContentLoaded', loadUserProfile);
Advantages:
- Modular Design: Separate files for HTML, CSS, and JavaScript improve readability and maintainability.
- Easier Testing: Each function, like
loadUserProfileorrenderUserInfo, can be individually unit tested. - Smooth Integration: Smaller, well-defined changes are less prone to merge conflicts and can be integrated more frequently.
Key Takeaways
By comparing these two examples, it’s evident that the second approach aligns better with CI/CD practices. The modular and separated structure makes it easier to implement, test, review, and integrate changes, facilitating a more efficient and reliable development process in a team environment. This reflects the CI/CD focus on small, incremental, and testable changes that can be frequently integrated into the main codebase.
-
What incremental changes allow you to do is to deliver customer value faster. The reason why you'd want to do that is because you need rapid feedback. It's sort of like pulling a thread at the end.
-
And, if your code is not in a way where you can do that, that is, it is not modular, then continuous integration can't be performed. If I have to change 100 lines of code to change one thing, then it's not going to be easy to break down small features and get confidence on them.
-
Similarly, if there's a big blob of code that has no entry points to test it, then it's going to be hard to get feedback on your code. It's going to be hard to create tests, and to integrate against, since the act of integration is the concept of interfacing. You need an interface to integrate against, not a huge smooth wall.
-
Microservices might be helpful, but, it sort of depends. For example, if the two applications can be easily split apart, then do it. This literally forces an interface between the two components, and can also make them more scalable.
-
The other way is to enforce the separation in code. There are various tools that will fail the build pipeline (purposefully) if one module uses another module in a way that it's not supposed to be used (i.e,. connected to it.) This can help you remove the strands that two modules are connected by, incrementally, and prevent new ones from coming up. It can also help with the transition to microservices.
-
Microservices aren't all that good though. They can introduce complexity when deploying, as multiple versions have to be managed. Microservices are usually more useful when you have enough developers that justifies it, such as when you need to scale quickly, thus you hire more developers, thus, you transition to microservices.
Misc
-
Avoid scripts on the CI pipeline that mutate the branch (or make commits to it.) For example, a script that fixes linting issues and pushes the commits back to the branch. This is an issue because:
-
The code is no longer tested on a developer's machine. If the code is different from what the developer tested, even if the changes are small, then it means that the developer is unsure if the changes still work.
-
Linting is useful for developers working on the PR as well. For example, linting makes the code more readable, and so if it is done on a developer's computer, they are able to benefit from these improvements while they work.
-
If a developer does not have linting set up, do they have the rest of the environment set up? If there are linting failures on the CI, then this is a red flag: there is something misconfigured in the developer's environment. By auto fixing it, it doesn't promote the ability for a developer to know if they have an invalid environment, or a misconfiguration between what the CI is doing and what the developer's computer is doing.
-
This does not mean that the CI should not check, rather, it should not push code that the developer has not tested.
-
An example of how continuous integration can be adapted depending on the use case. CASE STUDY: This book was super interesting: Practical Approach to Large-Scale Agile Development, A: How HP Transformed LaserJet FutureSmart Firmware (Agile Software Development Series) eBook : Gruver, Gary, Young, Mike, Fulghum, Pat: Amazon.ca: Kindle Store. It is about HP and they have many levels of testing (L0 to L4.) The old system was that all of the tests had to run, and if something failed after it was merged (because the test suite is just too large to run per push), then the whole pipeline would break. The solution was to break apart the tests into layers. Each level in HP's testing is more comprehensive than the last and takes longer each time. L0 for example is fast but is required to merge the code; this catches lots of bugs. Then after it is merged, L1 tests run. If L1 tests fail, then the code is auto-reverted (after it is merged) and there are merge conflicts occasionally but not often. If everything is ok, L2 runs less often, until L4 comes which runs once a day. They have been able to get their pipeline uptime up from 80% to almost 100%. The issue is that the tests can't be sped up because they're emulated and in some cases require hardware. This is technically a nightly build, but it's hard to emulate everything with 100% accuracy. In this case, changes are incrementally integrated continuously by increasingly instilling confidence in build artifacts at every stage.
The Power of CI/CD for Solo Developers
- After looking at CI/CD, including from the perspective of the puzzle (which is a shared activity), you might wonder why CI/CD would apply to single developers, given that CI/CD looks like it should be applied to teams, as there are multiple people integrating their changes early on. This is a completely valid question, given the complexity that CI/CD appears to entail. The foundational principles of CI/CD: ensuring that changes are tested, robust, and don't break existing functionality can make a solo's development workflow much more efficient. Let's look into why and how CI/CD is a valuable tool for solo developers.
The Power of CI/CD for Solo Developers
Often, when people hear about Continuous Integration and Continuous Deployment (CI/CD), they envision large teams with multiple developers collaborating on vast codebases. The immediate association is with complex projects requiring intricate workflows to integrate code changes from diverse sources. However, it's essential to recognize that CI/CD is not just for these large-scale scenarios.
Yes, even if you're a solo developer, CI/CD can be incredibly beneficial for you! Here's why:
1. Immediate Feedback: As a solo developer, you might be wearing multiple hats. From coding to testing, deploying, and even handling user feedback. Having an automated CI/CD pipeline offers instant feedback on your code changes, ensuring you're always on the right track. This continuous feedback mechanism can significantly speed up your development process.
2. Code Quality and Consistency: As a solo developer, it's tempting to think that consistent code quality might be easier to maintain since you're the only one coding. However, even individual developers can inadvertently introduce inconsistencies over time. By incorporating automated testing and linting into your CI process, you can ensure that your code consistently meets set quality standards and remains free from both common errors and stylistic inconsistencies.
3. Peace of Mind: Each commit you push undergoes automatic testing and building, offering a level of assurance that manual processes can't provide. This validation minimizes the risk of unintentional regressions or bugs, granting you greater peace of mind with each update.
4. Efficient Problem Solving: Mistakes are inevitable, no matter how experienced a developer you are. With CI/CD in place, if you introduce an error, the system alerts you immediately. This prompt notification allows you to quickly pinpoint the issue, often just by going back a few commits, saving you from potential hours of debugging down the line.
5. Preparation for Team Growth: Today, you might be working solo, but what if you decide to expand your team in the future? Having a CI/CD setup in place makes this transition smoother. New team members can quickly get onboarded, with the assurance that the code they push meets the project's standards.
6. Better Version Control: With regular integrations, it's easier to manage versions of your application. You can be confident that each version of your app, especially those that get deployed, have passed through rigorous automated checks. This makes rollbacks or feature flagging more straightforward and more reliable.
7. Time Savings: While setting up CI/CD might seem like an upfront time investment, the long-term benefits in terms of time saved are significant. Automation reduces manual intervention, letting you focus on what you do best: writing great code.
In conclusion, CI/CD is not just a large team's tool. It's a robust framework that ensures efficiency, quality, and consistency, whether you're a team of one or one hundred. Embrace it, and watch your solo development journey become more streamlined and efficient! |
Code Reviews in CI/CD
Code Review (in the context of CI/CD) is the systematic examination of source code changes by one or more individuals—other than the original author—before those changes are merged or deployed.
-
Code review also provides the capability for other developers to find bugs and become more familiar with repository changes. This helps understand how integrations will fit together.
-
Code review is a critical part of CI/CD because it acts as a gatekeeper to prevent buggy code from reaching production, providing opportunities for feedback on usability, security, and design.
-
During code review, the reviewer(s) will look at the changes and verify correctness, making inline comments on specific lines of a pull request.
-
Code review themes:
-
Knowledge transfer
-
Finding bugs
-
Design discussions
-
Verifying scope
-
Security feedback
-
This process helps increase code quality and prevents bugs from reaching production. Sometimes a large volume of comments (nitpicks) can appear in the PR, which may be better handled with direct discussion or tooling (e.g., automated linters).
-
Code review has additional softer advantages, such as building professional relationships and trust between teammates.
Why is code review important?
Key points from various resources:
- A simple bug can lead to significant losses in time and customers.
- Peer code review can catch issues early, reducing costs.
- It fosters collaboration during the coding phase.
- No feature addition is worth introducing severe bugs.
- Effective code review can be a competitive advantage.
- Concerns about time and negative social impacts can be mitigated with proper techniques and tools.
Time spent during review is crucial; it should be limited to ensure focus, and slowing down the review increases the number of defects detected. Traditional in-person reviews aren't always necessary; many defects can be found asynchronously via pre-meeting reading or electronic tools. Omission defects are among the most challenging to catch, so checklists can be helpful.
Omissions often refer to missing tests, missing error-handling, insufficient documentation, or incorrectly "skipped" logic paths. Checklists can help guide reviewers to consider these potential gaps.
The following is from an episode from the Agile Embedded Podcast:
- Code reviews are essential: Not just for catching bugs, but for knowledge transfer, mentoring, shared understanding of the codebase and requirements, and shared ownership. Avoiding soloed knowledge silos is crucial for business continuity and team morale.
- Focus on design, not minutiae: Code reviews should prioritize high-level design and architecture discussions. Automated tools should handle code style (braces, indentation, etc.) to avoid "bikeshedding." Review interfaces and module designs before full implementation.
- Early and often: Conduct reviews early in the design process and iterate on smaller code chunks. This prevents large, overwhelming reviews and keeps feedback focused and actionable.
- Establish a process: Create checklists for design and code reviews, prioritize review requests (don't let them pile up!), and consider a style guide enforced by automated tooling. If conducting synchronous reviews, set a clear agenda.
- Communicate intent: Before diving into a review, discuss the code's purpose (production-ready, experimental, etc.) and the review's goals. This ensures everyone is on the same page and avoids misunderstandings.
- Positive framing: Start reviews by highlighting successes and then offer constructive suggestions. This helps maintain a positive and collaborative atmosphere.
- Shared ownership and mentoring: Code reviews are opportunities for knowledge transfer and mentoring in both directions (junior ↔ senior). Juniors can offer fresh perspectives and catch errors, while seniors can share their expertise.
- Practicalities: Aim for daily reviews of small, cohesive code chunks. Pull requests are a useful mechanism, but informal, ad-hoc reviews are also valuable. Establish a routine for handling reviews to avoid bottlenecks.
- Consider pair programming: For continuous review and collaboration, explore pair or mob programming. While seemingly less efficient in the short term, these practices can improve overall code quality and team performance.
- Metrics: Don't over-index on code review metrics. Focusing on the process is more valuable, particularly minimizing the waiting time for review feedback.
1. The Basic Process & Workflow
- So, how does this code review thing actually work day-to-day? How do I even get my code reviewed in the first place?
- Is there a standard process? Like, does the code need to pass automated checks in the CI pipeline before a human even looks at it? Should it?
- What happens after the review? If someone finds issues, how do we handle uploading fixes for another look?
- I've heard about pull requests (PRs). Is that the main way reviews happen?
- What's the deal with merging? Does merging code mean it's immediately live in production, or is that separate? How does CI/CD handle that transition after a review approval?
- Sometimes PRs seem to get stuck waiting for review for ages. Is that normal? How are we supposed to handle that, especially if it blocks things? Can I ever just merge my own stuff if no one looks at it?
- Who typically does the reviewing? Is it seniors, peers, testers, or someone else?
- Do I need to be an expert in the programming language before I can even start reviewing someone else's code? How much do I really need to understand?
2. Scope and Depth of Review
- How much detail are reviewers expected to go into? Is there a standard or best practice for how deep the review should be?
- What are the main things reviewers are usually looking for? Are there common mistakes or patterns they focus on?
- I'm confused about the purpose. Is code review mainly for finding bugs, or is it more about improving the code's structure and maintainability? Isn't finding bugs what automated tests in the CI pipeline are for?
- How nitpicky should a review be? Is it okay to comment on small things like variable names, or should we stick to bigger issues?
- What about code style? Should reviewers point out style guide violations, or should we rely entirely on automated linters run in the CI process?
3. Handling Different Situations & Code Types
- How do we handle reviewing really big changes, like large features or major refactoring? Breaking a big feature into multiple PRs sounds good, but doesn't that just lead to a final giant PR anyway? And how can anyone effectively review thousands of lines of refactoring?
- Should the review process be different for brand new projects versus established codebases?
- What about code that relies heavily on external libraries or frameworks the reviewer isn't familiar with? How can they review that effectively?
- Does the review process change for specific types of code, like security-sensitive code or infrastructure-as-code (Terraform, etc.)?
- What about generated code, like stuff from tools or AI assistants (Copilot)? Should that be reviewed, skipped, or reviewed differently?
4. Tools and Automation
- Are there specific tools people recommend for code review, especially for larger teams? Have you tried any specific ones?
- What about automated review tools like SonarQube? How do they fit in? Can they replace manual reviews, or are they just a supplement? (And are tools like SonarSource free?)
- Should linters and auto-formatters be run automatically as part of the CI pipeline or commit hooks to handle style stuff before review?
- How do tools integrate? Can AI tools help review PRs directly in places like GitHub or Azure DevOps? Is that generally available?
5. Team Culture, Communication & Disagreements
- How do we handle disagreements during a review? What's the process if the author and reviewer can't agree – escalate to a lead?
- What if a reviewer gives feedback that seems wrong, especially if they're more senior? How do you push back respectfully?
- Sometimes the feedback isn't clear about what needs changing or why. How can reviewers give more helpful feedback?
- How do you build a team culture where reviews feel safe and constructive ("psychological safety")?
- What if the author introduces a bug based on a reviewer's suggestion? Who's responsible then?
- Is pair programming a replacement for code review, or do they serve different purposes in the workflow?
6. Testing and Quality
- Should the reviewer actually check out the code branch and run it locally? Or even run tests?
- What happens if a PR is missing unit tests? Is that usually a blocker for review?
- How do we ensure the automated tests (unit, integration) run in CI actually reflect whether the code works correctly? Sometimes tests pass, but the feature seems broken manually.
How to prioritize things in your repo
Prioritization is key:
-
Focus on high-impact tasks like fixing critical Dependabot alerts, updating the base image, and addressing performance bottlenecks in your pipeline.
-
Delegate or automate low-priority tasks like removing inactive user accounts, linting, and code formatting.
Proactive maintenance:
-
Subscribe to GitHub's Deprecation Archives and Changelog to stay ahead of breaking changes.
-
Regularly review and consolidate workarounds in your scripts for efficiency.
-
Maintain a stable, modular application with good code health and test coverage.
Dependency management:
-
Understand the risks and benefits of upgrading transitive dependencies.
-
Choose a strategy for updating dependencies (always latest or pinned versions).
-
Consider using the latest packages for security fixes, balancing reproducibility.
Workflow optimization:
-
Expect to revise your workflow as dependencies evolve.
-
Use caching, branch/file ignores, and selective test disabling for efficiency.
-
Analyze historical PR comments to identify recurring issues and proactively address them.
Remember: Automate what you can, delegate when possible, and always prioritize tasks for maximum impact.
Determining the "top 5" most useful patterns from the "Busy Person Patterns" can vary based on individual needs and contexts. However, commonly encountered scenarios in busy schedules might make the following patterns particularly valuable: warning this is creative commons licensed
Prioritize: This is fundamental for effective time management. By prioritizing tasks based on urgency and importance, you can ensure that the most critical tasks are addressed first, which is crucial in a busy schedule.
Just Start: Procrastination can be a significant barrier to productivity. This pattern encourages starting a task, even with incomplete information, which can be particularly useful in overcoming initial inertia and making progress.
Contiguous Time Blocks: In an era of constant interruptions, dedicating uninterrupted time to a task can significantly improve focus and efficiency, especially for complex or demanding tasks.
Delegate: This pattern is key in workload management, especially for those in leadership roles or working within teams. Delegating tasks effectively can help manage your workload and also empower others by entrusting them with responsibilities.
Batch the Simple Stuff: By grouping similar small tasks, you can handle them more efficiently, freeing up time for more significant tasks. This pattern is particularly useful for managing the multitude of minor tasks that can otherwise fragment your day.
General CI/CD Anti-patterns
Naming conventions
-
Avoid slashes, spaces, and other special characters (might interfere with scripts)
-
Prefix with "dev-", "int-", or "prod-" depending on the env (also helps with regex)
Avoid typos in pipeline steps
Avoid incorrect pipeline step names (e.g., wrong versions) as this will impede debuggability
Avoid pipeline steps with names that become truncated (and vice-versa, too abbreviated)
- From "An empirical characterization of bad practices in continuous integration"
Feature branches are used instead of feature toggles (R6)
-
Feature toggles can be used in production
-
2007.05760.pdf (arxiv.org) feature toggles might be better
-
[Exploring Differences and Commonalities between Feature Flags and Configuration Options (acm.org)]
-
Best practices for feature toggles, starting at page 14 1907.06157.pdf (arxiv.org)
-
I don't agree with this as much, I think there's a lot of nuance and context needed here. This might go in the controversial patterns.
<!-- -->
-
Less relevant (each pattern requires lots of context)
-
Beginners may follow these code patterns blindly, but some require more information about the root cause of the smell to see if it applies to their project. The following code smells are heavily debated in the literature and may or may not apply to your project. Each section provides more context on when it might be a smell.
A task is implemented using an unsuitable tool/plugin (I6)
Number of branches do not fit the project needs/characteristics (R4)
Generated artifacts are versioned, while they should not (R8)
Some pipeline's tasks are started manually (BP13)
- Manual QA testing is an exception.
Poor build triggering strategy (BP11)
- A lot lot lot of people on GitHub have issues with this, unsure how to make the rule to trigger the build
Builds triggered too often
- For example, pushing to an unrelated branch and having a pipeline do a build but it doesn't make any sense, as the artifact is not required (or vice-versa.) Branch tags are difficult.
A build is succeeded when a task is failed or an error is thrown (BP16)
-
The way the build output is reported is also particularly important. First of all, respondents believe that ignoring the outcome of a task when determining the build status (BP16) defeats the primary purpose of CI. These kinds of smells may occur when, for example, static analysis tools produce high severity warnings without failing a build. While a previous study found that this practice is indeed adopted for tools that may produce a high number of false positives (Wedyan et al., 2009), one SO post remarked that ". . . if the build fails when a potential bug is introduced, the amount of time required to fix it is reduced.", and a different user in the same discussion highlighted that "If you want to use static analysis do it right, fix the problem when it occurs, don't let an error propagate further into the system."
-
The entire purpose of CI/CD is to not allow integration issues to enter production. Having said that, there are exceptions to this rule, such as optional tests. However, if the build status is ignored, then there is no purpose for CI/CD, because it is performing work that is not of use.
-
Counterpoints:
-
Not all warnings and issues should be failures, and it depends on how failures are reported. This can require human judgment. When should one report failures and when is something considered a failure? Write about this some more.
-
Consider gradually transitioning individual warnings to errors if the build still completes. This allows you to incrementally adopt CI/CD.
-
Always failing the build on minor things will not allow the build to be continuous, and can lower developer morale. There has to be a balance, however.
-
Deleting dead code (that is 100% covered), can cause test coverage to decrease, even though the code is not used. This is because other code might not be covered, reducing overall percentage covered. Failing the build in this situation doesn't make sense.
Missing notification mechanism (BP23) and Issue notifications are ignored (C6)
-
"A related bad smell judged as relevant is the lack of an explicit notification of the build outcome (BP23) to developers through emails or other channels. In other words, having the build status only reported in the CI dashboard is not particularly effective, because developers might not realize that a build has failed."
-
If the build is intermittently failing, it could mean one of several things, such as flaky tests. Flaky tests indicate that the tests are bad, and might not be truly testing your application. Failed builds mean something went wrong, and re-running the build wastes time if the root cause is not addressed.
-
Consider tailoring notification mechanism and priority.
-
Ensures proactive issue resolutions.
-
Counterpoints:
-
Notification fatigue can occur, meaning important notifications are missed.
Build failures are not fixed immediately giving priority to other changes (C5)
-
If a build failure occurs, for example, on a secondary pipeline (i.e., a merge to master, and not on the PR), then this means that the software is no longer continuously integrated because the artifacts cannot be deployed. These issues quickly build up, because each subsequent build also fails, so it is difficult to determine if unwanted or broken changes (such as code compilation errors) have entered the pipeline.
-
If build failures are not found quickly, then tech debt can compound. This means that multiple failures can accumulate, making the root cause difficult to debug.
-
Counterpoints:
Transient failures
- Some build failures are transient, for example, npmjs.org is down. This means that the build failures cannot be fixed immediately because it depends on a third-party service. Halting development during this time would not make sense.
Missing rollback strategy (D3)
-
If there's an issue in production, one can rollback or roll-forward. Not being able to rollback quickly means not being able to properly manage risk. This could lead to production being down because an unintended change cannot be easily reversed.
-
Counterpoint:
-
Rollbacks are always inherently risky, due to changes that cannot be rolled back, for example database changes. This means that the team should not consider rollbacks to be an option. Therefore, roll-forwards should be used to push state in one direction (and not back) due to issues with reverting state.
Build time for the "commit stage" overcomes the 10-minutes rule (BP27)
-
I don't really agree with this either. The 10 minute rule came from someone's personal experience working in a couple of teams and doesn't have empirical basis. Having said that, super long builds means that progress will slow.
-
Counterpoint:
-
This one is based on a rule of thumb and does not have empirical evidence.
Programming a somewhat complicated weather application
This section explores CI/CD through the practical lens of building a sophisticated weather application. We'll dissect key features and demonstrate structuring a CI/CD pipeline using GitHub Actions.
Imagine wearing a project manager's hat and envisioning potential features for our weather application:
-
Displaying precipitation data for user-specified locations
-
Zoom functionality for map visualization
-
Backend database for storing updated weather information
-
REST API to serve data to the front-end
-
Geolocation service to convert addresses to coordinates
-
Caching mechanisms for performance optimization
-
Historical precipitation data for a comprehensive user experience
-
Pipeline feasibility for regenerating weather map tiles
Key Features and Development Strategy:
1. Interactive World Map: Our primary interface is a world map, designed to be interactive, allowing users to zoom into specific areas without reloading the entire map. We will be using the public open street map server for now but will show how you can self host it, including load balancing strategies.
2. Weather Forecast Integration: We will integrate real-time weather forecasting, beginning with current temperature displays at specific locations. This involves creating map overlays to show temperature variations across regions simultaneously.First, however, we're just going to get the temperature of our location.
3. Enhanced Map Visualization: The map will also display various weather parameters, such as wind speeds and temperature gradients. Given the potential for high user traffic, especially in densely populated areas like India, implementing load balancing and data compression strategies, such as vector tile maps, will be crucial.
5. Usage Analytics: Collecting data on user interactions with the map will provide insights to refine backend processes and enhance data visualization and user engagement on the platform.
Application Hosting and User Engagement:
- User features will include account creation and subscription to event forecasts. A backend batch job will manage notifications through a queuing system, supporting large-scale user notifications with email tracking.

Interactive weather maps - OpenWeatherMap
Here's an overview of our application architecture.
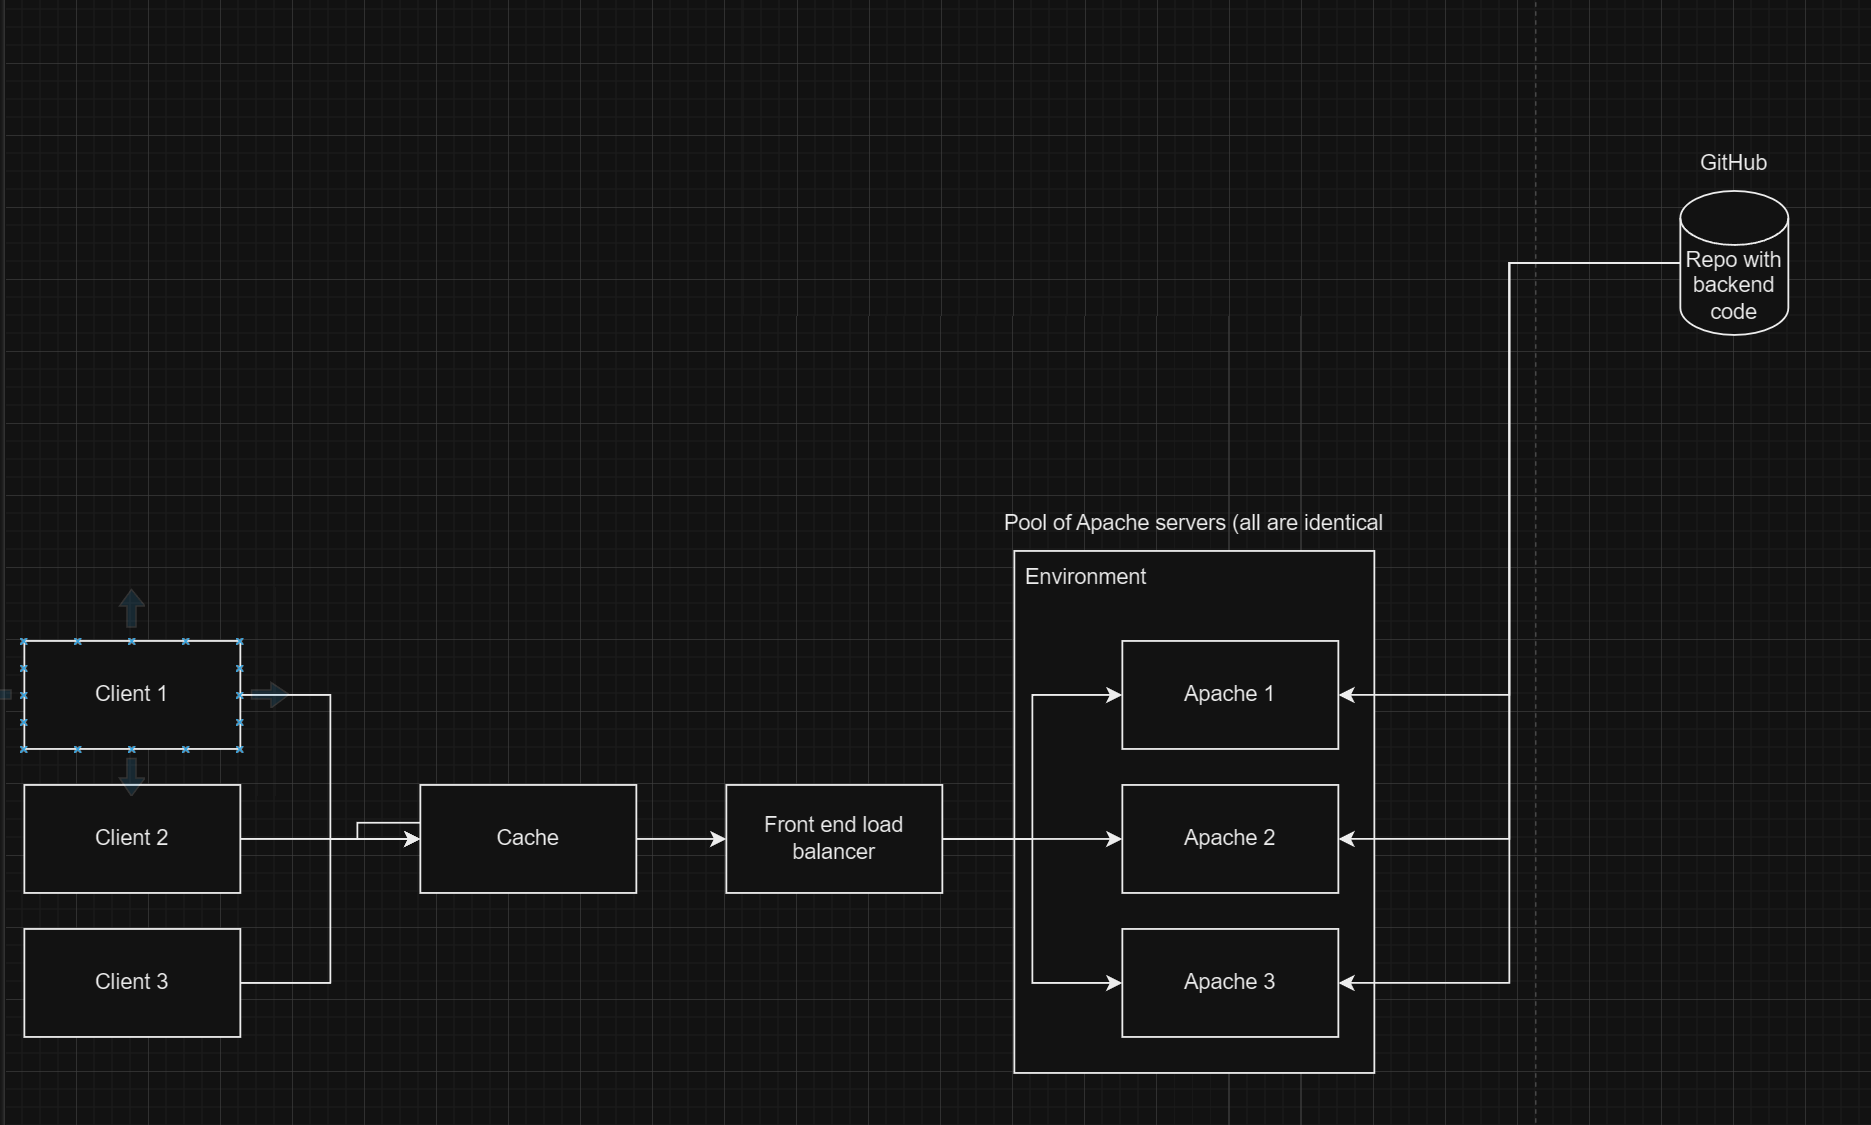
Creating a new weather application using React involves several steps, from setting up your development environment to deploying the application. This book is not, of course, about how to learn React, so I won't be going into very much detail about how this React code actually works.
The first step is to provision a local development environment, enabling a quick feedback loop. This ensures immediate testing of changes, such as adding text to a weather application and seeing updates appear almost instantly in the React application.
You will have four different environments, each with a commonly used abbreviation. We will name some of the resource groups using these abbreviations as suffixes.
Environment Number Full Name Common Abbreviation
1 Local Development Local or Dev
2 Integration INT
3 Pre-production PPE
4 Production Prod
Naming conventions
There are a lot of things that you will need to name, such as pipelines, and other resources. Therefore, it is helpful to use a consistent naming scheme to make it easier to identify those resources.
Define your naming convention - Cloud Adoption Framework | Microsoft Learn
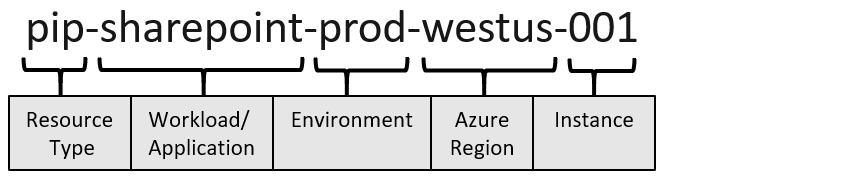
Let's call the resource type CDP and the workload is our weather application.
It should therefore be prefixed with cdp-weather-web-prod
This provides a nice name we can use later and helps us inventory and group our resources, making it clear which resource is assigned to what.
Step 1: Set Up Your Development Environment
1. Install Node.js and npm:
-
Visit [Node.js's website](https://nodejs.org/) and download the installer for your operating system. This will also install npm (Node Package Manager) which is essential for managing JavaScript packages.
-
To verify the installation, run
node -vandnpm -vin your terminal or command prompt. This should display the current versions of Node.js and npm installed. Keep a note of this as you'll need it for later.
2. Install a Code Editor:
- A code editor will help you to write your code more efficiently. [Visual Studio Code](https://code.visualstudio.com/) is a popular choice among developers because it supports JavaScript and React out of the box, along with many useful extensions.
Installing Git
Windows:
1. Download the Installer:
-
Visit the official Git website: [Git Downloads](https://git-scm.com/downloads).
-
Click on "Windows" to download the latest version of Git for Windows.
2. Run the Installer:
-
Once the download is complete, open the installer.
-
Proceed through the installation wizard. You can accept the default settings, which are suitable for most users. However, you may choose to customize the components to install, the default editor for Git, and other options depending on your preference.
3. Verify Installation:
- Open Command Prompt (cmd) and type
git \--version. This command will display the installed version of Git if the installation was successful.
macOS:
1. Install using Homebrew (recommended):
- First, install Homebrew by opening Terminal and running:
/bin/bash -c "$(curl -fsSL https://raw.githubusercontent.com/Homebrew/install/HEAD/install.sh)"
- Once Homebrew is installed, install Git by typing:
brew install git
2. Verify Installation:
- In the Terminal, type
git \--versionto confirm that Git is installed.
Linux:
1. Install Git:
-
Open a terminal.
-
For Debian/Ubuntu based distributions, use:
sudo apt-get update

sudo apt-get install git
- For Fedora, use:
sudo dnf install git
- For other distributions, use the package manager accordingly.
2. Verify Installation:
- Type
git \--versionin the terminal to check the installed version.
Installing GitHub Desktop (optional)
Windows and macOS:
1. Download GitHub Desktop:
-
Visit the GitHub Desktop download page: [GitHub Desktop](https://desktop.github.com/).
-
Click on the download link for Windows or macOS, depending on your operating system.
2. Install GitHub Desktop:
-
Windows:
-
After downloading, run the GitHub Desktop setup file.
-
Follow the installation instructions to complete the setup.
-
macOS:
-
Open the downloaded
.dmgfile and drag the GitHub Desktop application to your Applications folder.
3. Verify Installation:
- Open GitHub Desktop. The application should launch and prompt you to log in with your GitHub credentials.
4. Setup GitHub Desktop:
- After logging in, you can configure GitHub Desktop to connect with your GitHub repositories. You can clone existing repositories, create new ones, or add local repositories.
When you install Git, it typically comes with a tool called Git Credential Manager, which helps with authentication. If you're working in an interactive shell, you might see a pop-up from this tool when you try to access a repository. In a more basic command prompt environment, without a graphical interface, you'll need to follow specific instructions for accessing GitHub repositories. These instructions could involve pasting a link into a web browser or registering a device, using OAuth for authorization.
While you have the option to use a personal access token (PAT) for authentication, it's generally not recommended due to security risks, such as potential leaks and the extended lifespan of tokens. If you must use a PAT, consider setting its expiration to one week or less and arranging for it to be renewed periodically to enhance security.
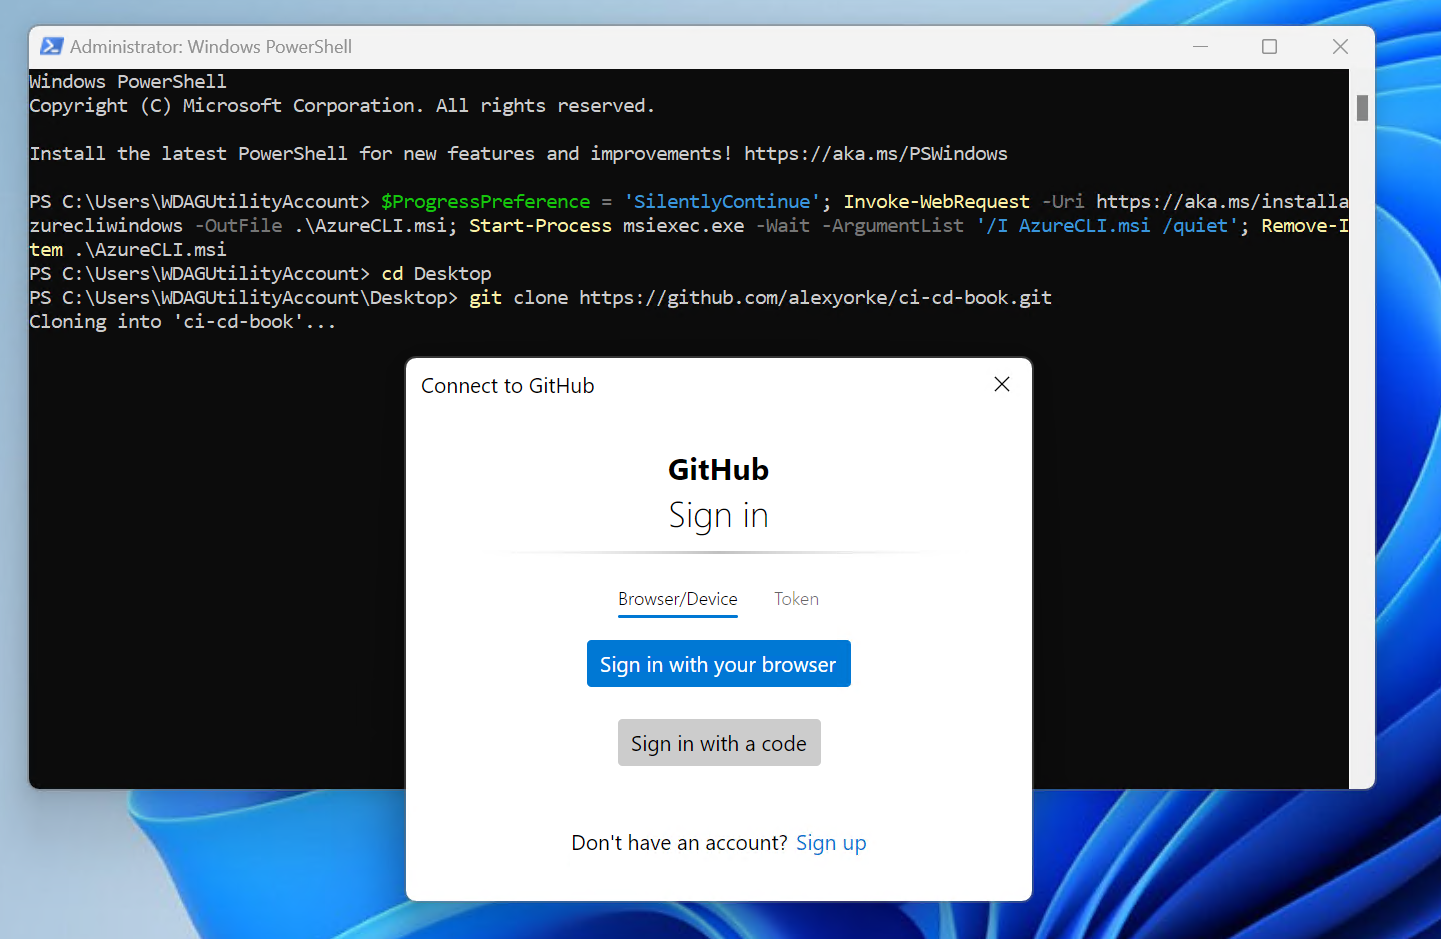
First, ensure that you have cloned your GitHub repository to your local machine. Haven't made a repository yet? Then create one by creating a GitHub account and then creating a new repository, then cloning it locally.
Once you have the repository locally, create and switch to a new branch. You could name this branch something indicative of its purpose, such as "initial-commit" or "first-commit." Here's how you can do this using Git commands:
git checkout -b initial-commit
This command creates a new branch named "initial-commit" and checks it out, so you can start adding your changes to this branch. Do all of the following commands within the repository.
Run the following commands in that repository.
Step 2: Create a New React Application
Make sure that you have at least NPM 10.8.0 installed. You can update it by typing npm install -g npm@10.8.0 or whatever the latest version is.
1. Use Create React App:
-
Open your terminal or command prompt.
-
Run the following command to create a new React application named
weather-app:
npx create-react-app weather-app
- This command sets up a new React project with all the necessary build configurations.
2. Navigate into your project directory:
- Change into the newly created project directory with
cd weather-app.
Step 3: Run the React Application
- Inside the project directory, start the development server by running:
npm start
- This command runs the app in development mode. Open
http://localhost:3000to view it in the browser. The page will reload if you make edits.
Step 4: Integrate Weather Data
1. Choose a Weather API:
- For real-time weather data, you can use APIs like [OpenWeatherMap](https://openweathermap.org/) or [WeatherAPI](https://www.weatherapi.com/). You will need to sign up and obtain an API key.
2. Install Axios:
- While you can use the native
fetchAPI, Axios makes it easier to perform API requests. Install Axios by running:
npm install axios
We need to access a weather API, but we're faced with a challenge regarding how to securely handle the API key. Storing the key directly in our code is not an option as it poses a security risk. If the key were to be leaked, it would be difficult to track and audit its usage.
To manage this securely for now, we will store the API key locally in a file named .env.local, which contains environment-specific data. Our React application will be configured to read from this .env file, allowing it to make calls to the API endpoint locally during development.
Later, we will explore solutions for safely using the API key in a production environment, ensuring it remains secure while accessible to the application.
Aside
Understanding the Build Process:
-
Compiled Files: The files in the
distfolder are the result of the compilation process. For example, if you're using a framework like React, thenpm run buildcommand transforms React code into plain JavaScript. This is necessary because browsers cannot interpret React code directly; they only understand JavaScript. -
Deployment Preparation: The
distfolder contains the compiled version of your application, which is what you will deploy. This folder holds all the static files required to run your application on any standard web server.
Why Compilation Matters:
The compilation step is crucial because it translates code from development frameworks (like React) into a format that can be executed by a web browser, typically JavaScript, HTML, and CSS. This process ensures compatibility across different environments and optimizes performance for production.
Aside end
First create a .env.local file in the weather-app folder.
Replace the content of the dot env file with this.
REACT_APP_WEATHER_API_KEY=your_actual_api_key_here
Then make sure to add the .env.local file to your .gitignore file. Do not commit the .env.local file.
3. Create a Component to Fetch Weather Data:
-
In the
srcfolder, create a new file calledWeather.js. -
Use Axios to fetch weather data from your chosen API and display it. Here's a simple example using OpenWeatherMap:
import React, { useState, useEffect } from 'react';

import axios from 'axios';

function Weather() {

const [weather, setWeather] = useState(null);

useEffect(() => {

const fetchWeather = async () => {

try {

const apiKey = process.env.REACT_APP_WEATHER_API_KEY;

const response = await axios.get(`http://api.openweathermap.org/data/2.5/weather?q=London&appid=${apiKey}`);

setWeather(response.data);

} catch (error) {

console.error("Error fetching weather", error);

}

};

fetchWeather();

}, []);

return (

<div>

{weather ? (

<div>

<h1>{weather.name}</h1>

<p>Temperature: {weather.main.temp}°C</p>

<p>Condition: {weather.weather[0].description}</p>

</div>

) : (

<p>Loading weather\...</p>

)}

</div>

);

}

export default Weather;
Corrected example (rendering-safe):
import React, { useState, useEffect } from 'react';
import axios from 'axios';

function Weather() {
  const [weather, setWeather] = useState(null);

  useEffect(() => {
    const fetchWeather = async () => {
      try {
        const apiKey = process.env.REACT_APP_WEATHER_API_KEY;
        const response = await axios.get(
          `http://api.openweathermap.org/data/2.5/weather?q=London&appid=${apiKey}`
        );
        setWeather(response.data);
      } catch (error) {
        console.error('Error fetching weather', error);
      }
    };

    fetchWeather();
  }, []);

  return (
    <div>
      {weather ? (
        <div>
          <h1>{weather.name}</h1>
          <p>Temperature: {weather.main.temp}°C</p>
          <p>Condition: {weather.weather[0].description}</p>
        </div>
      ) : (
        <p>Loading weather...</p>
      )}
    </div>
  );
}

export default Weather;
Step 5: Include the Weather Component in Your App
-
Open
src/App.js. -
Import and use your
Weathercomponent:
import React from 'react';

import Weather from './Weather';

function App() {

return (

<div className="App">

<header className="App-header">

<h1>Weather App</h1>

<Weather />

</header>

</div>

);

}

export default App;
You will then have to restart the application to pick up the changes in the .env.local file.
To test your application locally, begin by running the following commands in your terminal:
1. Build the Application:
npm run build
This command compiles your application and outputs the build files to the dist folder. Inside, you'll find several new files, including an index.html file, potentially some CSS files, and JavaScript files.
2. Start the Application:
npm run start
When you run the application, you should see that the API key has been successfully injected into the URL. In my case, since I didn't add my API key yet, there is an error.
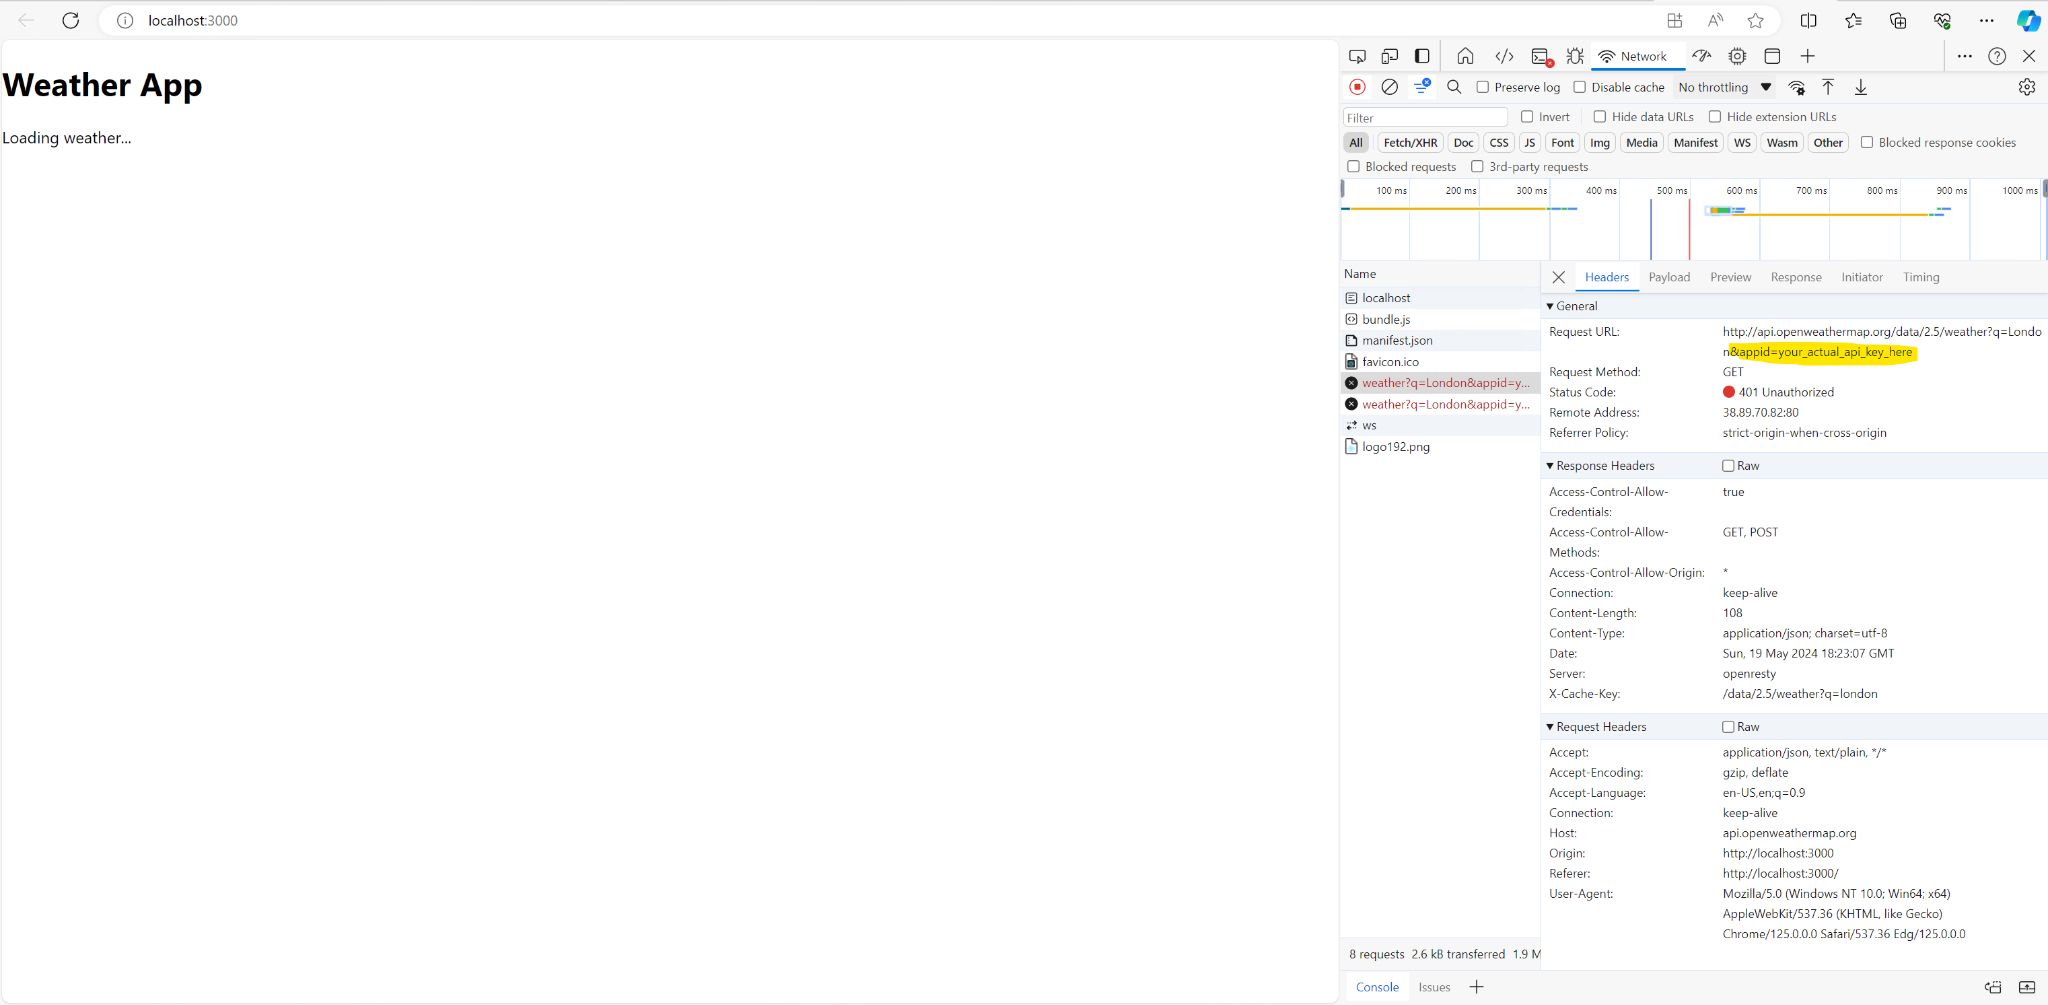
Using the API key in production as we currently do is not ideal because it is exposed to the public. This exposure will lead to unauthorized use, resulting in significant charges or DDoS attack, meaning that our API quota will be exceeded. Fortunately, we're currently using a free version of the API, which limits the financial risk but not the operational risk; excessive fake requests could still deny legitimate users access.
Aside
Important Security Note Regarding GitHub:
When you commit an API key to a public GitHub repository, GitHub's secret scanning tool detects and invalidates exposed API keys for about 30 to 40 different providers within minutes. However, this window is sufficient for attackers to compromise your key before it's invalidated, leading to potential security breaches and loss of provider trust. It's crucial to never commit API keys to public repositories to avoid these risks. For more details on GitHub's secret scanning and best practices, you can refer to GitHub's documentation on secret scanning About secret scanning - GitHub Docs
End aside
To securely store and manage these API keys, you can utilize Azure Key Vault. By integrating Azure Key Vault, you can inject API keys at runtime through custom endpoints, ensuring secure key management.
If you have an existing API consider using the Azure API Management Service. This service acts as a wrapper for existing APIs, adding valuable features such as authentication, rate limiting, quota management, and URL rewriting. In particular, we will leverage the URL rewriting capability to automatically append the API key and secret from the Key Vault to requests on our backend. This will hide the API key from the public URL and prevent it from being mis-used. Note that an attacker could still call our API multiple times to initiate a DDoS on our API Key, but we will get into rate limiting later.
Here's how to set this up using Azure API Management Service:
1. Create a New API Management Service: Begin by creating a new resource group, for instance, named 'CI-CD-Book-int' in the East US region. Name the resource as desired, such as 'My API Management Service', and fill in the organization name and administrative email according to your requirements. Choose the 'Developer' pricing tier.
2. Manage Identity: In the 'Manage Identity' tab, enable the system-assigned managed identity to allow your API Management Service access to the Azure Key Vault. This setup requires configuring Azure Role-Based Access Control (RBAC) rules to establish the necessary permissions.
3. Installation: Once all settings are configured, proceed to the 'Review + Install' tab and initiate the creation of your API Management Service.
5. Configure API and Testing: In the API Management Service:
-
Go to 'APIs' and create a new HTTP API, such as a 'Get Weather'.
-
The endpoint is just "/".
-
Initially, use
https://httpbin.orgfor testing to ensure the setup is correct. -
Select "Test" tab and then "Send". You should get a 200 OK response containing the content of the httpbin website homepage.
6. Key Injection and Endpoint Configuration: Adjust the backend settings to append the API key to incoming requests:
- Modify the service URL to
http://httpbin.org/anythingand save the changes.
In the below example, use the pretend API key listed below. This is because we are just testing our endpoint with a public server and we don't want to leak our actual API key.
Add the following policy to the inbound request:
<!--

- Policies are applied in the order they appear.

- Position <base/> inside a section to inherit policies from the outer scope.

- Comments within policies are not preserved.

-->

<!-- Add policies as children to the <inbound>, <outbound>, <backend>, and <on-error> elements -->

<policies>

<!-- Throttle, authorize, validate, cache, or transform the requests -->

<inbound>

<base />

<set-backend-service base-url="https://httpbin.org/anything" />

<set-query-parameter name="api-key" exists-action="override">

<value>12345678901</value>

</set-query-parameter>

</inbound>

<!-- Control if and how the requests are forwarded to services -->

<backend>

<base />

</backend>

<!-- Customize the responses -->

<outbound>

<base />

</outbound>

<!-- Handle exceptions and customize error responses -->

<on-error>

<base />

</on-error>

</policies>
At select save, then go back to the Test tab and then we run the request. You should get the following response or something very similar to it.
This is the expected response:
{
"args": {
"api-key": "12345678901"
},
"data": "",
"files": {},
"form": {},
"headers": {
"Accept": "*/*",
"Accept-Encoding": "gzip,deflate,br,zstd",
"Accept-Language": "en-US,en;q=0.9,en-CA;q=0.8",
"Cache-Control": "no-cache, no-store",
"Host": "httpbin.org",
"Ocp-Apim-Subscription-Key": "986369bd5e1943aaac81cd4e87bde4f0",
"Referer": "https://apimanagement.hosting.portal.azure.net/",
"Sec-Ch-Ua": ""Microsoft Edge";v="125","Chromium";v="125","Not.A/Brand";v="24"",
"Sec-Ch-Ua-Mobile": "?0",
"Sec-Ch-Ua-Platform": ""Windows"",
"Sec-Fetch-Dest": "empty",
"Sec-Fetch-Mode": "cors",
"Sec-Fetch-Site": "cross-site",
"X-Amzn-Trace-Id": "Root=1-66497521-4a028b2a52bd9d212f00e4db"
},
"json": null,
"method": "GET",
"origin": "154.5.165.200,13.91.254.72, 51.8.19.165",
"url": "https://httpbin.org/anything?api-key=12345678901"
}
To ensure proper setup, start by creating a new Azure Key Vault and add a fake API key initially. This approach helps verify system functionality without exposing your real API key, especially since HttpBin is not secure for testing on a public website. Once you confirm that the system works as expected with the fake key, replace it with the actual API key. Additionally, update the endpoint to point to the actual weather API. Finally, conduct an end-to-end test by sending a sample request to see if everything is functioning correctly.
Here's how to do that.
Setting Up a New Azure Key Vault
1. Create the Key Vault:
-
Navigate back to your resource group, specifically the CI-CD-Book-int one.
-
Click on "Create New Azure Resource", search for "Key Vault", and select it.
-
Name your Key Vault as "CI_CD_Book_KV" and leave the default settings intact.
-
Proceed to create the vault by clicking on "View and Create", then "Create".
2. Configure Access Permissions:
-
After creation, go to "Access Control (IAM)" on the left-hand side of the Key Vault.
-
Click "Add Role Assignment", search for "Key Vault Administrator", and add yourself by selecting your user profile.
-
Review and confirm the role assignment.
3. Manage Secrets:
-
Once access is granted, navigate to the "Secrets" tab within the Key Vault.
-
Click on "Generate or Import" to create a new secret. For instance, name it "weather-API-key" and set its value to "5934672295", then create the secret.
Integrating Key Vault with API Management Service
1. Link the Key Vault to API Management:
-
In your API Management Service, locate the "Named Values" option under the subscriptions section.
-
Add a new named value titled "weather-api-key" with the type set to "Key Vault".
-
Select the "CICD Key Vault" and link the "weather-API-key" as the secret.
-
Set the identity as the system assigned managed identity and save your changes.
-
Confirm when prompted about adding the Key Vault secret User role to the IAM of this KV.
2. Update API Policy:
-
Navigate to "APIs", select the "Weather API", and go to "Get Weather".
-
Edit the policy using the policy editor. Insert the named value by typing "{{weather-api-key}}" into the appropriate field to dynamically insert the API key into API requests.
-
Save your changes.
Now, update the policy to the following:
<!--

- Policies are applied in the order they appear.

- Position <base/> inside a section to inherit policies from the outer scope.

- Comments within policies are not preserved.

-->

<!-- Add policies as children to the <inbound>, <outbound>, <backend>, and <on-error> elements -->

<policies>

<!-- Throttle, authorize, validate, cache, or transform the requests -->

<inbound>

<base />

<set-backend-service base-url="https://httpbin.org/anything" />

<set-query-parameter name="api-key" exists-action="override">

<value>{{weather-api-key}}</value>

</set-query-parameter>

</inbound>

<!-- Control if and how the requests are forwarded to services -->

<backend>

<base />

</backend>

<!-- Customize the responses -->

<outbound>

<base />

</outbound>

<!-- Handle exceptions and customize error responses -->

<on-error>

<base />

</on-error>

</policies>
Now, you can use your base URI instead of calling the API directly. In my case, this is mine: https://my-api-management-service.azure-api.net. In the React code, replace the call to the weather API endpoint with this URL.
You should be able to send a sample request to our API in the API Management service and you should be able to get a response back from the weather application.
After you've verified that everything is working, commit all changes and push to your branch.
If you're using a different cloud provider and don't have an API management service you can develop a custom application using C# or any other programming language of your choice. This application would consume the Key Vault at runtime through a managed identity. This method grants you greater control over the response processing and other aspects of API interaction because you are directly manipulating the code.
Tests
We are going to refactor the code a bit more to make it more modular. While it is possible to say that we are making it more testable, testing isn't a means to an end. Currently, the weather is loaded via useEffect. This is not very modular and couples the act of retrieving the weather with how it is rendered. If you want to change a single thing about the weather, then you have to change how it is displayed. This makes it difficult for multiple people to work on the application, as well as with feature flags because it is coupled to how it is displayed.
Let's do a small refactor and see how we can write some tests.
To write effective tests for the Weather component and to make the application more testable, we need to structure our code in a way that is easier to isolate and verify individual parts. Here are some improvements and test examples for the component:
Improving Code Structure for Testing
-
Decouple Data Fetching from Component Rendering: Extract the logic that fetches data from the API into a separate function or custom hook. This separation makes it easier to test the fetching logic independently from the component's rendering logic.
-
Use Environment Variables Judiciously: Ensure environment variables are used properly and securely, especially when building and testing. For production builds, consider server-side fetching or secure client-side API key handling mechanisms.
-
Error Handling: Add more robust error handling and loading state management to improve user experience and make testing these states easier.
Refactored Component Code
Here's an example of how you could refactor the Weather component to make it more testable:
import React, { useState, useEffect } from "react";
import axios from "axios";

// Data fetching logic extracted to a custom hook
function useWeather(apiKey) {
  const [weather, setWeather] = useState(null);
  const [loading, setLoading] = useState(true);
  const [error, setError] = useState(null);

  useEffect(() => {
    async function fetchWeather() {
      try {
        const response = await axios.get(
          `http://api.openweathermap.org/data/2.5/weather?q=London&appid=${apiKey}`
        );
        setWeather(response.data);
        setLoading(false);
      } catch (error) {
        setError(error);
        setLoading(false);
      }
    }

    fetchWeather();
  }, [apiKey]);

  return { weather, loading, error };
}

function Weather() {
  const apiKey = process.env.REACT_APP_WEATHER_API_KEY;
  const { weather, loading, error } = useWeather(apiKey);

  if (loading) return <p>Loading weather...</p>;
  if (error) return <p>Error fetching weather</p>;

  return (
    <div>
      <h1>{weather.name}</h1>
      <p>Temperature: {weather.main.temp}°C</p>
      <p>Condition: {weather.weather[0].description}</p>
    </div>
  );
}

export default Weather;
Writing Tests
Here are some test examples using Jest and React Testing Library:
import { render, screen, waitFor } from "@testing-library/react";
import axios from "axios";
import Weather from "./Weather";

jest.mock("axios");

describe("Weather Component", () => {
  test("renders weather data successfully", async () => {
    const mockWeatherData = {
      data: {
        name: "London",
        main: { temp: 15 },
        weather: [{ description: "Cloudy" }],
      },
    };

    axios.get.mockResolvedValue(mockWeatherData);

    render(<Weather />);

    await waitFor(() => expect(screen.getByText("London")).toBeInTheDocument());
    expect(screen.getByText("Temperature: 15°C")).toBeInTheDocument();
    expect(screen.getByText("Condition: Cloudy")).toBeInTheDocument();
  });

  test("shows loading initially", () => {
    render(<Weather />);
    expect(screen.getByText("Loading weather...")).toBeInTheDocument();
  });

  test("handles errors in fetching weather", async () => {
    axios.get.mockRejectedValue(new Error("Failed to fetch"));
    render(<Weather />);
    await waitFor(() =>
      expect(screen.getByText("Error fetching weather")).toBeInTheDocument()
    );
  });
});
Additional Considerations
- For production, consider implementing a backend service to handle API requests. This service can secure your API keys and manage the data before sending it to the frontend.
- Implement continuous integration (CI) to run these tests automatically when changes are made to the codebase.
If you were to run npm run test locally, you should see that all tests pass.
Now that we verified our changes locally, we can now set up the pipeline to see if those changes can be verified with a pipeline instead.
Making the Pipeline Build and Test Our Code
The current pipeline merely prints "hello world" and does not inspire confidence in the build artifacts. Let’s update it to perform meaningful tasks like installing dependencies, building, and testing the project. Edit your main YAML file with the following content:
name: Build client app
on: workflow_dispatch: pull_request: types: [opened] push: branches:
- main # Triggers on pushes to the main branch. With workflow_dispatch, you can also run it manually.
jobs: build-and-deploy: # A single job to run everything for now. runs-on: ubuntu-latest
steps:
-
uses: actions/checkout@v2 # Clones the repository.
-
name: Set up Node.js uses: actions/setup-node@v2 # Installs Node.js. with: node-version: "14" # Specify your Node.js version.
-
name: Install dependencies run: npm ci
-
name: Build the project run: npm run build
-
name: Test the project run: npm run test
-
name: Upload artifacts uses: actions/upload-artifact@master with: name: my-artifact path: path/to/artifact
Workflow Steps Explanation:
-
Checkout Step: Uses
actions/checkout@v2to clone your repository and set the working directory. -
Node Version Setup: Sets up Node.js (version 14) for your build environment.
-
Dependency Installation: Installs project dependencies with
npm ci. -
Build and Test: Runs the build and test commands (
npm run buildandnpm run test). -
Artifact Upload: Uses
actions/upload-artifactto preserve build artifacts (since the runner is ephemeral).
After updating, push the commit to your branch and create a pull request. The build will run, and you won’t be allowed to merge until the pipeline completes successfully.
Additional Considerations
Artifacts:
In the current setup, the build server is wiped clean after each run, which means build artifacts are lost unless explicitly saved. Use the actions/upload-artifact action to preserve these artifacts for later deployment or verification.
Note on Non-Compiled Projects: Some projects (e.g., Python applications) might not generate traditional output files. In such cases, the source code itself (minus configuration files) may be considered the artifact.
Security Note:
When using actions from the GitHub Marketplace (e.g., actions/checkout@v2), be aware that version tags like "V2" are mutable. To reduce risk:
- Minimize reliance on public actions.
- Reference actions by specific commit hashes rather than mutable tags.
Accessing Artifacts Manually
To download artifacts from a GitHub repository:
- Navigate to Your Repository: Log into GitHub and open your repository.
- Access Actions: Click the "Actions" tab to view workflow runs.
- Select a Workflow Run: Click on the desired run.
- Find Artifacts: Scroll to the "Artifacts" section at the bottom of the page.
- Download Artifacts: Click the artifact name to download a ZIP file containing the artifacts.
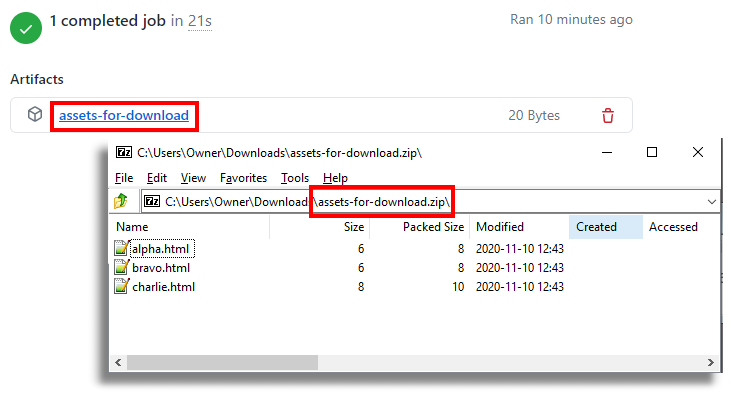
Deployment and Release Strategies
Deployment involves transferring build artifacts from the artifact repository to a customer-accessible server. In our workflow, after uploading the app artifacts, we can create a deployment pipeline. Note that deployment does not necessarily mean immediate customer visibility—a feature may be hidden behind feature flags.
Key Points:
-
Stable Artifacts: Once created, do not rebuild artifacts. Rebuilding undermines confidence in the CI pipeline.
-
Infrastructure as Code (IaC): Consider using tools like Azure Bicep templates for managing infrastructure. This approach is more manageable and scalable than manual portal setups.
Deployment Options
-
Static Websites: For simple sites (HTML, CSS, JavaScript), using an Azure Storage Account and a Content Delivery Network (CDN) can be cost-effective and scalable.
-
Server-Side Applications: For applications that require backend processing, consider Docker containers or other server infrastructures.
Setting Up Deployment with Azure
Below are the initial steps to deploy a static website using an Azure Storage Account and a CDN.
Step 1: Install Azure CLI
Ensure that the Azure CLI is installed on your computer.
Step 2: Log in to Azure
Open your terminal or command prompt and run:
az login
Follow the on-screen instructions to log in to your Azure account.
Step 3: Create a Storage Account
-
Navigate to Storage Accounts: In the Azure portal, click on "Create a resource" and search for "Storage Account".
-
Set Up Basic Details:
-
Choose a subscription and select the existing resource group.
-
Enter a unique name for your storage account.
-
Select a region close to your target audience to minimize latency.
-
Choose "Standard" performance, which is adequate for static content.
-
Select "StorageV2 (general purpose v2)" for the account type, as it supports static website hosting.
-
Review and Create: Review your settings and create the storage account.
Step 4: Enable Static Website Hosting
-
Configure Static Website:
-
After your storage account is created, go to its overview page.
-
Navigate to the "Static website" settings under the "Data management" section.
-
Enable static website hosting by selecting "Enabled".
-
Specify "index.html" as the index document name and "404.html" as the error document path.
Make sure to disable storage account key access.This is important because Georgia county keys can be used to access your BLOB container from almost anywhere with.A weak form of authentication. This is just essentially a password. We're gonna be using something instead called a managed identity or a Federated credential.
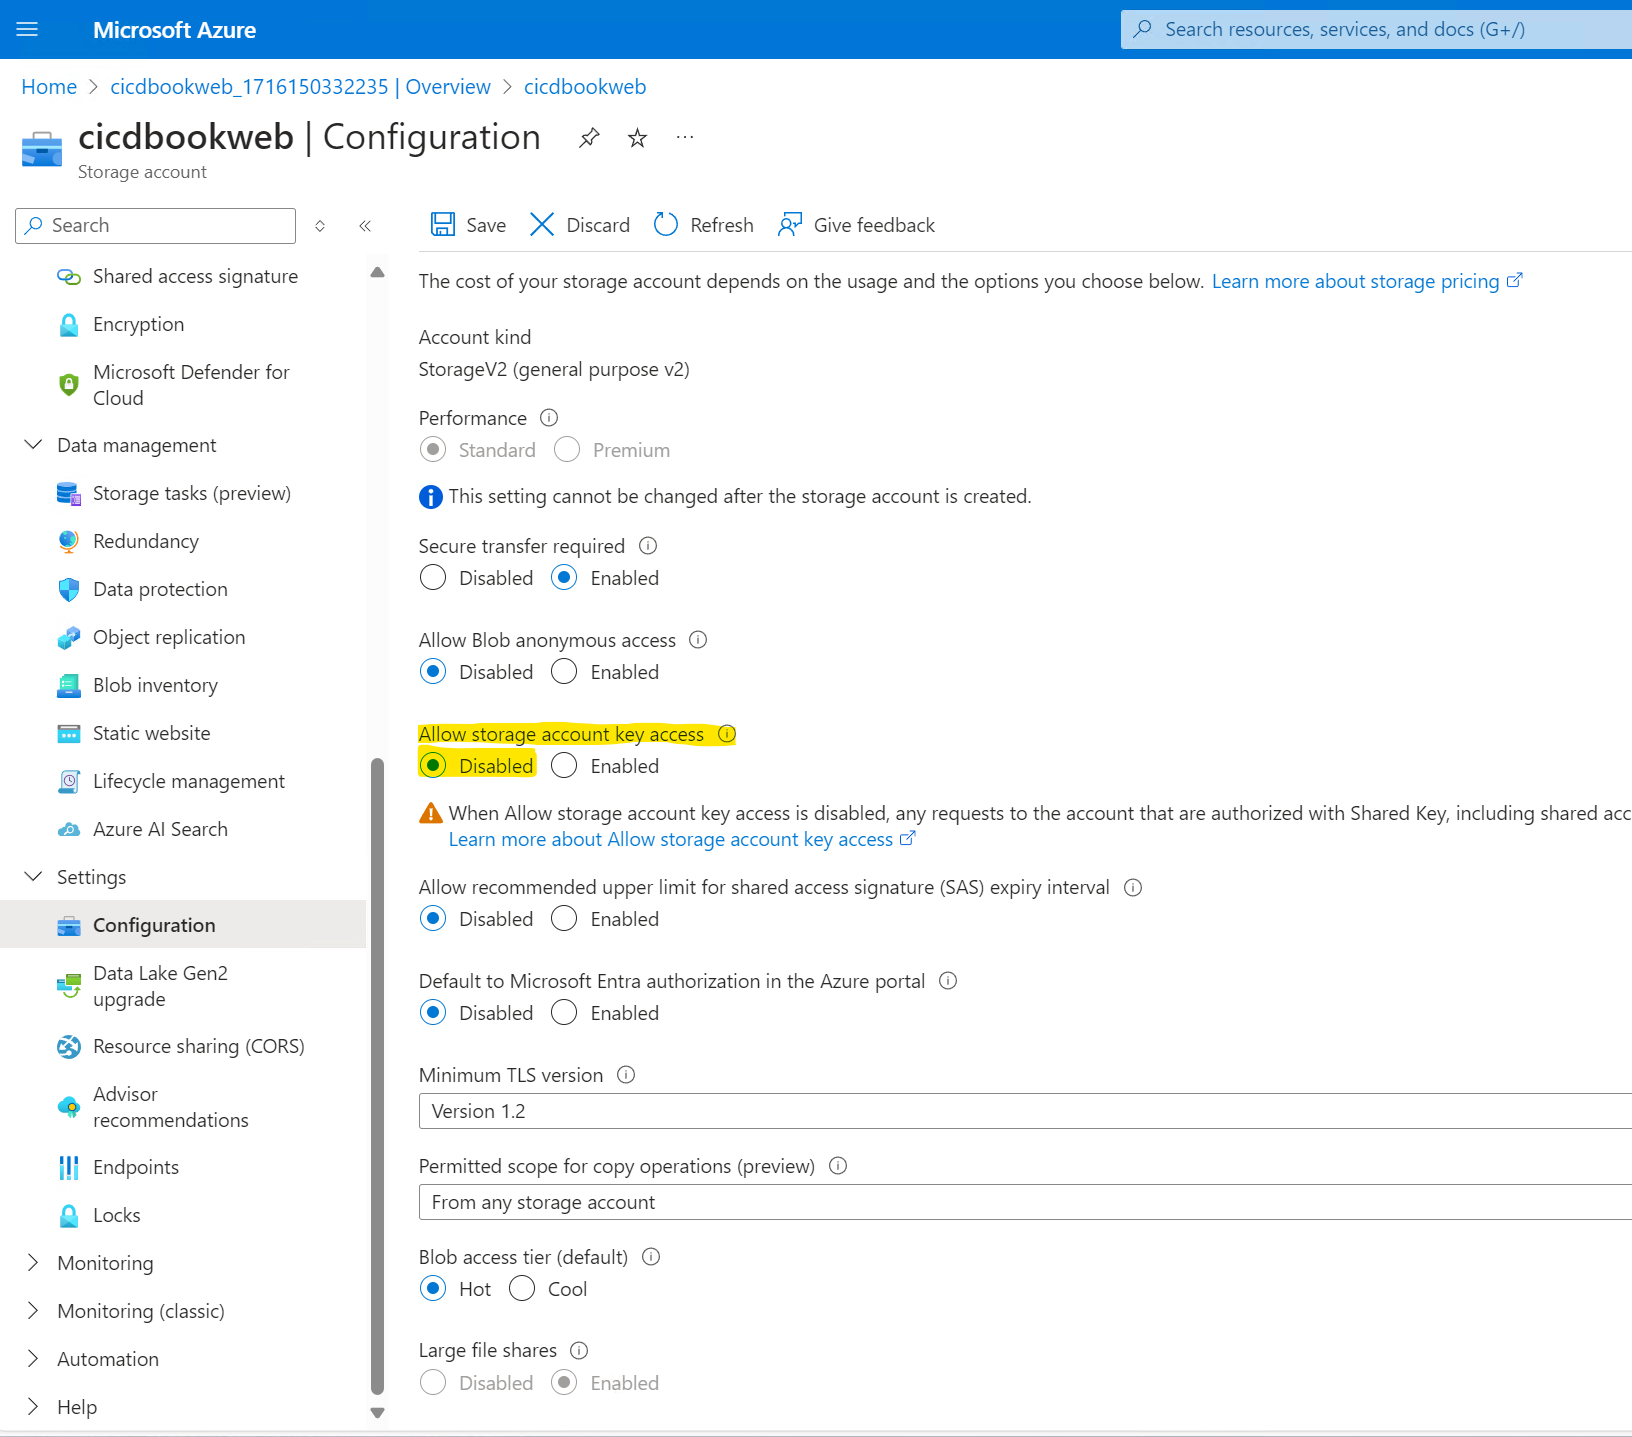
In the Storage account, navigate to either the Access Management tab or the Access Control (IAM) tab. Add yourself as a Storage Account Contributor and a Storage Blob Data Contributor at the storage account level.
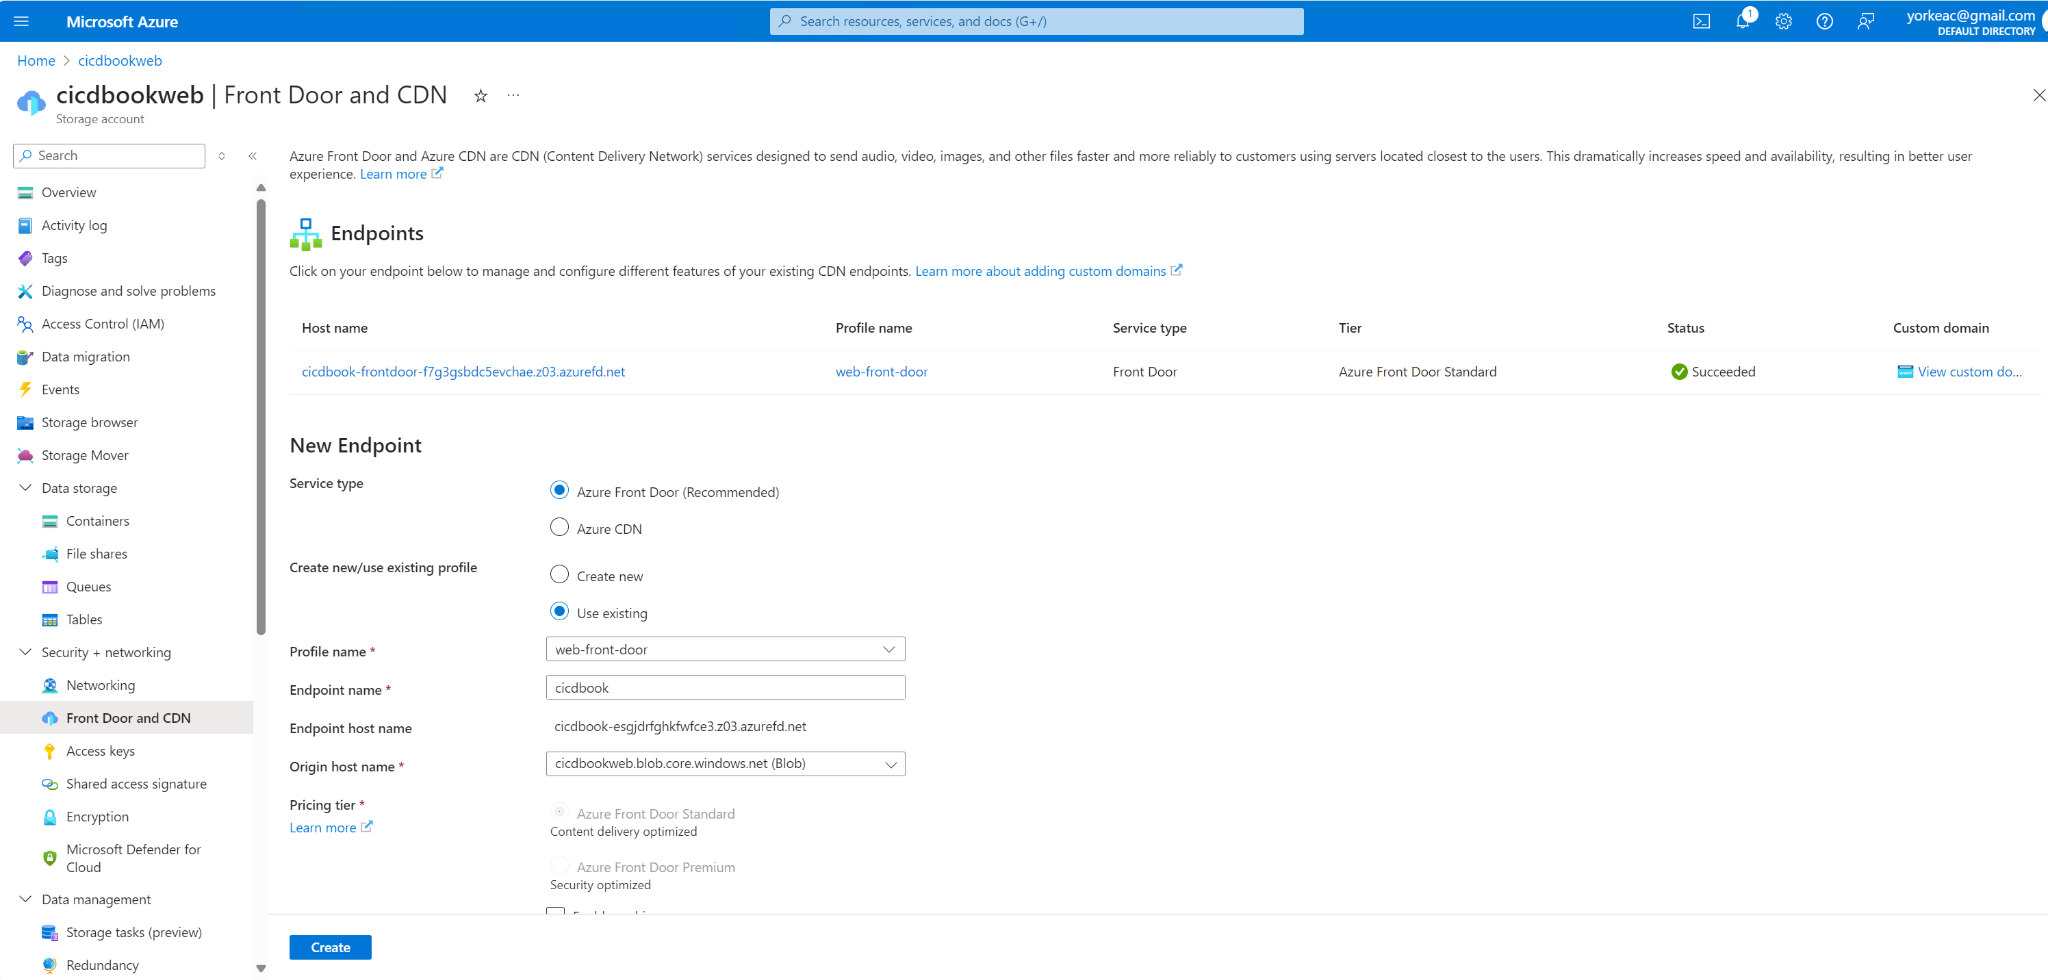
Sample HTML file with just some trivial contents, for example the text Hello world.
Example:
To upload an HTML file named index.html from your local machine to the '$web` container in your storage account, use:
az storage blob upload --account-name cicdbookweb --container-name '$web' --name index.html --file /local/path/to/index.html
Step 7: Verify Upload
Confirm that your file has been successfully uploaded to the blob container:
az storage blob list --container-name cicdbookweb --output table
Step 8: Set Up Azure CDN for Faster Content Delivery
-
Create a CDN Profile:
-
Go to the Azure portal, click on "Create a resource", find and select "CDN".
-
Choose or create a CDN profile and select a pricing tier (Standard Microsoft is recommended).To defaults and click.Next.
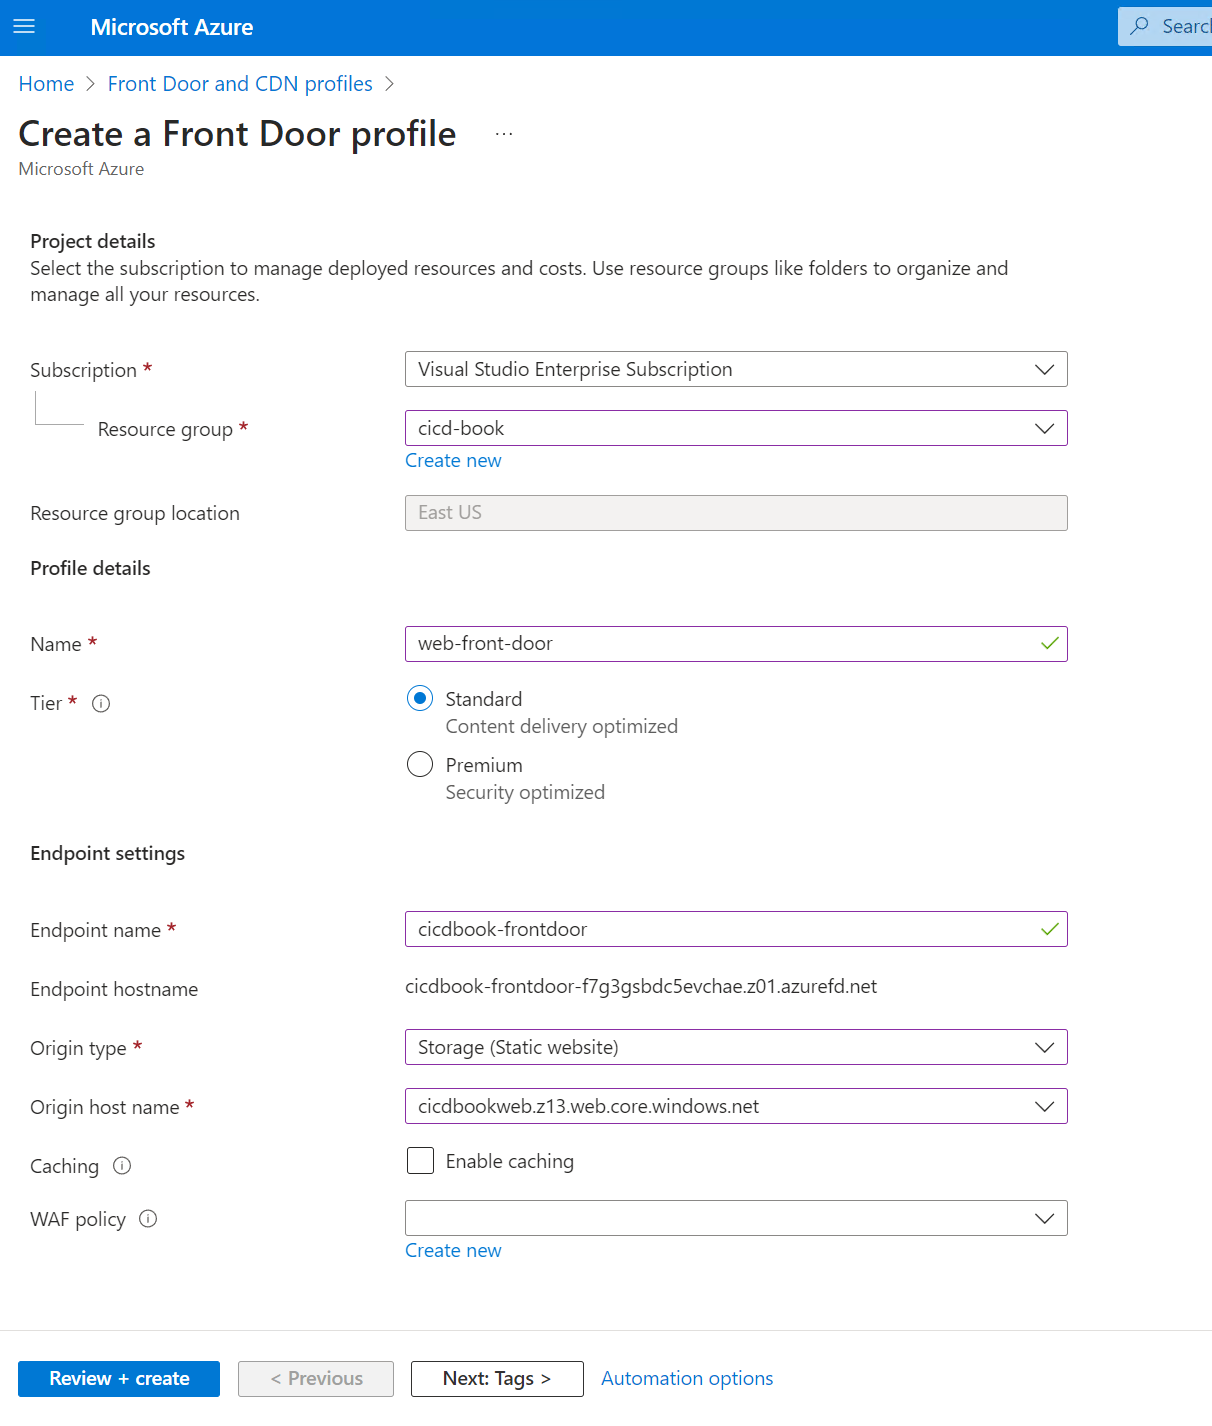
- Deployment: Note that it may take some time for the CDN to propagate globally.
Select review plus create.
Step 9: Access Your Deployed Site
-
Site URL:
-
Once the CDN is fully deployed, use the CDN endpoint URL to access your website, available in the CDN endpoint settings in the Azure portal.
-
If you have configured a custom domain, use that URL instead.
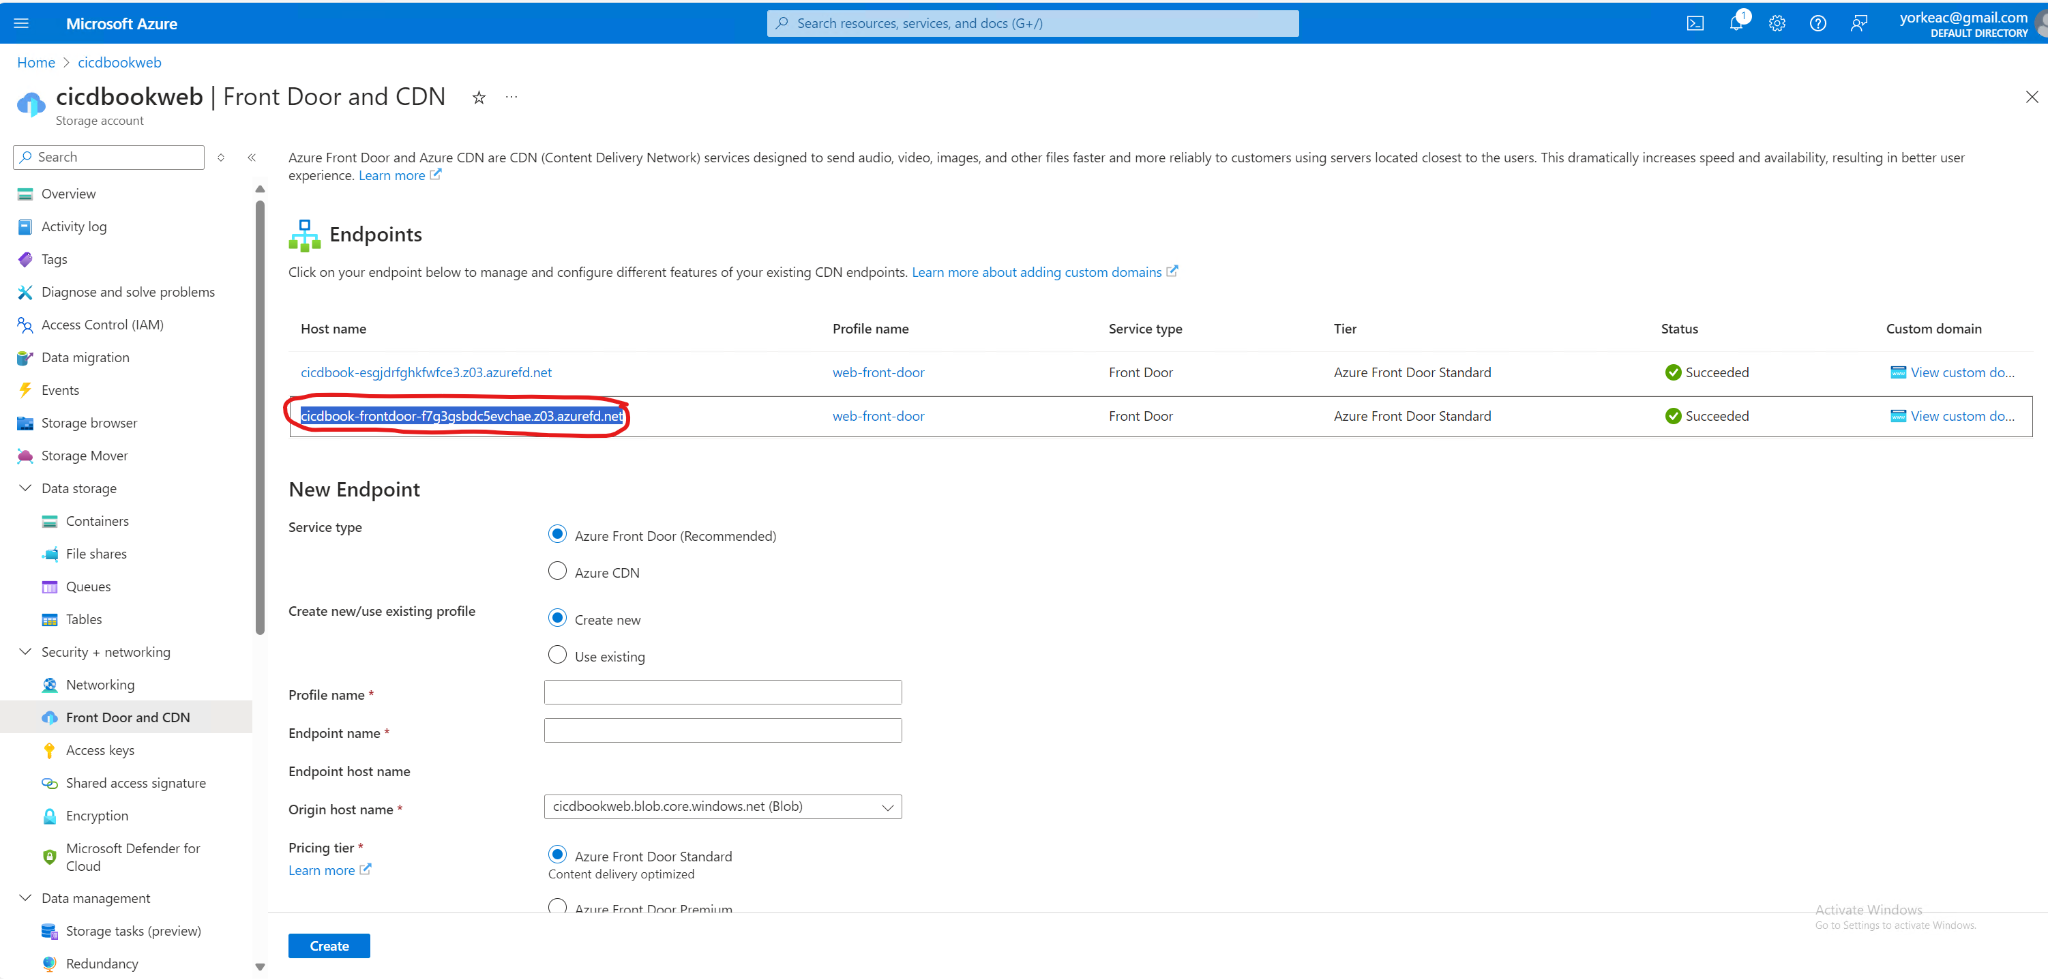
You navigate to the host and the previous screenshot that you should see your sample HTML file.

Create a new workflow at .github/workflows/deploy.yml and insert the following content:
- Add a GitHub Actions workflow file to handle deployment:
name: Deploy to Azure Storage
on:
push:
branches:
- main
jobs:
download-and-deploy:
runs-on: ubuntu-latest
steps:
- name: Checkout Repository
uses: actions/checkout@v2
- name: Download Artifacts
uses: actions/download-artifact@v2
with:
name: your-artifact-name # Specify your artifact name here
path: path/to/artifacts # Specify path to download the artifacts to
- name: Deploy to Azure Blob Storage
uses: Azure/azure-cli@v1.1.0 # Using official Azure CLI action for deployment
with:
inlineScript: |
az storage blob upload-batch -s path/to/artifacts -d $web --connection-string ${{ secrets.AZURE_STORAGE_CONNECTION_STRING }}
az storage blob sync -s path/to/artifacts -d $web --connection-string ${{ secrets.AZURE_STORAGE_CONNECTION_STRING }}
env:
AZURE_STORAGE_CONNECTION_STRING: ${{ secrets.AZURE_STORAGE_CONNECTION_STRING }}
-
Secure Your Workflow:
-
Store your Azure storage connection string in GitHub Secrets to keep it secure.
Now if you go to the URL corresponding to the Azure CDN, potentially after 5 or 6 minutes for the CDN refresh, you should see your React application along with the weather app.
This approach works fairly well for simple projects, but it can become complex when managing multiple workflows. Currently, we have two distinct workflows: one that automatically deploys when changes are pushed to the main branch, and another that runs on pull requests to ensure confidence in the artifacts. The challenge arises in tracking which version or application is in production due to these separate workflows. It becomes unclear, for instance, after a pull request is merged into the main branch, which environment the application is currently in or if it's ready for QA.
To address this, GitHub offers features like jobs and environments that help structure workflows more clearly. These tools enable you to track your application's progression through its entire lifecycle in a visible and organized manner. This is crucial when multiple team members are committing to pull requests, potentially creating chaos without a clear order. Implementing structured workflows ensures you can easily identify which version is being tested and what is moving to the next stage.
Jobs and environments
Before we explore GitHub workflows, it's essential to understand the basics like jobs and environments. These elements are critical for structuring effective workflows, especially as we deploy our weather application. A clear grasp of these elements ensures that the workflow accurately reflects the application's current stage---whether it's integration, pre-production, or production. This clarity is vital for tracking feature releases and maintaining transparency about the status of ongoing changes.
Let's start with jobs.
Jobs in workflows are crucial for managing transitions between different stages and incorporating manual approval processes. Each job operates as an independent unit within a workflow, running on its own virtual machine or container and consisting of multiple steps. This independence allows for clear demarcation points where manual approvals can be inserted, with the ability to pause for up to 30 days without any ongoing computation.
Now, what are environments?
Environments in GitHub Actions enhance the deployment process by grouping jobs into distinct stages. This grouping not only helps in managing the deployment process more effectively but also conserves resources by pausing the workflow between stages, providing a unified and controlled view of the deployment pipeline.
Environments are particularly useful in complex workflows where multiple stages are involved, such as moving from integration to pre-production and then to production, facilitating a seamless transition and effective management throughout the deployment process.
Aside start
Workflow Structure and Naming:
-
Use concise job names (ideally under 18 characters) for clear visibility in the GitHub interface.
-
Structure workflows strategically to maximize parallelism. For example, separate build and deploy stages can run concurrently.
Example Workflow:
- Our workflow employs two jobs: "build" and "deploy". "Build" handles tasks like software compilation, while "deploy" manages security scans and deployment. Artifacts from "build" are passed to "deploy," ensuring isolated environments.
Efficient Deployment Strategies:
-
Splitting workflows: Deploy to staging in one workflow, then trigger a separate workflow for production deployment after review.
-
Creating separate jobs for each task can introduce overhead and complicate environment variable management by requiring broader scoping, potentially increasing security risks. It also involves repeatedly uploading and downloading artifacts, adding complexity. Additionally, while jobs can be parallelized, this may not always align with your script's structure. Organizing a script into multiple jobs can obscure the workflow's overall structure, making it difficult to understand dependencies and parallelization opportunities.
-
Jobs allow for precise scoping of environments to specific tasks. For instance, if you have a production environment variable like a GitHub PAT, you can restrict its access to only the necessary steps. By assigning this variable to a particular job, such as deployment, you prevent unrelated jobs, like a "prepare cache" step that doesn't require production credentials, from accessing it. This ensures that production credentials are confined to the relevant job, enhancing security.
Aside end
Let's get this set up and show how you can use jobs and environments to create a pipeline to production, including manual approval stages.
jobs:
  build:
    runs-on: "ubuntu-latest"
    name: "Build" # this is optional
    steps:
      - name: "Checkout code"
        uses: "actions/checkout@v2"
      - name: "Install dependencies and build"
        run: |
          npm install
          npm run build

  test:
    runs-on: "ubuntu-latest"
    steps:
      - name: "Checkout code"
        uses: "actions/checkout@v2"
      - name: "Install dependencies and test"
        run: |
          npm install
          npm test
That workflow is displayed as follows.
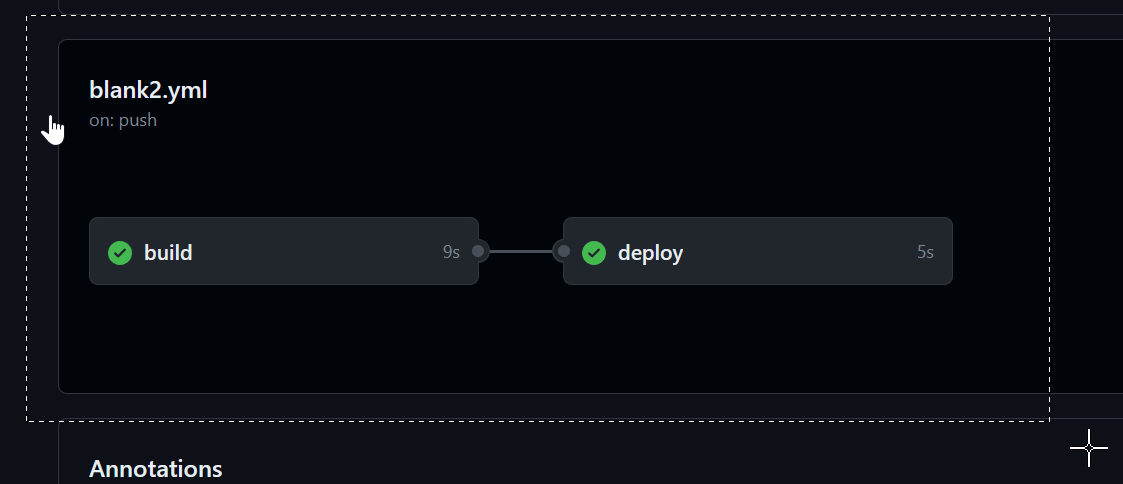
No steps in the "deploy" job start until the "build" job is complete. This is because the "deploy" job has a "needs" on the build job.
There are few reasons why this is helpful. First, it is very clear from a glance which job(s) have succeeded and which were not executed. For example, if the build step failed, then the deploy wouldn't have succeeded. You can click on build to see its logs, just for its steps. The other reason is it is clear of the status of the deployment, and where the build currently exists. So, for example, say you do a deployment, then everyone can see that it is in the staging phase, and has not yet been deployed to production yet.
If we make a bunch of jobs, and a bunch of dependencies (e.g., needs), then it will be getting a bit more complex. When we start to create more complex workflows, jobs will be a way to help group related tasks together, and to provide them with dependencies.
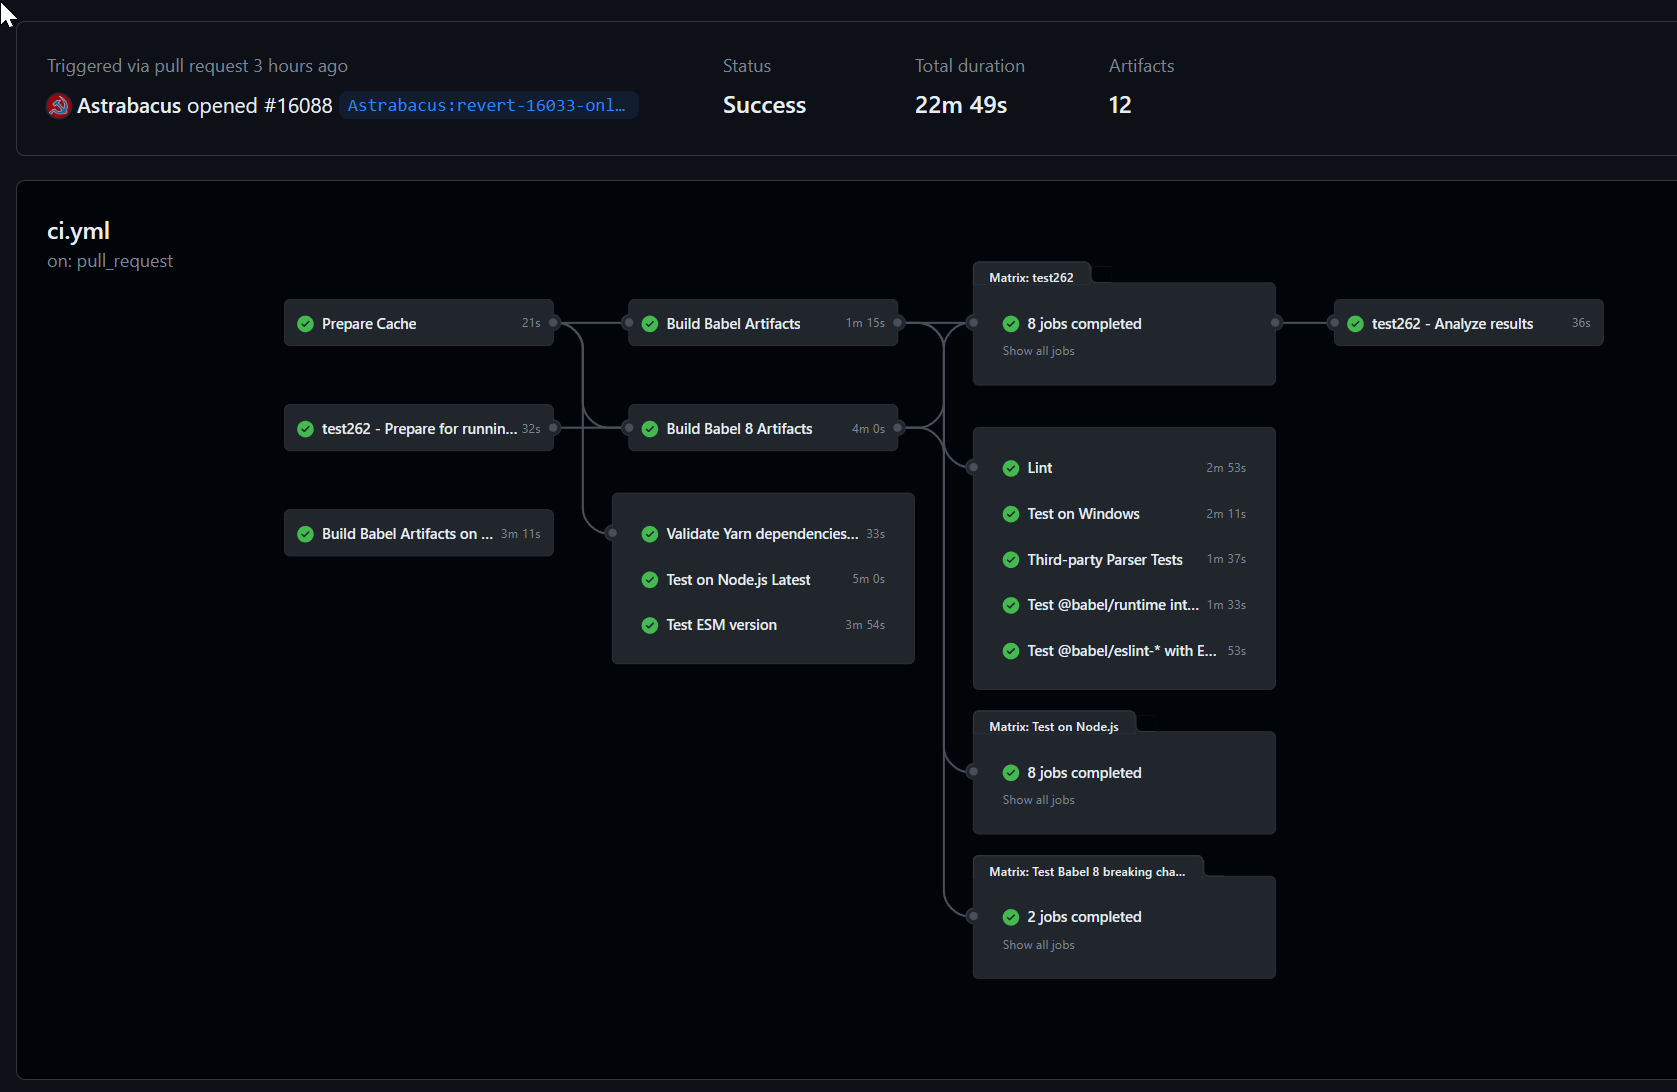
This workflow setup allows you to specify inputs and set the release type. For instance, if you wish to deploy commits from your main branch to the staging environment, you can manually input this, ensuring deployment stops at staging. Alternatively, you can deploy directly to production, though it will pass through each environment requiring manual approvals. You must configure these approvals and designate who has the authority to advance to the next step, such as requiring manager approval to move from staging to production.
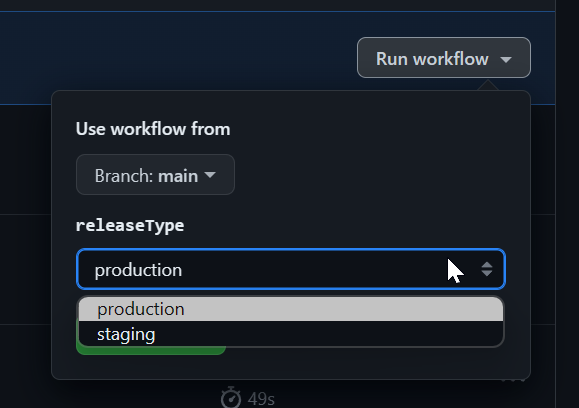
You can select which environment you'd like as well.
run-name: Pipeline run by @${{ github.actor }} looks very useful for tracking release progress
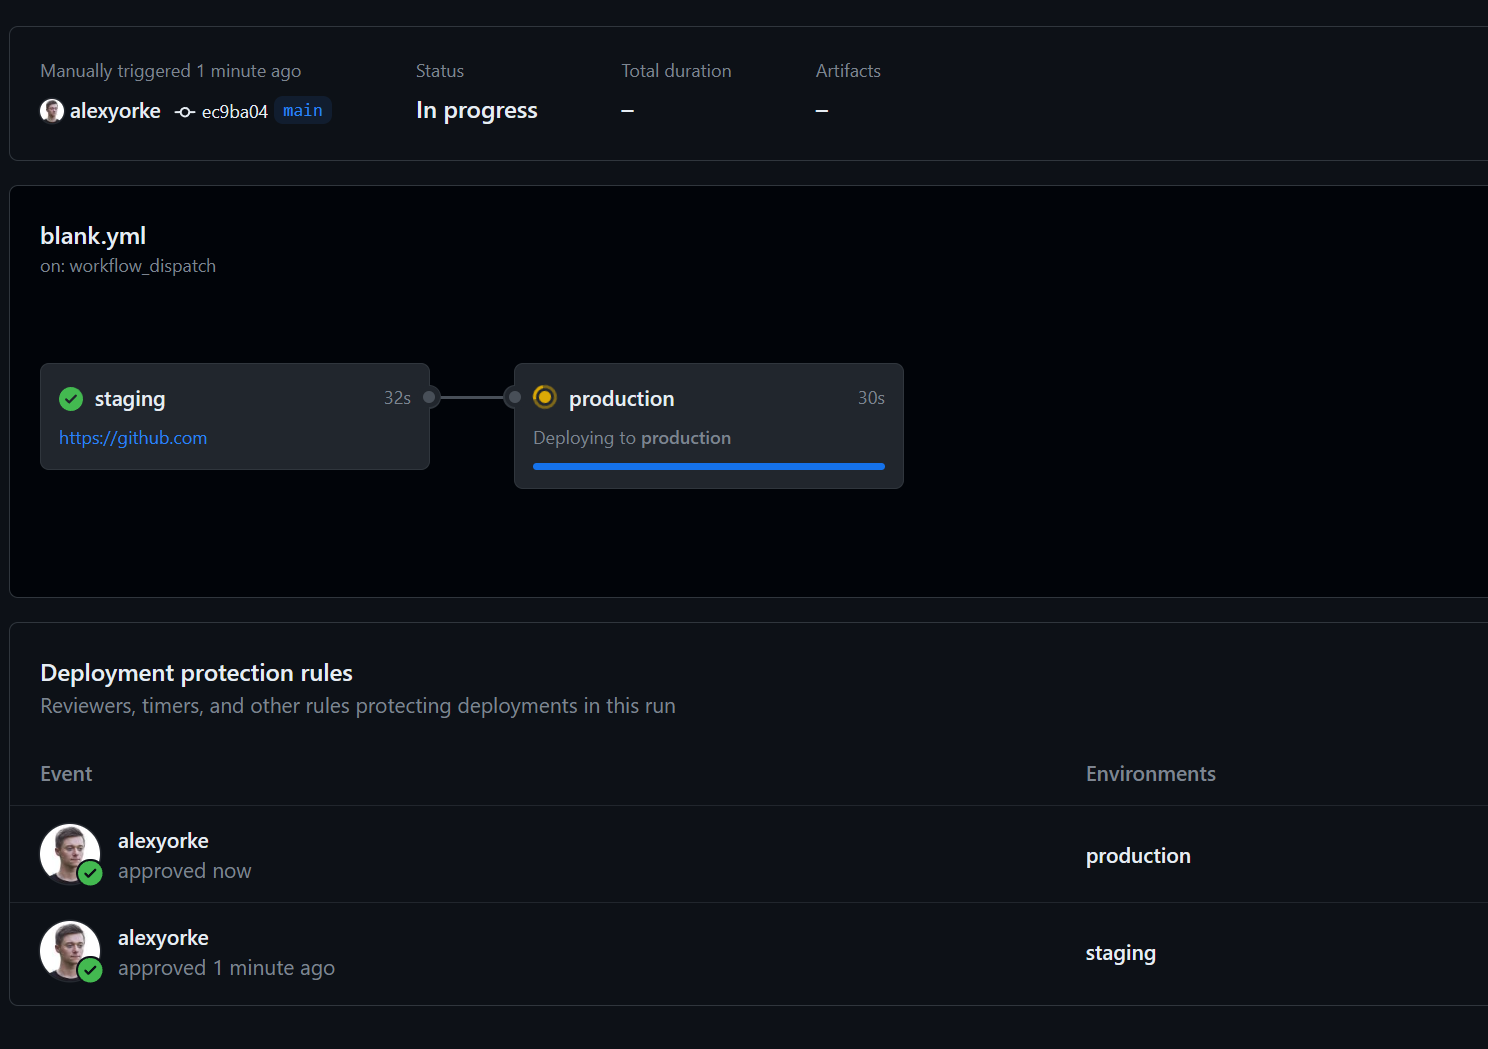
If you try to start another instance of this workflow while it is running, then it will queue up and not run concurrently. This is important because otherwise you might have two scripts trying to deploy to production at the same time, which would cause a race condition (bad.)
You might want something like this,
- name: Display Release Version
run: echo "Deploying Release Version $RELEASE_VERSION"
Which can indicate which release is currently being deployed and where they are at.
You need GitHub Enterprise to set up pre-deployment checks (i.e., getting someone to approve before the next stage continues.) Since you are only allowed to specify five people per approval, then you can use teams (e.g., create a QA team, and a developer team) which should only use up two slots, but allow for more people to theoretically approve.
A typical scenario is to get QA to approve before it moves to the next stage. Let's show how to set up this sample scenario.
Step 1: Define Environments in Your Repository
First, you need to set up environments in your GitHub repository where you can specify protection rules including manual approvals.
1. Navigate to Your Repository Settings:
- Open your GitHub repository, go to "Settings" > "Environments" (found in the sidebar under "Security").
2. Create a New Environment:
-
Click on "New environment".
-
Name your environment (e.g.,
staging,production). -
Click "Configure environment".
3. Set Up Protection Rules:
-
Under "Environment protection rules", you can add required reviewers who must approve deployments to this environment.
-
Add the GitHub usernames of the individuals or teams who should approve deployments. For example, you can add a "QA team" that consists of a few people, and tey either all hae to approve or a single person has to approve.
-
You can also specify other settings, such as wait timers or IP address restrictions if needed.
-
Click "Save protection rules".
Step 2: Update Your GitHub Actions Workflow
After setting up your environments with required approvals, you need to modify your GitHub Actions workflow to use these environments.
1. Edit Your Workflow File:
-
Go to your repository's
.github/workflowsdirectory. -
Open the YAML file for the workflow you want to add manual approvals to.
2. Add the Environment to Workflow Jobs:
- Identify the job(s) in your workflow that should require approval before they run. Add the
environmentkey to those jobs, specifying the name of the environment you configured.
Here's an example snippet:
jobs:

deploy:

runs-on: ubuntu-latest

environment:

name: production

url: ${{ steps.deploy.outputs.url }} \# Optional: This can show a URL in the GitHub deployment

steps:

- name: Checkout code

uses: actions/checkout@v2

- name: Setup Node

uses: actions/setup-node@v2

with:

node-version: '14'

- name: Install dependencies

run: npm install

- name: Build and Deploy

id: deploy

run: \|

npm run build

echo "::set-output name=url::http://example.com" \# Simulated deployment output
Step 3: Commit and Push Changes
After editing your workflow file:
-
Commit the changes: Provide a commit message that clearly states you've added environment protections with manual approvals.
-
Push the commit to your branch.
Step 4: Trigger the Workflow
Push or merge a commit that triggers the modified workflow. If the workflow accesses a job that uses the protected environment:
-
The job will pause, and GitHub will require the specified approvers to review and approve the run.
-
Go to the "Actions" tab of your repository to see the pending approval.
Step 5: Approve the Workflow
-
Authorized reviewers can go to the "Actions" tab, click on the workflow run, and then click "Review deployments".
-
They can then approve or reject the deployment.
Step 6: Monitor the Deployment
After approval, watch the workflow continue its execution. If you provided an output URL in the environment configuration, GitHub would link the deployment to this URL for easy access.
Creating releases and "checkpoints"
In application development, a "release" marks the deployment stage where features become accessible to customers. This concept is crucial for tracking project progress, customer engagement, feature usage, and security updates. Releases also allow reverting to previous versions, though upgrading is generally preferred.
Managing releases can be complex. Determining version numbers, categorizing changes (major/minor), and meticulously documenting updates across files, documentation, what might break external libraries and customers, what changed and how to interpret those changes, and dependencies can be challenging. Manual processes are prone to errors, like forgetting version updates. This might also involve publishing your package to various repositories, all of which have their own requirements and the metadata must be correct to ensure compatibility with the developers.
GitHub Actions simplifies release management by tagging commits, auto-generating changelogs, and even refining commit messages into cohesive release notes, all within the deployment pipeline. You have to use one of the scripts or GitHub Actions below to do these releases as they do not occur automatically. Pre-release designations help track updates before production deployment.
There are two main ways to do versioning. One way is called SemVer (semantic versioning) which consists of a major, minor, and build number. This is commonly used when developing APIs and libraries, as developers should be made aware of breaking changes.
The other way is an evergreen strategy, which involves using a continuous version, for example the git hash or the date. This is usually used for consumer facing applications, like Teams or Skype. There are some exceptions, for example, when considering a major redesign, you might use a major version (e.g., Teams v2.) When was the last time you thought about Chrome's version number? It sort of auto-updates using an ever-green version strategy.
There's many different actions and libraries that you can use to create versions. It's recommended to use a pre-built solution as managing version numbers and incrementing them can become complex quickly.
Interesting: Release Flow: How We Do Branching on the VSTS Team - Azure DevOps Blog (microsoft.com)
Here are just a few.
-
https://github.com/GitTools/GitVersion
-
https://github.com/conventional-changelog/standard-version
-
https://github.com/semantic-release/semantic-release
-
https://github.com/dotnet/Nerdbank.GitVersioning
-
https://github.com/adamralph/minver
-
https://github.com/conventional-changelog/conventional-changelog
-
https://github.com/googleapis/release-please
-
https://github.com/changesets/changesets
Chapter 4: The Crucial Role of Testing in CI/CD
Introduction: Why Test?
At its heart, software testing is about understanding the extent to which an application can reliably achieve a user's goals. It's a holistic interpretation, providing confidence not just that the code runs, but that it runs correctly and effectively for its intended purpose. However, it's crucial to remember that tests are only as good as the effort you put into them.
While often perceived primarily as a process for finding defects or bugs, testing is a broad discipline encompassing multiple facets of software development. These include quality, usability, performance, and more. Some aspects of testing fall into the category of "checking" – operations, often automated, that verify if specific, known conditions still hold true. Think of these as demonstrations: things we believe to be true, which a computer programmatically verifies.
It's an illusion to think software can be completely bug-free. Humans make mistakes, the libraries we rely on aren't perfect, and even hardware can fail. Therefore, the focus of testing isn't the impossible goal of eliminating all bugs. Instead, it's about ensuring the software works well enough to meet user needs and achieve business objectives, managing risk rather than pursuing theoretical perfection.
Testing often refers to the structured evaluation of software against predefined criteria, frequently using automated tests. When developers or teams claim they "don't test," they usually mean they lack a formal testing plan or extensive automation. In reality, even fundamental actions like compiling code or navigating a website after deployment are forms of testing. Any interaction with software, whether by developers during creation or by customers during use, inherently involves testing. If software is never used, and no one notices if it's broken, its value and relevance become highly questionable.
Think of testing like guardrails on a highway. They help ensure traffic stays on the intended path but cannot absolutely guarantee it. Too many rigid guardrails (overly specific or numerous tests) can make it difficult to change the path later – for instance, when refactoring code or adding new features. Conversely, too few guardrails (insufficient testing) make it hard to assess the impact of changes, especially in complex systems. Finding the right balance, knowing how "tight" to make your tests, is essential.
In the context of Continuous Integration and Continuous Deployment (CI/CD), automated testing provides a rapid feedback loop. Developers can quickly verify their changes without disrupting the entire system or requiring lengthy manual checks. Tests are typically run automatically before changes are integrated (e.g., on pull requests) and sometimes during the integration process itself. This ensures that tests remain reliable, as a failed test can, and often should, halt a deployment. This efficiency means developers catch errors swiftly, speeding up the overall development cycle, leading to higher-quality products for customers, and freeing up Quality Assurance (QA) professionals to focus on more complex, exploratory, and user-centric testing activities.
Going forward in this chapter, we will often discuss testing in two broad categories: automated testing and manual testing. This is, technically, a false dichotomy, as the lines can blur. However, this distinction is practical for CI/CD because automated tests can be executed by CI/CD runners and contribute directly to the automated pipeline, whereas manual testing requires human intervention. We will use these terms with this distinction in mind. Automated testing is a cornerstone of effective CI/CD, enabling the fast feedback loop that allows developers to confidently introduce changes with reduced risk.
It's also vital to understand that writing tests is not a one-time task. Tests must evolve alongside the application. As features change or are added, corresponding tests need to be created, updated, or sometimes removed. Tests are typically written concurrently with the feature code and should be included in the same pull request (PR) for review. Critically, tests should undergo the same level of scrutiny during code review as the feature code itself.
Testing becomes particularly crucial when a system grows too large or complex for a single developer to effectively reason about the full impact of their changes. There must be some level of testing for any feature; otherwise, there's no verifiable evidence that the feature works as intended, breaking the chain of integrity from requirement to deployment.
Tests, in essence, are designed to keep things working as expected – to maintain invariants. However, software development often involves constant evolution and change. This creates a natural tension: tests aim for stability, while development introduces change. Excessive or poorly designed tests can drag down development velocity. Therefore, a balance must be struck. It's impossible to test code 100%, nor would it be desirable, as it would imply testing for an infinite amount of time and scenarios. The goal is to write useful tests that provide real value. This involves knowing what to test – focusing on critical functionalities, areas prone to change, or aspects that might not evolve frequently but are vital. There's an inherent complexity in many systems that cannot simply be architected away; tests are a key tool for managing this complexity and the interdependencies between modules. Without them, developers would need to perform extensive manual checks or spend inordinate amounts of time tracing code paths – processes that are both time-consuming and highly error-prone.
What is Quality? [Concerning Quality]
Defining "quality" in software is challenging because it's inherently subjective. It's rooted in the alignment between perceived expectations and actual standards or outcomes. Because expectations and standards can shift depending on the context, user, or business need, quality is dynamic.
There's also a degree of ethics involved. Quality implies that a product is offered in good faith, meeting certain implicit or explicit promises. This is particularly important when consumers cannot immediately assess the true quality at the point of purchase. The perceived quality directly impacts the seller's reputation, influencing customer trust and future decisions.
Utility – the product's ability to meet or exceed the functional expectations of its users – is a core aspect of quality. Does the software solve the problem it was intended to solve? Does it fulfill its purpose effectively? Significant deviation from these expectations typically leads to negative perceptions of quality.
Interestingly, the lifetime or perpetual existence of a product doesn't necessarily equate to its quality. A piece of software might solve a specific, time-bound problem and then be retired, yet still have provided immense value during its lifespan. Its quality might even intangibly improve the quality of other processes or products it interacted with. Even deleted software retains the immutable value of the problems it solved in the past. Furthermore, software currently serving no active purpose might hold future value, perhaps for mitigating risks, complying with audits, or being repurposed later. This again highlights the subjective and context-dependent nature of quality.
Testing serves as the mechanism to ensure the product meets these varied expectations. It verifies that the product indeed solves the intended problem and fulfills its purpose for the users and the business.
Writing tests shouldn't feel like a chore, akin to "eating your vegetables." Tests are written because they provide tangible utility. Performing all necessary verification manually is often inefficient and error-prone. Developers need a reasonable level of confidence that their changes haven't inadvertently broken something elsewhere in the application – something they might not even be aware of. In large applications, holding the entire system's complexity in one's head is impossible. Tests provide the necessary safety net and validation mechanism.
A Little History: Fixtures and Mocks
To understand some common testing terminology, it helps to look at its origins, particularly from hardware engineering.
Test Fixtures: The term "test fixture" originates from hardware manufacturing. A physical test fixture was literally a device designed to securely hold a piece of hardware (like a circuit board) in a consistent position for testing. This ensured reliable and repeatable measurements.
In software testing, this concept was adapted. A software test fixture refers to a known, baseline state or environment set up before tests are run. This might involve initializing variables, setting up database records, configuring global states, or preparing other dependencies so that tests can execute from a consistent starting point and easily access the required state.
Mocks: In everyday language, a "mock" is a replica or imitation. In hardware, a mock object might be a stand-in that mimics some, but not all, functionality of a real component. This could be useful if the real component is expensive, rare, or unavailable during testing.
In software development, "mocking" involves creating substitute objects or functions that are called instead of the real ones during a test. These mock objects are created by the developer to simulate the behavior of the real dependency, often in a simplified way. This is useful for isolating the code under test from its dependencies, avoiding the overhead of interacting with real databases, networks, or third-party services, or simulating specific scenarios (like network errors or empty database results) that might be hard to reproduce otherwise. Mocks typically perform less processing than the components they imitate but can be configured to return specific values, accept certain inputs, or verify that they were called correctly.
(Historical timeline omitted for chapter flow, but the concepts are introduced here)
The Role and Purpose of Tests Revisited
Why do we fundamentally need tests? Because systems, and the humans who build them, are fallible. If developers always knew the exact intent and consequences of every change, and could perfectly verify alignment with desired behavior, formal tests might be redundant. The verification would happen implicitly during development.
Tests exist to check invariants – conditions or properties that are expected to remain true. Many tests, especially granular ones like unit tests, implicitly assume that any change causing a deviation from the tested behavior is undesirable. For example, if a function's output changes and a unit test fails, it could signal a newly introduced bug. However, it could also signal an intentional feature change that requires the function to behave differently. The test itself doesn't inherently know the difference; it only knows the previously defined contract has been violated. It provides information, and the programmer must interpret it. This highlights a potential friction point: in fast-moving projects with frequent requirement changes (like early-stage startups), tests might need frequent rewriting, potentially reducing their immediate return on investment.
Tests act as safeguards against unwanted changes, but their effectiveness is limited by the scope and quality of the test coverage and specific test cases. They provide critical information, especially in large systems where it's impossible for one person to fully grasp the ripple effects of their changes. Tests help prevent excessive or unintended change by enforcing known contracts.
This inherent nature of tests – preventing change – means they introduce a trade-off. Tests generally slow down the initial development process (time spent writing and running them) in exchange for increased resilience and predictability, preventing unintended consequences later. Apps naturally evolve due to new feature requests or external factors like security updates and library deprecations, which require refactoring. There's a constant push and pull between the desire for stability (enforced by tests) and the need for change.
Is slowing down development necessarily bad? Not always. It depends on the value derived. While tests add overhead to the initial creation of a feature, they can significantly increase speed in the long term by preventing rework. Fixing bugs caught by tests during development is far cheaper and faster than fixing them after they've reached production and impacted users. The overall effect on development speed depends heavily on factors like how quickly tests run, the risk tolerance of the application, and the quality of the testing strategy itself.
One might argue that even if tests run instantaneously and consume no resources, they still slow down the process because their output (pass/fail information) must be processed and potentially acted upon. If the information from tests doesn't influence decisions or software outcomes, then running them is pointless, as their computation isn't used by customers and their state isn't retained. Therefore, testing inherently introduces a delay because its informational output needs to impact the workflow.
A counter-argument suggests that the mere act of writing tests is valuable, even if failures are ignored, because it forces developers to understand the code better and can serve as documentation. However, to gain that understanding or use it as documentation, one must verify that the test works, which brings us back to needing the information derived from running the test (i.e., knowing if it passed or failed).
Ultimately, tests serve several key purposes:
- Preserving Intent: Ensuring that changes have the intended effect (e.g., changing a button's color changes only that button, not the page background).
- Verifying Functionality: Treating the application (or parts of it) as a function that must produce expected outputs or state changes given certain inputs, within acceptable tolerances.
- Confirming User Goals: Checking if users can successfully complete their intended tasks. It doesn't matter how many low-level API tests pass if the end user cannot achieve their goal.
- Meeting Business Needs: Ensuring requirements beyond immediate user interaction are met (e.g., auditing requirements, telemetry collection). Customers might not directly care about these, but the business does.
- Maintaining Established Quality: If prior versions established certain levels of usability, performance, clarity, and relevance, tests serve as a proxy for maintaining these qualities by ensuring the application behaves consistently (within defined boundaries).
Okay, continuing the chapter draft.
Types of Testing in the CI/CD Workflow
While there are many ways to categorize software tests, several types are particularly relevant within a CI/CD context. Understanding their purpose helps in building an effective testing strategy.
Unit Testing
Unit tests focus on the smallest testable parts of an application, often individual functions or methods within a class. They test these "units" in isolation from the rest of the system. The primary goal is to validate that each piece of code performs its specific task correctly according to its design.
Because they operate on small, isolated code segments, unit tests are typically very fast to run. This makes them ideal for inclusion early in the development workflow, often run by developers locally before they even commit their code, and again automatically on every pull request. They provide rapid feedback on the correctness of individual components.
To achieve isolation, unit tests often employ mocks or stubs to replace dependencies (like database connections, network calls, or other functions). This ensures the test focuses solely on the logic within the unit itself, without being affected by the behavior or availability of external systems.
Example: Simple Unit Test (C# using MSTest)
Imagine a simple Calculator class:
// In YourNamespaceWhereCalculatorExists
public class Calculator
{
    public int Add(int a, int b)
    {
        return a + b;
    }
}
A unit test for the Add method might look like this:
using Microsoft.VisualStudio.TestTools.UnitTesting;
// Make sure to reference the project containing Calculator
using YourNamespaceWhereCalculatorExists;

[TestClass]
public class CalculatorTests
{
    [TestMethod]
    public void Add_TwoNumbers_ReturnsCorrectSum()
    {
        // Arrange: Set up the test.
        var calculator = new Calculator();
        int number1 = 3;
        int number2 = 4;
        int expectedSum = 7;

        // Act: Execute the code under test.
        var result = calculator.Add(number1, number2);

        // Assert: Verify the outcome.
        Assert.AreEqual(expectedSum, result, "The sum was not calculated correctly.");
    }
}
This test follows the common Arrange-Act-Assert (AAA) pattern: set up prerequisites, invoke the code, and verify the result.
Unit tests excel at verifying internal logic, handling edge cases (e.g., what happens when input is null or zero?), and ensuring that specific functions meet their contracts. They are particularly useful when dealing with complex algorithms or logic that might be difficult to trigger or observe through the user interface alone. For example, testing error handling for an "out of stock" scenario might be easier with a unit test than by manipulating inventory levels in a full application environment.
However, unit tests are often tightly coupled to the implementation details. Refactoring code, even if the external behavior remains the same, can easily break unit tests, leading to maintenance overhead. Over-reliance solely on unit tests can also lead to situations where individual components work perfectly in isolation but fail when integrated.
Integration Testing
Integration tests take the next step up from unit tests. They verify the interaction between different units, components, or layers of the application. The focus shifts from isolated correctness to ensuring that combined parts work together as expected.
Examples include testing:
- Communication between a service layer and a database.
- Interaction between different microservices via API calls.
- The flow of data through multiple components.
Integration tests often require more setup than unit tests, potentially involving real databases (or in-memory versions), network communication, or interaction with other actual services. Consequently, they tend to be slower to run.
Example: Simple Integration Test (C# with EF Core In-Memory DB)
Consider a UserService interacting with a database via Entity Framework Core:
// Entity and DbContext (simplified)
public class User { public int Id { get; set; } public string Name { get; set; } }

public class AppDbContext : DbContext
{
    public AppDbContext(DbContextOptions<AppDbContext> options) : base(options) { }
    public DbSet<User> Users { get; set; }
}

// Service using the DbContext
public class UserService
{
    private readonly AppDbContext _context;
    public UserService(AppDbContext context) { _context = context; }
    public User GetUser(int id) { return _context.Users.Find(id); }
}
An integration test verifying the service retrieves data from the (simulated) database:
using Microsoft.EntityFrameworkCore;
using Microsoft.VisualStudio.TestTools.UnitTesting;
// Add necessary using statements for your classes

[TestClass]
public class UserServiceIntegrationTests
{
    private AppDbContext _context;
    private UserService _service;

    [TestInitialize] // Runs before each test
    public void TestInitialize()
    {
        // Use an in-memory database for testing
        var options = new DbContextOptionsBuilder<AppDbContext>()
            .UseInMemoryDatabase(databaseName: System.Guid.NewGuid().ToString()) // Unique name per test run
            .Options;
        _context = new AppDbContext(options);
        _service = new UserService(_context);

        // Seed database with test data
        _context.Users.Add(new User { Id = 1, Name = "Alice" });
        _context.SaveChanges();
    }

    [TestMethod]
    public void GetUser_ValidId_ReturnsUserFromDatabase()
    {
        // Act
        var user = _service.GetUser(1);

        // Assert
        Assert.IsNotNull(user);
        Assert.AreEqual("Alice", user.Name);
    }

    [TestCleanup] // Runs after each test
    public void TestCleanup()
    {
        _context.Database.EnsureDeleted(); // Clean up the in-memory database
        _context.Dispose();
    }
}
This test verifies the interaction between UserService and AppDbContext using a realistic (though in-memory) database setup.
Integration tests are crucial for uncovering issues that arise at the boundaries between components, such as data format mismatches, incorrect assumptions about dependencies, or communication failures.
End-to-End (E2E) Testing
End-to-end tests simulate a complete user workflow through the application, from the user interface (UI) down through the various layers (services, databases, external integrations) and back. They aim to validate the system as a whole from a user's perspective.
Examples include:
- Simulating a user logging in, adding an item to a shopping cart, and checking out.
- Making an API request to a specific endpoint and verifying the entire response structure and data, simulating how a client application would interact with it.
E2E tests are typically the most comprehensive but also the slowest and potentially most brittle type of test. They often involve automating a web browser (using tools like Selenium, Cypress, or Playwright) or making actual HTTP requests to deployed environments. Because they interact with the full system, including the UI, changes to layout, element IDs, or underlying service behavior can easily break them.
They are invaluable for ensuring that critical user journeys function correctly and that all the integrated parts truly deliver the expected end-user experience. A failure in an E2E test often indicates a significant problem that would likely impact real users.
Regression Testing
Regression testing isn't a distinct type of test like unit or E2E, but rather a purpose for running tests. Its goal is to ensure that new code changes (features, bug fixes, refactoring) have not negatively impacted existing functionality. Essentially, it aims to prevent "regressions" – bugs reappearing or previously working features breaking.
Any existing unit, integration, or E2E test can serve as a regression test. When a bug is found and fixed, it's common practice to write a specific test (often a unit or integration test) that reproduces the bug. This test initially fails, passes once the fix is applied, and is then kept in the test suite to ensure the bug doesn't resurface later. Running the entire relevant test suite after changes provides confidence that existing functionality remains intact.
Performance and Load Testing
These tests focus on the non-functional aspects of application speed, responsiveness, stability, and resource utilization, especially under load.
- Performance Testing: Measures response times and resource consumption under typical or specific conditions.
- Load Testing: Simulates concurrent user access to see how the system behaves under heavy traffic, identifying bottlenecks and capacity limits.
While standard functional tests might have timeouts, performance and load tests use specialized tools (like k6, JMeter, or Locust) to generate significant traffic, measure precise timings, and collect detailed metrics (CPU usage, memory consumption, network I/O). Changes to code, even small ones, can subtly degrade performance over time. Regular performance testing helps ensure the application continues to meet user expectations and Service Level Agreements (SLAs). These tests are often run less frequently than functional tests, perhaps nightly or before major releases, due to their resource-intensive nature.
Non-functional, User, and Security Testing
This broad category encompasses tests that don't focus solely on whether a specific function produces the correct output but rather on other qualities:
- Usability Testing: Evaluating how easy and intuitive the application is for users. This often involves observing real users interacting with the system and relies heavily on human judgment and feedback. Automated tests struggle here as they lack the concept of intuitiveness.
- Accessibility Testing: Ensuring the application is usable by people with disabilities (e.g., screen reader compatibility, keyboard navigation, sufficient color contrast). Some aspects can be automated, but manual checks are often essential.
- Security Testing: Identifying vulnerabilities and ensuring the application protects against threats like SQL injection, cross-site scripting (XSS), unauthorized access, etc. This involves specialized tools (scanners, penetration testing frameworks) and expertise.
- Exploratory Testing: A less structured approach where testers simultaneously learn about the software, design tests, and execute them, often based on intuition and experience. This human-driven activity is excellent for finding unexpected issues that rigid test scripts might miss.
While CI/CD heavily emphasizes automated tests for speed and consistency, these other forms of testing, often involving manual effort and human expertise, remain critical for delivering a truly high-quality, secure, and user-friendly product.
Testing Frameworks and Tools
To write, organize, and run tests efficiently, developers rely on testing frameworks and tools. Frameworks like JUnit (Java), pytest (Python), Jest (JavaScript), MSTest/NUnit/xUnit (.NET), and Google Test (C++) provide structure and utilities for testing.
Key benefits of using a testing framework include:
- Structure: They provide conventions for defining tests (e.g., using attributes like
[TestMethod]or specific function naming patterns), making tests easier to write and understand. - Execution: They include test runners that discover and execute tests automatically.
- Assertions: They offer built-in functions (
Assert.AreEqual,expect(value).toBe, etc.) for verifying expected outcomes. - Setup/Teardown: They provide mechanisms (like
[TestInitialize]/[TestCleanup]orbeforeEach/afterEach) to set up preconditions before tests and clean up afterward, ensuring test independence. - Reporting: They can generate reports detailing test results (pass/fail counts, duration, errors), often in formats consumable by CI/CD systems (like JUnit XML). This allows pipelines to track test outcomes, display results, and make decisions (e.g., fail the build if tests fail).
- Integration: Many frameworks integrate well with IDEs (for easy local running and debugging) and CI/CD platforms.
Tools like Selenium, Cypress, or Playwright focus specifically on automating browser interactions for E2E testing. Others like Postman or REST Assured help with API testing. Mocking libraries (Mockito, Moq, NSubstitute) assist in creating mock objects for unit testing. These tools often work in conjunction with the core testing frameworks. Using established frameworks and tools promotes consistency within a team, leverages community knowledge, and automates much of the boilerplate work involved in testing.
Organizing Your Tests
As a project grows, so does its test suite. Proper organization is crucial for maintainability and efficient execution.
- Location: Conventions vary by language and framework, but common patterns include:
- Placing test files alongside the source files they test (e.g.,
myFunction.jsandmyFunction.test.js). - Using a dedicated test directory structure that mirrors the source directory structure (common in Java and C#).
- Having a top-level
testsorspecdirectory. - Naming Conventions: Clear and consistent naming is vital. A good test name describes what scenario is being tested and what the expected outcome is (e.g.,
Add_TwoNegativeNumbers_ReturnsCorrectNegativeSum). - Grouping/Suites: Frameworks often allow grouping tests into suites (e.g., by feature, type like "unit" vs "integration", or speed like "fast" vs "slow"). This enables running specific subsets of tests. For instance, during local development or on a PR build, you might only run fast unit tests, reserving slower integration or E2E tests for a nightly build or pre-deployment stage. Some advanced test runners can even automatically determine which tests are relevant based on the code changes made.
Good organization prevents test duplication, helps ensure adequate coverage across different functionalities, makes it easier for developers to find and run relevant tests, and simplifies debugging when tests fail.
Okay, let's continue building the chapter, focusing on best practices, challenges, and developing a sound testing philosophy within the CI/CD context.
Best Practices and Challenges in Software Testing
Writing tests is one thing; writing effective tests and managing them within a dynamic CI/CD environment presents its own set of practices and challenges.
Ensuring Broad Coverage While Avoiding Overlap
A good test suite provides confidence by covering the application's critical functionalities. However, simply writing more tests isn't always better. Strive for broad coverage of requirements and user scenarios, but be mindful of redundant tests. Overlapping tests (multiple tests verifying the exact same narrow piece of logic) increase maintenance overhead without significantly improving confidence. Well-organized tests, perhaps structured by feature or user story, help identify gaps and prevent unnecessary duplication. While some overlap is inevitable (e.g., setup steps), deliberate effort should be made to ensure each test adds unique value.
Selectively Running Tests
As test suites grow, running all tests on every single code change locally can become prohibitively slow, hindering the fast feedback loop. Developers need the ability to selectively run tests relevant to their current changes. Most testing frameworks support running individual tests or specific suites. Some modern tools even offer test impact analysis, attempting to automatically determine which tests could be affected by a given code change and running only that subset.
In the CI pipeline, the strategy might differ. Pull request builds often run a faster subset (e.g., unit tests and core integration tests), while post-merge builds or pre-deployment stages might execute the full suite, including slower E2E and performance tests. The key is balancing feedback speed with test thoroughness at different stages.
Understanding Code Coverage (and its Limitations)
Code coverage tools measure which lines or branches of your source code are executed by your test suite, typically expressed as a percentage. It can be a useful indicator, but it's crucial to understand its limitations.
- What it shows: If a section of code has 0% coverage, it means no test executes it. This is a clear signal that part of your application is untested.
- What it doesn't show: High coverage (e.g., 90% or even 100%) does not guarantee the tests are meaningful or that the code is bug-free. It only shows that the code was executed, not that the assertions within the tests were correct or comprehensive. A test could run through code without actually verifying the right behavior.
- The danger of targets: Setting arbitrary high coverage targets (e.g., mandating 90% coverage) can incentivize developers to write trivial or low-value tests simply to "hit the number," potentially making the codebase harder to refactor later due to the sheer volume of tests, some of which might be brittle. It's often unclear what the untested 10% in a 90% coverage scenario represents – was it low-risk boilerplate code, or a critical edge case that was hard to test?
Use code coverage as a tool to identify untested areas, but don't treat it as a definitive measure of test quality. Focus on testing critical paths and complex logic thoroughly, rather than chasing a percentage.
Mutation Testing: A Deeper Look
Mutation testing offers a more sophisticated way to assess test suite quality than simple code coverage. It works by automatically introducing small changes ("mutations") into your source code (e.g., changing a + to a -, > to <, or deleting a line). It then runs your test suite against each mutated version.
- If a test fails, the mutation is considered "killed" – meaning your tests were effective enough to detect that specific change.
- If all tests still pass despite the mutation, the mutation "survives" – indicating a potential weakness in your tests; they weren't specific enough to catch that particular alteration.
A high percentage of killed mutants suggests a more robust test suite compared to one where many mutants survive. However, mutation testing is computationally expensive and often run less frequently than standard tests.
Analyzing and Interpreting Test Results
Tests generate data – pass/fail status, execution time, error messages. Effectively analyzing this data is key. CI/CD platforms often provide dashboards to visualize test results over time. Look for patterns:
- Frequently Failing Tests: Which tests fail most often? This might indicate brittle tests or unstable areas of the application needing attention.
- Slow Tests: Which tests take the longest? Can they be optimized, run less frequently, or parallelized?
- Flaky Tests: Tests that pass and fail intermittently without code changes (discussed more under Anti-patterns). These erode confidence and must be addressed.
Publishing test results (often via standard formats like JUnit XML) allows aggregation and trend analysis. This data helps prioritize fixing problematic tests and identifying systemic quality issues. Remember, however, that a lack of failing tests in one area doesn't automatically mean it's high quality – it might simply lack adequate testing.
Where and When to Run Tests
The placement of tests within the CI/CD pipeline influences the feedback loop and risk mitigation:
- Locally (Developer Machine): Running fast tests (mainly unit tests) locally before committing/pushing provides the quickest feedback, catching errors before they affect others.
- On Pull Request (PR): Running a core set of automated tests (unit, key integration) automatically when a PR is created/updated acts as a gatekeeper. Failing tests block merging, preventing broken code from entering the main branch and "keeping the pipeline green" for deployments.
- Post-Merge (Main Branch): After a PR is merged, a more comprehensive suite (potentially including slower integration tests) might run on the main branch to ensure integration integrity. This build often generates the artifacts used for deployment.
- Pre-Deployment (Staging/PPE): Before deploying to production, tests (often E2E, performance) might run against a production-like environment (Staging or Pre-Production Environment - PPE) to validate the actual deployment artifact and configuration in a realistic setting.
- Post-Deployment (Production): Some tests ("smoke tests" or health checks) run against the live production environment immediately after deployment to quickly verify core functionality is working. This is the ultimate validation but carries the risk of impacting real users if not done carefully (e.g., using read-only checks or dedicated test accounts).
Why Run Tests on CI and Locally?
It might seem redundant, but running tests in both environments is crucial:
- Discipline & Oversight: Developers might forget, lack discipline, or only run a subset of tests locally. The CI server acts as an unbiased enforcer, ensuring all necessary tests pass before integration.
- Environment Differences: A developer's machine is rarely identical to the CI environment or production. Tests might pass locally due to specific configurations, installed tools, data, timezones, or OS differences that don't exist elsewhere. The CI server provides a cleaner, more standardized environment, closer to production.
- Comprehensive Testing: CI servers are better suited for running long, resource-intensive tests (E2E, load, performance) that might be impractical locally.
- Clean Builds: CI systems typically build projects from scratch, avoiding issues caused by leftover artifacts or inconsistent state on a developer machine, ensuring repeatable builds.
- Dependency Checks: If a shared library changes, a CI server can potentially trigger builds for all dependent projects to catch downstream breakages early.
When are Mocks Useful?
Mocking shines when you need to isolate the code under test or control its environment:
- Isolating Logic: Testing complex calculations in a shopping cart (e.g., handling discounts, taxes, out-of-stock items) without needing a real UI or database.
- Simulating External Systems: Testing how your login page handles an invalid password response from an authentication service, without needing a live service that might be unavailable or slow. Testing how a search function behaves when the underlying search engine returns no results or throws an error.
- Controlling Difficult States: Verifying how a payment gateway integration handles a scenario where the bank's system is temporarily down – a state hard to reproduce on demand with the real system.
- Performance: Avoiding slow network calls or database queries during fast unit tests.
- Verifying Interactions: Ensuring specific methods on dependencies were called (e.g., checking if a logging service was invoked correctly).
Testing Philosophy and Prioritization
Simply knowing the types of tests isn't enough. You need a coherent philosophy and strategy to guide what, when, and how to test effectively.
Beyond the Pyramid: Test Where it Makes Sense
The "Testing Pyramid" (many unit tests, fewer integration tests, fewest E2E tests) is a popular heuristic. It emphasizes placing tests at the lowest possible level for speed and isolation. While the underlying principle (prefer faster, more focused tests when appropriate) is sound, rigidly adhering to the pyramid's shape can be misleading.
Don't write unit tests just to make the pyramid look right if the real risks or integration points demand integration or E2E tests. Conversely, don't use slow, brittle E2E tests to verify simple algorithmic logic that a unit test could cover instantly.
The critical question is: What are you trying to verify, and what's the most effective and efficient way to do it?
- If you need to validate complex business logic involving multiple components interacting, an integration test might be necessary.
- If you need to ensure a user can complete a critical workflow through the UI, an E2E test is likely required.
- If you need to verify a specific calculation or edge case within a single function, a unit test is probably best.
Track why your tests fail. If 95% of UI test failures are actually due to calculation errors in the backend (as noted in one example), then using slow UI tests for this purpose is inefficient. Add targeted unit or integration tests at the source of the calculation instead. Test at the layer where the potential issue originates and can be most directly verified.
Outcome vs. Process Testing
Consider what aspect of the behavior is important:
- Outcome-Focused: Do you primarily care about the final result, regardless of how it was achieved? Example: Testing if clicking the "Login" button successfully navigates the user to their dashboard. You don't care exactly how the button was rendered or which internal services were called, only that the user-visible outcome is correct. E2E tests often excel here.
- Process-Focused: Is the way the result is achieved critical? Example: Testing if a caching layer is actually being used when retrieving data. Simply checking the returned data isn't enough, as the data would be the same whether the cache was hit or the database was queried directly. You need to verify the internal process (e.g., by mocking the database and ensuring it wasn't called, or by inspecting the cache state). Unit or integration tests with mocking/spying capabilities are often better suited for this. Another example is verifying that specific audit logging functions are called during a transaction, even though the user never sees the audit log.
Understanding whether you're testing the outcome or the process helps select the appropriate test type and level.
E2E Tests: Necessary but Handle with Care
There's sometimes a push to minimize E2E tests because they can be slow and brittle. While reducing unnecessary E2E tests is good, eliminating them entirely is often unwise. They are the only tests that truly verify the integrated system from the user's perspective.
Instead of just reducing their number, focus on:
- Stability: Use reliable selectors, wait strategies, and consider tools designed for robustness (like Cypress or Playwright).
- Scope: Focus E2E tests on critical user journeys, not every single UI element interaction.
- Placement: Run them at appropriate pipeline stages (e.g., pre-deployment) rather than on every commit.
- Optimization: Can they be run in parallel? Can the underlying environment be made faster?
The Confidence Factor
Ultimately, tests are about providing confidence to developers and the business that changes can be deployed safely. Tests should be meaningful and well-designed. A suite full of trivial tests passing gives a false sense of security. Code passing tests doesn't automatically mean the code is correct; it only means it meets the specific expectations encoded in those tests. Well-designed tests, however, significantly increase the probability that passing tests correlates with correct code.
Okay, let's continue drafting the chapter, moving into operational strategies, test management, and tackling common challenges.
Operational Strategies for Testing in CI/CD
Beyond writing individual tests, effectively managing the testing process within a fast-paced CI/CD environment requires strategic operational thinking.
Dealing with Slow Tests
Slow tests are a common bottleneck, particularly E2E or complex integration tests. If tests become too slow, they delay feedback and can hinder developer productivity. Instead of simply accepting the slowdown or, worse, disabling valuable tests, consider these strategies:
- Optimize: Can the test itself be made more efficient? Is the environment it runs in slow? Investing in faster testing infrastructure can have a significant return on investment (ROI), as developer time is valuable. The increased feature velocity enabled by CI/CD should ideally outweigh marginal increases in testing costs.
- Parallelize: Can tests be run concurrently across multiple agents or environments? Many CI platforms and test runners support parallel execution.
- Categorize and Schedule: Separate tests into suites based on speed ("fast," "medium," "slow"). Run fast tests frequently (locally, on PRs), medium tests post-merge, and slow tests less often (e.g., nightly or pre-deployment).
- Prioritize: If you absolutely must reduce test execution time for a specific stage, prioritize running the tests covering the most critical functionalities or highest-risk areas first. Consider randomized sampling of less critical tests if full execution isn't feasible in the available time window.
- Re-evaluate Level: Is a slow E2E test verifying something that could be checked more quickly and reliably with a lower-level integration or unit test?
Prioritizing Bugs and Test Failures
Not all test failures or bugs have the same severity. When a test fails in the CI pipeline:
- Triage Immediately: Someone needs to quickly assess the failure. Is it a genuine bug in the code? A problem with the test itself (flaky)? An environment issue?
- Impact Assessment: How critical is the failure? Does it block a core user journey? Is it an edge case? This assessment informs the priority of fixing it.
- Don't Ignore Flaky Tests: While a flaky test might not represent a real regression this time, it erodes trust in the test suite. It needs to be investigated and fixed or quarantined (see Anti-patterns section).
- Production Failures: Failures detected in post-deployment tests running against production require immediate attention. The goal should be to quickly revert the deployment or apply a hotfix. Ensure your deployment process allows for easy and fast rollbacks.
Sometimes, especially in early product stages or when exploring new features, it might be acceptable to release with known, non-critical bugs. The strategy might involve releasing faster to gather user feedback, potentially using a beta program where engaged users actively look for issues in exchange for early access. However, this depends heavily on the product domain, user expectations, and risk tolerance.
The Role of QA
In a mature CI/CD environment, the role of dedicated QA professionals often shifts. With developers writing more automated tests (unit, integration) and the pipeline handling regression checks, QA can focus on higher-value activities that are difficult or impossible to automate:
- Exploratory Testing: Probing the application creatively to find unexpected issues.
- Usability Testing: Assessing the user experience.
- Complex Scenarios: Testing intricate workflows or edge cases not easily covered by automated scripts.
- Test Strategy & Planning: Helping define what needs testing and how best to achieve coverage.
- Analyzing Results: Interpreting trends in test failures and bug reports to identify systemic quality issues.
- Tooling & Automation Support: Helping select, implement, and maintain testing tools and frameworks.
QA should not be a bottleneck. Integrating testers early in the development process, fostering collaboration between developers and testers ("shift-left" testing), and ensuring clear responsibilities can streamline the quality assurance process. If manual testing processes consistently slow down releases, investigate which parts can be automated and ensure QA focuses on tasks requiring human insight. In some complex domains, outsourcing specialized testing (like security penetration testing or large-scale performance testing) might be considered.
Architectural Considerations
If bugs frequently emerge despite testing, or if tests are consistently difficult to write or maintain, it might indicate underlying architectural problems. Consider periodic architectural reviews to identify areas causing friction for testability or introducing excessive coupling.
Building and Managing Maintainable Tests
Tests are code, and they require the same care in design and maintenance as production code.
- Clarity and Readability: Use clear naming conventions (for tests and variables). Follow patterns like Arrange-Act-Assert (AAA) to structure tests logically. Add comments where necessary to explain complex setups or non-obvious assertions. Remember, others (or your future self) will need to understand and maintain these tests.
- Independence: Tests should ideally be independent of each other. One test's failure should not prevent others from running, nor should its execution leave behind state that affects subsequent tests. Use proper setup (
TestInitialize,beforeEach) and teardown (TestCleanup,afterEach) mechanisms provided by your framework to manage state. - Deterministic Behavior: Tests should produce the same result every time they are run against the same code, assuming no external factors change. Avoid dependencies on things like current date/time, random numbers (unless explicitly testing randomness and using fixed seeds), or uncontrolled external services within core functional tests. Use mocks and stubs to control dependencies.
- Focus: Each test should ideally verify a single logical concept or scenario. Tests trying to do too much become hard to debug when they fail.
- Abstraction and Patterns: For complex setup or repeated actions (like logging in for E2E tests), use helper functions or Page Object Models (in UI testing) to abstract details and reduce duplication. Create declarative tests where the intent is clear, hiding imperative setup details.
- Dependency Management: Avoid brittle dependencies. In infrastructure or environment setup, use version pinning (e.g.,
package-lock.jsonin Node.js, specific Docker image tags) rather than always pulling "latest," which can introduce unexpected changes. - Test Impact Analysis: Understand how changes in production code might affect tests. Tools can sometimes help, but good organization (e.g., locating tests near the code they test) also aids developers in identifying potentially impacted tests manually.
- Equivalence Relations: When asserting equality, consider what level of equality matters. Does the order of elements in a list matter? Does floating-point precision need to be exact, or within a tolerance? Define assertions clearly. Sometimes, hash functions can serve as approximate equality checks for complex objects, though with potential for collisions.
- Retiring Tests: Tests aren't sacred. Regularly review your test suite. Tests that are consistently flaky despite fixing efforts, tests for removed features, or tests that are completely redundant due to newer, better tests should be considered for retirement. Deleting or rewriting a test requires as much consideration as creating one.
Correlating Failures and Root Cause Analysis (RCA)
When a bug slips through to production, or a test fails unexpectedly, effective analysis is key to improving the process.
- Bug Correlation: When a production bug is found, investigate: Was there a test that should have caught this? If yes, why didn't it (e.g., bug in test logic, incorrect assertion, flaky execution)? If no, write a new test (typically a regression test) that reproduces the bug before fixing it.
- Failure Tracking: Use CI/CD dashboards and test reporting tools to track failure history. Link test failures back to specific commits or changes (tools like
git bisectcan help identify when a regression was introduced). - Root Cause Analysis: Don't just fix the symptom. Understand why the bug occurred or why the test failed. Was it a misunderstanding of requirements? A concurrency issue? An environmental difference? A faulty assumption in a mock? Addressing the root cause prevents similar issues in the future.
Handling Specific Challenges
Race Conditions and Asynchronous Processing
Testing code involving concurrency or asynchronous operations is notoriously tricky. Flakiness often arises here.
- Shared State: Be extremely careful when tests modify shared resources (static variables, shared files, database entries). Ensure proper cleanup or use techniques to isolate test runs (e.g., unique database names per run, transactions that get rolled back).
- Asynchronous Waits: If testing code that performs background work, don't rely on fixed delays (
sleep(500ms)). This is unreliable. Use mechanisms provided by your language or framework, such as: - Callbacks or Promises/Futures/Async-Await to wait for completion.
- Polling: Repeatedly check for an expected state change, with a reasonable timeout to prevent infinite loops if the condition is never met. Libraries often provide utilities for this ("wait for condition").
- Resource Contention: Ensure tests don't collide over limited resources like network ports. Use mechanisms to acquire resources exclusively or use dynamically assigned resources.
- Temporary Files/Folders: Use library functions designed to create unique temporary files or directories and ensure they are cleaned up afterward.
- Database Transactions: Where possible, wrap test database operations in transactions that are rolled back after the test, leaving the database in its original state.
Fuzzing
Fuzz testing (fuzzing) involves feeding unexpected, invalid, or random data into an application to see if it crashes or behaves unexpectedly. While often used in security testing, the principle can apply more broadly.
- Edge Cases: Ensure code handles minimum/maximum values, empty inputs, and unusually long inputs gracefully.
- Character Encodings: Be cautious when generating random strings; invalid UTF-8 sequences can cause issues in unexpected places.
- HTTP Timeouts: When fuzzing APIs, ensure client settings allow for potentially long-running calls if the fuzzer generates complex requests.
Maintaining a Consistent Environment
Differences between developer machines, CI runners, staging, and production are a major source of "it works on my machine" problems and test flakiness.
- Infrastructure as Code (IaC): Define environments using tools like Docker, Terraform, or Ansible to ensure consistency.
- Dependency Pinning: Lock down versions of OS packages, libraries, and tools (as mentioned before).
- Clean Slate: Ensure CI jobs start from a known clean state, deleting artifacts from previous runs.
- Configuration Management: Manage configuration differences between environments explicitly and carefully. Avoid hardcoding environment-specific values.
- Permissions: Ensure tests run with appropriate permissions (e.g., file system access) that match the target environment where possible, or mock interactions requiring special privileges if necessary.
- Canary Pipelines: For infrastructure changes (like updating the base OS image for CI runners or deployments), use a canary approach: route a small amount of traffic/builds to the new version first, monitor closely, and roll out more broadly only when confident.
Okay, let's continue with the chapter, focusing on common pitfalls like flaky tests and the crucial task of developing a robust testing strategy.
Anti-patterns in Testing
While tests are essential, certain common practices, or "anti-patterns," can undermine their value, waste effort, and even introduce instability.
The Bane of Flaky Tests
Perhaps the most frustrating anti-pattern is the flaky test. These are tests that produce inconsistent results – sometimes passing, sometimes failing – when run against the exact same code without any relevant changes.
- Why are they bad? Flaky tests destroy trust. When a test fails, developers should have confidence that it indicates a genuine problem. If tests fail randomly, developers start ignoring them ("Oh, that's just the flaky login test again"), builds get manually overridden, and real regressions can slip through unnoticed. They inject noise into the feedback loop, masking the real signal. A test that fails unpredictably provides very little reliable information.
- Why do they occur? Flakiness often stems from:
- Race Conditions/Concurrency: Issues with timing in asynchronous operations or contention for shared resources (databases, ports, files).
- Environment Differences: Subtle variations between test environments (local vs. CI, different CI agents).
- Order Dependency: Tests that implicitly rely on other tests running first (or not running) to set up or clean up state.
- Uncontrolled External Dependencies: Reliance on third-party services (APIs, networks) that might be slow, unavailable, or return varying data.
- Infrastructure Issues: Intermittent network glitches, insufficient resources on test runners.
- Non-Deterministic Code: Relying on factors like current time/date or unseeded random number generators within the test logic or the code under test.
- Brittle Locators (UI Tests): Relying on unstable element IDs or CSS paths that change frequently.
- Incorrect Timeouts/Waits: Insufficient waiting times for asynchronous operations to complete, especially under varying load conditions.
- Resource Leaks: Tests not properly cleaning up resources (files, database entries, ports), causing conflicts for subsequent tests.
- Handling and Mitigating Flaky Tests:
- Prioritize Fixing: Treat flaky tests as high-priority bugs. Don't let them linger.
- Identify Them: CI platforms or test reporting tools can often help identify flaky tests by tracking pass/fail rates over time or supporting automatic reruns on failure. Running tests multiple times locally, potentially under stress (e.g., using tools like
stress-ngon Linux to simulate load, or running tests in parallel), can sometimes reveal flakiness. - Isolate and Debug: Reproduce the flakiness consistently if possible. Debug the test and the code it covers, looking for common causes like timing issues or resource conflicts.
- Improve Test Logic: Make assertions more robust, use reliable waiting mechanisms instead of fixed sleeps, ensure proper isolation and cleanup.
- Quarantine (Temporary): If a fix isn't immediate but the flakiness is blocking others, temporarily quarantine the test. This means marking it so it still runs but its failure doesn't fail the entire build. This should be a temporary measure, tracked with a high-priority bug ticket to fix it properly. Don't let the quarantine list grow indefinitely.
- Annotate: Some frameworks allow annotating tests as potentially flaky, perhaps triggering automatic retries within the CI pipeline. This can be a pragmatic step but doesn't fix the root cause.
- Consider Deletion: If a test is chronically flaky, difficult to fix, and its value is questionable or covered by other, more reliable tests, consider deleting it.
Remember, a UI flicker causing a test to fail might sometimes indicate a genuine usability issue, not just a test problem. Address the root cause, which might be in the application code itself.
Other Common Anti-patterns
- Testing on Production Resources (Q7): While testing in a production-like environment (Q1) is crucial, using actual production resources (especially databases with live customer data) for destructive or high-load testing is extremely dangerous and should generally be avoided. Data corruption or service disruption can occur. Use dedicated test accounts in production for smoke tests if necessary, or rely on high-fidelity staging environments.
- Lack of Production-Like Environment (Q1): The inverse problem. If the test environment doesn't closely mirror production (configuration, data characteristics, infrastructure), tests might pass but miss issues that only manifest in the real world. Strive to keep staging/PPE environments as close to production as possible, using IaC and configuration management.
- Blindly Chasing Coverage Thresholds (Q4): As discussed earlier, focusing solely on hitting a coverage percentage leads to low-value tests. Using previous builds' coverage as a fixed target (Q3) is also problematic, as removing well-tested legacy code could artificially lower coverage, penalizing necessary cleanup.
- Manual Execution of Automated Checks (Q8): If tests are designed for automation (deterministic inputs, clear pass/fail criteria) but are still executed manually, it negates the speed and consistency benefits of CI/CD. Automate what can be reliably automated.
- Ignoring Test Maintenance: Treating tests as write-once artifacts. Tests need refactoring, updating, and retiring just like production code.
Automated vs. Manual Testing: A Necessary Partnership
It's common to hear debates about "automated vs. manual" testing, often positioning them as opposing forces. However, as Michael Bolton and others argue, this is largely a false dichotomy. They are different activities with different strengths, and a mature testing strategy needs both.
- Automated Checks: What we typically call "automated testing" is more accurately described as automated checking. Computers excel at executing predefined steps and verifying expected outcomes against specific, unambiguous criteria. They are fast, consistent, tireless, and ideal for regression checking, verifying known invariants, and covering many scenarios quickly. They handle the repetitive verification that humans are ill-suited for.
- Human-Centric Testing: "Manual testing" should not mean humans manually executing automatable scripts. Instead, it leverages unique human capabilities:
- Exploration & Learning: Exploring the application, learning how it works, identifying usability issues, questioning assumptions, and finding unexpected bugs that no script was designed to look for. This is exploratory testing.
- Subjectivity & Experience: Assessing qualities like usability, aesthetics, clarity, and overall user experience – things computers struggle to quantify.
- Tacit Knowledge: Applying intuition and experience built from understanding users, the domain, and past issues.
- Adaptability: Designing and modifying tests on the fly based on observations.
- Critical Thinking: Evaluating if the software meets the intent behind the requirements, not just the letter of the specification.
Computers check conformance to specifications; humans evaluate fitness for purpose. Relying solely on automated checks leaves blind spots regarding usability, discoverability, and unexpected interactions. Relying solely on manual effort for things computers can check reliably is inefficient and slow.
In CI/CD, automated checks are essential for the fast feedback loop and regression safety net. Human-centric testing complements this by providing deeper insights, evaluating user experience, and finding bugs that automation misses. The goal is to automate the checks to free up human testers to focus on testing (evaluation, exploration, learning).
Developing a Test Strategy
Given that you can't test everything, and different tests serve different purposes, you need a test strategy. This is a plan outlining the approach to testing for a specific project or product. It defines what to test, how to test it (which types of tests, tools), when to test (at which pipeline stages), and who is responsible, all aligned with business goals, risk tolerance, and available resources.
Why Do You Need a Strategy?
- Finite Resources: Time, budget, and people are limited. A strategy helps allocate these resources effectively to maximize value and mitigate the most significant risks.
- Complexity: Modern applications are complex. A strategy provides a framework for tackling this complexity systematically.
- Alignment: Ensures the testing effort supports business objectives (e.g., rapid feature delivery vs. extremely high reliability).
- Consistency: Provides a common approach for the team.
Key Questions to Address:
- What are the goals? What does "quality" mean for this product? What are the critical user journeys? What are the biggest risks (technical, business, security)?
- What is the risk appetite? Is this a life-critical system where bugs are unacceptable, or a fast-moving consumer app where some imperfections might be tolerated in exchange for speed?
- What types of tests are needed? Based on the application architecture and risks, what mix of unit, integration, E2E, performance, security, and manual exploratory testing is appropriate?
- How will tests be implemented and managed? Which frameworks and tools? How will tests be organized and maintained?
- When will tests run? Define the testing stages within the CI/CD pipeline.
- How will results be analyzed and acted upon? Define the process for handling failures, tracking metrics, and improving the strategy over time.
Balancing Quality, Speed, and Cost
Testing exists within the classic project management triangle:
- Quality: How reliable, usable, and performant the software is. More testing generally aims for higher quality.
- Speed: How quickly features can be delivered to users. Extensive testing can slow down delivery cycles.
- Cost: The resources (people, infrastructure, tools) required for testing.
A test strategy must find the right balance based on context. A startup prioritizing market fit might lean towards speed, accepting slightly lower initial quality (and relying more on user feedback and fast iteration), while a financial institution might prioritize quality and regulatory compliance, accepting higher costs and slower delivery. There's no single "right" balance; it's context-dependent.
Risk-Based Testing (RBT)
A common approach to prioritize testing efforts is Risk-Based Testing. This involves identifying areas of the application with the highest risk (likelihood of failure * impact of failure) and focusing testing resources there.
- Identify Risks: Brainstorm potential problems. Consider:
- Complex features
- Frequently changed areas
- Business-critical functionalities (e.g., payment processing)
- Integration points with external systems
- Security-sensitive areas
- Areas with a history of bugs
- Performance-sensitive operations
- Assess Likelihood and Impact: Estimate how likely each risk is to occur and how severe the consequences would be if it did.
- Prioritize: Focus testing effort on high-risk items first. Low-risk items might receive less intensive testing or rely more on basic smoke tests.
Caveats of RBT:
- Subjectivity: Risk assessment is inherently subjective and can be biased. Involving multiple stakeholders helps.
- Blind Spots: Focusing only on known high risks might neglect testing newer or less understood areas where "unknown unknowns" might lurk. It can also de-prioritize non-functional requirements like usability or long-term maintainability if they aren't framed as immediate risks.
- The Long Tail: While focusing on the top risks is efficient initially, neglecting the "long tail" of lower-risk items entirely can lead to an accumulation of minor issues that eventually impact quality or user experience.
- Diminishing Returns: After addressing major risks, finely prioritizing among many small, similar risks can become difficult and bureaucratic.
RBT is a valuable tool for initial prioritization but shouldn't be the only factor. Combine it with coverage goals for critical areas and dedicated time for exploratory testing to mitigate its potential blind spots. Use risk to guide the intensity and order of testing, but ensure a baseline level of testing exists even for lower-risk areas.
Other Prioritization Factors
Beyond pure risk, consider:
- Usage Data: Prioritize testing frequently used features (based on analytics).
- Customer Impact: Focus on areas impacting high-value customers or core workflows.
- Regulatory Requirements: Mandated testing for compliance (e.g., accessibility, data privacy).
- Team Expertise: Leverage team members' knowledge of historically problematic areas.
Should I Write a Test For It? The Pragmatic Approach
When faced with a specific piece of code or functionality, ask:
- Is the behavior critical or complex? If yes, it likely warrants a dedicated test.
- Is it likely to break due to future changes? Tests act as future-proofing.
- Can it be verified effectively at a lower level? Prefer unit/integration tests over E2E if they provide sufficient confidence faster.
- Is it already covered adequately by other tests (manual or automated)? Avoid redundant effort.
- Is the behavior easily demonstrable and verifiable? If the expected outcome is clear and stable, it's a good candidate for an automated check. If it's highly subjective or rapidly changing (like early UI prototypes), extensive automated tests might be premature.
- What's the cost/benefit? How long will the test take to write and maintain vs. the risk of not having it?
Be pragmatic. In a fast-moving startup with evolving requirements, writing comprehensive E2E tests for every minor UI tweak might be counterproductive. Focus initial automated tests on core logic and critical paths. In a mature, stable application, more extensive regression testing is appropriate. Adapt your strategy to the project's lifecycle stage and risk profile. Look at past bugs – they are excellent indicators of where your previous testing strategy might have had gaps.
When Should a Test Fail? Finding the Right Sensitivity
Tests check for deviations from expectations. But how much deviation should trigger a failure?
- Exact Match: For calculations or specific data outputs, an exact match might be required.
- Thresholds: For performance tests or floating-point comparisons, failing only if a value exceeds a certain threshold or differs by more than a small epsilon might be appropriate.
- UI Brittleness: UI tests are prone to this. Should a test fail if a button's color changes slightly? If it moves 2 pixels? If its internal ID changes but its text remains the same? Relying on volatile implementation details (like exact CSS paths or generated IDs) makes tests brittle. Prefer testing based on user-visible attributes (text content, accessibility roles, dedicated
data-testidattributes) where possible. - Snapshot Testing: Tools can capture a "snapshot" (e.g., of a UI component's rendered output or an API response structure) and fail the test if the snapshot changes. This catches unexpected changes but requires manual review and updating of the snapshot whenever an intentional change occurs. It can be useful but requires discipline.
The goal is to make tests fail when meaningful changes occur but remain resilient to irrelevant implementation details. This often involves careful selection of assertion methods and UI locators. Allow manual overrides for test failures in CI pipelines, but only with scrutiny – is the failure truly insignificant, or is it masking a real issue?
Okay, let's wrap up the chapter on testing, bringing together the strategies and philosophies discussed.
Refining Your Strategy: Choosing the Right Tests
We've established that blindly following the testing pyramid isn't optimal. The core principle remains: test at the appropriate level to gain the necessary confidence efficiently. How do you decide between unit, integration, or E2E?
- Too many isolated unit tests: Can lead to a situation where individual components work perfectly alone, but the integrated whole fails. You might have 100% unit test coverage, but event handlers aren't connected, data doesn't flow correctly between services, or buttons simply don't trigger the right actions in the complete application.
- Over-reliance on mocked dependencies: Mocking is essential for unit testing, but tests relying heavily on mocks provide less confidence about real-world interactions. If your tests mock all external services, you aren't verifying the actual contracts or handling real network latency/errors. At some point, you need integration tests that interact with real (or realistic, like containerized) dependencies. If an external service is genuinely flaky in production, your integration tests should reflect that (perhaps with retry logic mirroring production) to provide realistic feedback. If it's slow in production, your tests reflecting that slowness provide valuable performance insights, though you need to balance this with feedback loop time.
- When implementation details matter (Unit/Integration): Consider the cache example again. If the process of retrieving data (i.e., hitting the cache vs. the database) is what you need to verify, an E2E test checking only the final data is insufficient. You need a lower-level test that can inspect or control the internal behavior (e.g., mocking the DB and asserting it wasn't called). Similarly, verifying internal state changes or calls to private/internal methods (like audit logging) often requires unit or integration tests.
- When the integrated outcome matters (E2E): If you need to verify a user can complete a multi-step workflow across different parts of the UI and backend services, an E2E test is often the most direct approach. Testing if a button is visible and clickable within the context of the entire application page requires an E2E perspective; a unit test of the button component in isolation doesn't guarantee it renders correctly or is accessible in the final assembly.
Think about the opposite situation: How would you know if this didn't work? What's the simplest, fastest test that could reliably detect that failure? Often, this mental model helps choose the right test level.
Happy Path vs. Sad Path Testing
- Happy Path: This tests the ideal, error-free scenario where the user does everything correctly (provides valid input, follows the expected sequence). Example: Successfully logging in with correct credentials, adding an item to the cart, and checking out smoothly. Happy path tests are essential to verify core functionality works under normal conditions.
- Sad Path: This tests scenarios involving errors, invalid input, or unexpected user actions. Example: Trying to log in with an incorrect password, attempting to add an expired coupon code, submitting a form with missing required fields, transferring a negative amount of money. Sad path tests are crucial for ensuring the application handles errors gracefully and provides informative feedback rather than crashing or producing incorrect results.
A balanced test strategy needs both. Over-focusing on the happy path leaves the application vulnerable to breaking under common error conditions or user mistakes. Over-focusing only on edge cases and errors might mean the core, successful workflows aren't adequately verified. Aim to cover the main happy paths and the most probable or impactful sad paths. Techniques like fuzzing can help explore less obvious sad paths.
Mutation Testing Revisited
As mentioned earlier, mutation testing provides a stricter assessment of test suite quality than code coverage. By making small code changes and checking if your tests fail ("kill the mutant"), it verifies if your tests are sensitive enough to detect actual code alterations. While computationally intensive, incorporating periodic mutation testing runs (perhaps less frequently than standard tests) can provide deeper confidence in your test suite's effectiveness, especially for critical logic. It helps counteract the weakness of tests that achieve high code coverage but lack meaningful assertions.
Retiring Tests: When to Let Go
Tests incur a maintenance cost. Just as features become obsolete, so can tests. Consider retiring or significantly rewriting tests when:
- The Feature is Removed: If the functionality a test covers is deleted from the application, the test is no longer needed.
- Redundancy: A newer, better test (perhaps at a different level, like an integration test covering what several brittle unit tests did) now provides the same or better coverage more reliably.
- Chronic Flakiness: If a test is persistently flaky despite significant effort to stabilize it, and its value doesn't justify the ongoing disruption and maintenance burden, deletion might be the best option (assuming the coverage is acceptable or replaced).
- Low Value & High Maintenance: If a test covers a very low-risk, stable area of the code but is complex and frequently breaks due to unrelated refactoring, its maintenance cost might outweigh its benefit.
Retiring tests should be done thoughtfully. Ensure you understand what coverage is being lost and that it's acceptable given the current risk assessment and overall test strategy.
Testing: The Safety Net for CI/CD
Continuous Integration and Continuous Deployment are built on the principle of making small, frequent changes and getting them to production quickly and reliably. Automated testing is the essential safety net that makes this possible.
Without a robust testing strategy integrated into the pipeline:
- CI becomes Risky Integration: Merging code frequently without validation leads to an unstable main branch ("integration hell").
- CD becomes Continuous Disaster: Deploying unverified changes frequently leads to production failures, eroding user trust and requiring constant firefighting.
Testing provides the confidence needed to automate the integration and deployment process. It enables:
- Fast Feedback: Catching errors early in the cycle, reducing the cost of fixing them.
- Risk Reduction: Decreasing the likelihood of deploying breaking changes to production.
- Increased Velocity: Allowing developers to merge and deploy more frequently and confidently, knowing the safety net is in place.
- Improved Code Quality: Encouraging testable design and providing a regression suite to prevent degradation over time.
- Collaboration: Providing a shared understanding of expected behavior and system health.
Conclusion
Testing in a CI/CD world is not just about finding bugs; it's a fundamental pillar supporting the entire philosophy of rapid, reliable software delivery. It requires a strategic approach, balancing different types of tests, managing them effectively, and understanding their strengths and limitations. From fast unit tests providing immediate feedback to developers, through integration tests verifying component interactions, to E2E tests validating user journeys, and including vital human-centric exploratory and usability testing, a comprehensive strategy is key.
By embracing testing not as a separate phase but as an integral part of the development workflow, embedded within the CI/CD pipeline, teams can gain the confidence needed to innovate faster, deploy more frequently, and ultimately deliver higher-quality software that truly meets user needs. Remember, tests are only as good as the effort and strategy behind them – invest wisely, and they will pay dividends in stability, speed, and confidence.-
Okay, let's start building the "Dependency Management" chapter for your "Beginning CI/CD" book based on your notes. I'll structure it logically, expand on the concepts, integrate the analogies, and aim for a clear, beginner-friendly tone suitable for your audience.
Here is the first part of the chapter:
Chapter X: Dependency Management - The Unsung Hero of CI/CD
Introduction to Dependency Management
Imagine you're setting up your Continuous Integration and Continuous Delivery (CI/CD) pipeline. You want automated builds, tests, and deployments humming along smoothly. But what happens when your build fails because a specific library wasn't found, or your tests pass in your local environment but fail in CI because of a version mismatch? These common frustrations often stem from the world of dependency management.
In the context of CI/CD, robust dependency management isn't just a "nice-to-have"; it's fundamental. It ensures reproducibility, meaning your software builds consistently everywhere – on your machine, your colleague's machine, and crucially, in your CI pipeline. It guarantees stability by controlling the exact versions of external code your application relies on. And it enhances security by making it easier to track and update components with known vulnerabilities. Mastering dependency management is a key step towards achieving reliable and efficient CI/CD.
What are Dependencies?
At its core, a dependency is an external piece of software – like a library, framework, or package – that your application requires to function correctly. Think of them as pre-built components or tools that save you from reinventing the wheel.
Let's use a simple analogy: baking a cake. To bake your delicious chocolate cake, you need ingredients like flour, sugar, cocoa powder, eggs, and milk. You don't need to grow the wheat and mill the flour yourself, nor do you need to raise chickens for eggs or keep a cow for milk. These ingredients are your dependencies. You rely on them being available and correct for your cake recipe (your application) to succeed. If the grocery store gives you salt instead of sugar, your cake won't turn out right. Similarly, if your application expects version 1.0 of a library but gets version 2.0 with breaking changes, it will likely fail.
A Brief History: Why We Need Dependency Management
Managing dependencies wasn't always the complex task it can seem today. Let's take a quick journey through time to see how the need evolved:
- 1950s-1960s (Assembly & Early High-Level Languages): Software was often custom-built for specific hardware. Sharing code was rare, and dependencies were minimal or manually handled. The advent of languages like FORTRAN and COBOL, along with early operating systems like UNIX introducing shared libraries, planted the seeds of code reuse, but formal management was nonexistent.
- 1970s-1980s (Linkers & Early Version Control): Tools like linkers emerged to combine different code pieces (object files, libraries) into a runnable program – an early form of dependency resolution. Version control systems like SCCS and RCS appeared, helping track changes to code, which indirectly aided in managing different versions of software components.
- 1990s (Build Tools & OS Package Managers): Build automation tools like
makebecame common, helping manage the compilation dependencies. On the operating system level, package managers like RPM (Red Hat) and dpkg (Debian) arrived to manage software installation and dependencies for the entire system. They prevented system-level conflicts but didn't solve issues within specific application projects. - 2000s (Language-Specific Managers & SemVer): This was the breakthrough era. Tools tailored for specific programming languages exploded: Maven (Java), npm (JavaScript), pip (Python), Bundler (Ruby), NuGet (.NET), and many others. They focused on managing dependencies for a single project, often isolating them from other projects. The concept of Semantic Versioning (SemVer) was introduced, providing a standardized way to communicate the impact of version changes (more on this later!).
- 2010s-Present (Containers, Microservices & Security Focus): Containerization technologies like Docker took isolation to the next level, packaging an application and all its dependencies together. The rise of microservices introduced the challenge of managing dependencies between services. Furthermore, awareness of software supply chain security grew dramatically, leading to tools and practices focused on scanning dependencies for known vulnerabilities.
This evolution highlights a clear trend: as software complexity and the practice of code reuse grew, the need for automated, reliable, and sophisticated dependency management became paramount. Manual management simply doesn't scale and introduces too many risks.
The Role of Package Managers
So, how do we solve the problems of manual dependency wrangling? Enter the package manager. You might initially see it as just another tool to learn, perhaps even bureaucratic overhead. However, package managers are essential assistants designed to streamline the complex task of handling dependencies.
Think back to our baking analogy. Instead of going to the grocery store yourself, listing every ingredient, checking your pantry for duplicates, and carrying everything home, imagine you have an assistant. You just give the assistant your recipes (for the chocolate cake and maybe some cookies that share some ingredients like flour and sugar). The assistant:
- Figures out the total list: They see both recipes need flour, sugar, eggs, etc., but cookies also need chocolate chips.
- Checks your pantry (your project): They see you already have plenty of flour.
- Goes to the store (package repository): They know exactly where to find reliable ingredients (standardized packages).
- Gets exactly what's needed: They buy sugar, eggs, cocoa powder, milk, butter, vanilla, and chocolate chips – without buying extra flour you already have.
- Ensures compatibility: They make sure to get baking soda and baking powder if both are required, not substituting one for the other incorrectly.
- Stocks your pantry correctly: They put the ingredients away neatly (install packages in your project, often in a specific folder like
node_modulesorvendor).
This is precisely what a package manager does for your software project:
- Reads your project's requirements: Usually from a manifest file (like
package.json,pom.xml,requirements.txt). - Resolves the dependency tree: It figures out not just your direct dependencies, but also the dependencies of your dependencies (transitive dependencies).
- Downloads packages: It fetches the required packages from configured repositories (like npmjs.com, PyPI, Maven Central).
- Installs packages: It places the package files correctly within your project structure.
- Handles conflicts (or flags them): If two different dependencies require incompatible versions of a third dependency, the package manager will try to resolve this based on its strategy or report an error.
- Ensures consistency: Often using a lock file, it records the exact versions of all installed dependencies, ensuring reproducible builds.
Package managers provide structure and automation. While they might seem restrictive sometimes (e.g., flagging version conflicts), this is a feature, not a bug! They prevent chaotic situations where incompatible versions coexist or where builds become unpredictable. They enforce a level of discipline that is crucial for reliable software development, especially within automated CI/CD pipelines.
Understanding Dependency Hierarchy and Version Conflicts
Dependencies rarely exist in isolation. Package "A" might depend on "B", and "B" might depend on "C". This creates a dependency tree or graph.
- Direct Dependencies: Packages you explicitly list in your project's configuration file (e.g., you install
expressin your Node.js project). - Transitive Dependencies: Dependencies required by your direct dependencies (e.g.,
expressmight depend onacceptsandcookie-signature; these become transitive dependencies for your project).
Visualizing this helps:
Your Project
├── Package A (Direct)
│   └── Package B (Transitive via A)
│       └── Package C (Transitive via B)
└── Package D (Direct)
    └── Package B (Transitive via D) <-- Potential Conflict Zone!
Now, imagine Package A requires version 1.0 of Package B, but Package D requires version 2.0 of Package B. This is a version conflict. How this is handled depends heavily on the specific package manager and language ecosystem:
- Some managers (like npm/yarn): Can often install multiple versions of the same package nested within the dependent packages (A gets B v1.0, D gets B v2.0). This avoids the conflict but can lead to larger install sizes and subtle issues if the package relies on global state or singletons.
- Other managers (like Python's pip with standard setups, Ruby's Bundler): Typically enforce a single version of each package in the final environment. They must find one version of Package B that satisfies the requirements of both A and D. If no such version exists, the installation fails, forcing you to resolve the conflict explicitly.
Understanding these concepts – dependency types, the dependency tree, and how your chosen package manager resolves versions and conflicts – is crucial. When a build breaks due to a dependency issue, being able to trace the dependency graph and understand the resolution strategy is key to diagnosing and fixing the problem quickly, preventing delays in your CI/CD pipeline.
This covers the introduction, the "why," the role of package managers, and the basic concepts of dependency hierarchy and conflicts, integrating several points from your notes.
Next Steps: Based on your notes, the logical continuation would be to delve into:
- Key Concepts in Practice: Semantic Versioning (SemVer) in detail, the critical role of Lock Files.
- Working with Package Managers: Common commands, creating package feeds (briefly), private vs. public repositories, authentication.
- Challenges of Dependency Management: Picking suitable dependencies, managing version conflicts in more detail (strategies, overrides), handling deprecated/unmaintained packages, security risks.
Okay, let's continue building the chapter, focusing now on the practical mechanisms that make dependency management work reliably: Semantic Versioning and Lock Files, and then touching upon package repositories and common tools.
Key Concepts for Reliable Dependency Management
Understanding the "what" and "why" of dependencies is the first step. Now, let's explore two critical concepts that package managers use to bring order to the potential chaos: Semantic Versioning (SemVer) and Lock Files.
Semantic Versioning (SemVer): Communicating Change
Imagine upgrading a dependency and suddenly your application breaks. Why did it happen? Was it a tiny bug fix or a complete overhaul of the library's functionality? This is where Semantic Versioning (SemVer) comes in. It's a widely adopted standard that provides a clear, structured way for package authors to communicate the nature of changes between different versions.
SemVer defines a version number format: MAJOR.MINOR.PATCH
MAJOR(e.g.,1.0.0->2.0.0): Incremented when you make incompatible API changes. This signals to users that upgrading will likely require changes in their own code. This is a breaking change.MINOR(e.g.,1.1.0->1.2.0): Incremented when you add functionality in a backward-compatible manner. Users should be able to upgrade without breaking their existing code that uses the library.PATCH(e.g.,1.1.1->1.1.2): Incremented when you make backward-compatible bug fixes. This should be the safest type of upgrade, addressing issues without changing functionality or breaking compatibility.
Why SemVer Matters for CI/CD:
- Predictability: It allows developers and automated tools (like package managers) to make more informed decisions about upgrades.
- Risk Assessment: A
MAJORversion bump immediately signals higher risk and the need for careful testing, whilePATCHupdates are generally considered low-risk. - Communication: It's a clear contract between the package author and the consumer about the impact of updates.
Version Ranges:
Package managers often allow you to specify dependency versions not just as exact numbers (1.1.2) but as ranges, leveraging SemVer:
- Caret (
^): AllowsPATCHandMINORupdates, but notMAJORupdates (e.g.,^1.1.2allows>=1.1.2and<2.0.0). This is common as it permits non-breaking feature additions and bug fixes. - Tilde (
~): Allows onlyPATCHupdates (e.g.,~1.1.2allows>=1.1.2and<1.2.0). This is more conservative, typically only accepting bug fixes. - Exact (
1.1.2): Pins the dependency to a specific version. No automatic updates. - Greater than/Less than (
>,<,>=,<=): Allows defining explicit boundaries. - Wildcard (
*,x): Allows any version (generally discouraged due to high risk).
Pre-release Tags: SemVer also supports tags like 1.0.0-alpha.1, 2.0.0-beta.3 for versions that are not yet considered stable for general release. Package managers usually won't install these unless explicitly requested or if the current version is also a pre-release.
The Catch: SemVer is only as reliable as the package authors adhering to it. A library author might accidentally introduce a breaking change in a PATCH release. While tools exist to help authors verify API compatibility (like API Extractor for TypeScript, japicmp for Java, or rust-semverver for Rust), diligent testing after any upgrade remains crucial. Despite its imperfections, SemVer provides significantly more clarity than arbitrary versioning schemes.
Lock Files: Ensuring Reproducibility
You've defined your dependencies and their acceptable version ranges (like ^1.1.2) in your manifest file (package.json, requirements.txt, etc.). You run npm install or pip install -r requirements.txt. The package manager performs its dependency resolution magic, finds compatible versions for everything (including transitive dependencies), and installs them. Great!
But what happens next week when your colleague clones the repository and runs the install command? Or when your CI server runs the install command? If a new PATCH or MINOR version of a dependency (or a transitive dependency) has been published in the meantime, and it falls within your specified range (^1.1.2), the package manager might install that newer version.
Suddenly, your colleague or the CI server has slightly different versions of the dependencies than you do. This can lead to the dreaded "it works on my machine!" problem, mysterious build failures, or subtle runtime bugs.
This is where lock files save the day. Common examples include:
package-lock.json(npm)yarn.lock(Yarn)pnpm-lock.yaml(pnpm)Pipfile.lock(Pipenv)poetry.lock(Poetry)composer.lock(Composer - PHP)Gemfile.lock(Bundler - Ruby)Cargo.lock(Cargo - Rust)
What a Lock File Does:
A lock file acts like a detailed snapshot or a "receipt" of the exact dependency tree that was resolved and installed at a specific point in time. It records:
- The exact version of every single package installed (including all direct and transitive dependencies).
- The specific location (URL or registry) from where each package was downloaded.
- Often, a checksum (hash) of the package content to ensure integrity.
- The resolved dependency structure, showing which version of a dependency satisfies which dependent package.
Why Lock Files are CRITICAL for CI/CD:
- Reproducibility: When a package manager sees a lock file present, it will typically ignore the version ranges in the manifest file for already listed dependencies and install the exact versions specified in the lock file. This guarantees that you, your colleagues, and your CI server all get the identical set of dependencies, every single time.
- Consistency: Eliminates variations caused by newly published package versions between installs.
- Faster Installs: Package managers can often optimize installation using the precise information in the lock file, skipping complex version resolution for locked dependencies.
Rule of Thumb: Always commit your lock file to your version control system (like Git). It's just as important as your source code and your primary manifest file (package.json, etc.) for ensuring reliable and reproducible builds.
(Self-check: You can often verify if your installed dependencies match your lock file using commands like npm ci instead of npm install, or checking npm ls --all --json | jq .problems for mismatches.)
Working with Package Managers and Repositories
With SemVer providing versioning clarity and lock files ensuring reproducibility, package managers interact with package repositories (also called registries or feeds) to find and download the actual software.
- Public Repositories: These are the large, well-known central hubs for specific ecosystems (e.g., npmjs.com for Node.js/JavaScript, PyPI (Python Package Index) for Python, Maven Central for Java/JVM languages, NuGet Gallery for .NET, RubyGems.org for Ruby, Crates.io for Rust). They host vast numbers of open-source packages. (Tip: Check the status pages of these repositories, like npm's status page, as outages can break CI pipelines.)
- Private Repositories: Organizations often set up their own private repositories (using tools like JFrog Artifactory, Sonatype Nexus, GitHub Packages, Azure Artifacts, GitLab Package Registry). These serve several purposes:
- Hosting Internal Packages: Sharing proprietary code libraries within the company without making them public.
- Security & Compliance: Acting as a curated proxy/cache for public repositories, allowing organizations to vet and approve external packages before developers can use them.
- Improved Performance/Reliability: Caching frequently used public packages locally can speed up builds and reduce reliance on external services.
- Fine-grained Access Control: Managing who can publish or consume specific packages.
Authentication: Accessing private repositories naturally requires authentication. Your package manager needs credentials (like tokens, API keys, or username/password combinations, often configured via environment variables or configuration files) to prove it has permission to download or publish packages. This is a common setup step required in CI/CD pipelines to allow them to fetch private dependencies.
Common Package Managers:
While the concepts are similar, different language ecosystems have their own popular tools:
- JavaScript/Node.js: npm, Yarn, pnpm
- Python: pip (often used with
venvorvirtualenv), Conda, Pipenv, Poetry - Java: Maven, Gradle
- .NET: NuGet (CLI:
dotnet add package) - Ruby: Bundler
- PHP: Composer
- Rust: Cargo
- Go: Go Modules
You'll use the specific commands of your chosen package manager (e.g., npm install, pip install, mvn dependency:tree, dotnet restore) to manage dependencies in your project.
Now we've covered the core mechanics (SemVer, Lock Files) and the infrastructure (Repositories, Authentication) that package managers use.
Next Steps: We can now dive into the common Challenges of Dependency Management as outlined in your notes:
- Identifying suitable dependencies (quality, maintenance, licensing).
- Managing version conflicts in detail (resolution strategies, overrides, tools for visualization).
- Handling deprecated or unmaintained dependencies.
- Dealing with security risks (vulnerability scanning, malicious packages).
- Keeping dependencies up-to-date (strategies, automation).
Okay, let's dive into the common hurdles you'll encounter when managing dependencies and how to approach them, especially within a CI/CD context.
Challenges of Dependency Management and How to Tackle Them
While package managers, SemVer, and lock files provide a strong foundation, managing dependencies effectively involves navigating several common challenges. Overcoming these is key to maintaining a smooth and reliable CI/CD pipeline.
1. Identifying Suitable Dependencies: Don't Just Grab Anything!
The ease with which package managers let us add dependencies is a double-edged sword. It's tempting to add a library for every minor task, but this can lead to "dependency bloat." Consider the humorous but insightful observation: a simple "Hello World" Spring Boot application might pull in hundreds of thousands of lines of code through its dependencies! (See Brian Vermeer's tweet).
Before adding a dependency, ask:
- Do I really need it? Can the functionality be achieved reasonably with the language's standard library or existing dependencies?
- Is it well-maintained? Check the repository (e.g., on GitHub). When was the last commit or release? Are issues being addressed? An abandoned library is a future liability, especially regarding security.
- Is it popular / widely used? While not a guarantee of quality, popular packages often benefit from more eyes spotting bugs ("Linus's Law") and have larger communities for support. Check download stats on the package repository (but be aware these can sometimes be inflated).
- What's the quality? Does it have good documentation? Does it have a test suite? Are there many open, critical bug reports? (See OWASP Component Analysis Guide).
- Is it secure? Have security vulnerabilities been reported for it? (Tools discussed later can help).
- What's the license? Ensure the dependency's license is compatible with your project's goals and licensing. Some licenses (like GPL) can have viral effects that might not be suitable for commercial closed-source software. (See Selecting Dependencies Guide).
- How does it fit? Is it compatible with your architecture and other key libraries?
Recommendation: If unsure between options, create separate branches in your code repository and experiment. See which one is easier to use, performs better, and integrates more cleanly. Invest a little time upfront to potentially save a lot of headaches later.
2. Managing Version Conflicts: The Tangled Web
This is perhaps the most common and frustrating dependency issue. As we saw earlier, conflicts arise when two or more dependencies in your project require incompatible versions of the same transitive dependency.
Visualizing the Problem: The first step in resolving a conflict is understanding where it's coming from. Use your package manager's tools to visualize the dependency tree:
- npm:
npm ls <package-name>(shows where a package is used),npm ls --all(shows the full tree, can be huge!) - Yarn:
yarn why <package-name> - pnpm:
pnpm why <package-name> - Maven:
mvn dependency:tree - Gradle:
gradle dependenciesorgradle :<module>:dependencies - pip:
pipdeptree(requires separate installation:pip install pipdeptree) - Bundler:
bundle viz(requires graphviz) - NuGet: Use Visual Studio's dependency visualizer, or external tools like
nuget-tree. - Cargo:
cargo tree
These tools help you trace why a specific version of a problematic package is being requested. You might find Project A needs LibZ v1, while Project B needs LibZ v2.
Resolution Strategies:
- Upgrade the Parent: Often, the simplest solution is to upgrade the direct dependencies (Project A and/or Project B in our example) to newer versions. Ideally, their authors will have updated their own dependencies, potentially resolving the conflict by agreeing on a newer compatible version of LibZ.
- Find a Compatible Set: Manually examine the version requirements of Project A and Project B for LibZ. Is there a single version of LibZ (perhaps an older or newer one than currently installed) that satisfies both constraints? You might need to adjust the version specified in your own project's manifest file or try installing a specific version.
- Use Overrides/Resolutions (Use with Caution!): Most package managers provide a mechanism to force a specific version of a transitive dependency, overriding what the intermediate packages requested.
- npm:
overridesfield inpackage.json(See RFC) - Yarn:
resolutionsfield inpackage.json(See Docs) - pnpm:
pnpm.overridesfield inpackage.json - Maven:
<dependencyManagement>section inpom.xml - Gradle:
resolutionStrategyblock - Cargo:
[patch]section inCargo.toml(See Docs) - Dart:
dependency_overridesinpubspec.yaml(See Docs)
Why use overrides? Sometimes necessary to apply urgent security patches to a transitive dependency when the direct dependency hasn't been updated yet, or to work around incorrect version constraints set by a library author.
The HUGE Risk: When you override a transitive dependency, you are forcing a package (say, Project A) to use a version of its dependency (LibZ) that its author likely did not test it with. You bypass their testing and potentially introduce subtle runtime bugs, data corruption, or crashes that only appear under specific conditions. You lose the benefit of the wider community testing that specific combination.
If You MUST Override:
- Apply the override as narrowly as possible (e.g., only for the specific package needing the fix, if your tool allows).
- TEST THOROUGHLY! Your own application's test suite is essential.
- Consider testing the intermediate package: As suggested in your notes, try checking out the source code of the direct dependency (Project A), applying the override to its dependencies (forcing the new LibZ version), and running its test suite. This gives some confidence that the direct dependency still functions correctly with the forced transitive version. (This can be complex, involving finding the right source version, potentially dealing with missing lock files, and setting up its build environment).
- Document why the override exists and create a plan to remove it once the direct dependency is properly updated.
- Isolate the Conflict: Sometimes, especially in complex graphs, tools or techniques might help identify the minimal set of conflicting constraints (an "unsatisfiable core"). While direct tooling for this isn't always user-friendly in package managers, understanding the concept helps focus debugging efforts.
The Bigger Picture: Frequent or complex dependency conflicts might indicate your project is becoming too large or monolithic, or that some dependencies have fundamentally diverged. It might be a signal to reconsider architectural boundaries.
3. Handling Deprecated or Unmaintained Dependencies
Sooner or later, you'll encounter a dependency that is no longer actively maintained or has been officially deprecated by its author. This poses several risks:
- Security Vulnerabilities: Unpatched flaws can be exploited.
- Incompatibility: It may stop working with newer versions of the language, runtime, or other dependencies.
- Bugs: Existing bugs will likely never be fixed.
- Lack of Features: It won't evolve to meet new needs.
What to do?
- Find an Alternative: Look for a currently maintained library that offers similar functionality. This is often the best long-term solution.
- Contribute Upstream: If it's open source and potentially just needs a maintainer, consider contributing fixes or even taking over maintenance if you have the resources and willingness.
- Fork and Maintain Internally: If no alternative exists and the code is critical, you might fork the repository and apply necessary fixes yourself. This creates an internal maintenance burden.
- Remove the Dependency: Re-evaluate if you still truly need the functionality. Can you rewrite it using other tools or standard libraries?
- Accept the Risk (Temporary & Documented): If the dependency is small, has limited scope, thoroughly audited, and replacement is difficult, you might accept the risk for a limited time, but document this decision and the associated risks clearly.
4. Addressing Security Risks
Dependencies are a major vector for security vulnerabilities. A flaw in a single, popular library can affect thousands of applications.
- Known Vulnerabilities (CVEs): Most ecosystems have tools that scan your dependencies (using your manifest and lock file) and compare the versions against databases of known vulnerabilities (like the National Vulnerability Database (NVD), GitHub Advisory Database).
- Tools:
npm audit,yarn audit,pip-audit, OWASP Dependency-Check (Java, .NET, etc.), Snyk, GitHub Dependabot security alerts, GitLab dependency scanning. - CI Integration: Running these scanners automatically in your CI pipeline is crucial. A failing security scan should ideally fail the build, preventing vulnerable code from reaching production.
- Malicious Packages: Attackers publish packages designed to steal data, install malware, or disrupt systems. Tactics include:
- Typosquatting: Naming a package very similar to a popular one (e.g.,
requestvs.requesst). - Dependency Confusion: Tricking package managers into downloading a malicious internal-looking package name from a public repository instead of your private one.
- Maintainer Account Takeover: Compromising a legitimate maintainer's account to publish malicious versions.
- Hidden Malice: Including obfuscated malicious code within an otherwise functional package.
- Mitigation Strategies:
- Use Trusted Sources: Prefer official repositories. Be extra cautious with obscure or unverified sources.
- Vet Dependencies: Apply the "Identifying Suitable Dependencies" checks rigorously. Look for signs of legitimacy (verified publisher, recent activity, sensible code).
- Use Lock Files: Prevents unexpected package updates that might introduce malicious code.
- Scan Regularly: Use vulnerability scanning tools.
- Least Privilege: Ensure your build and runtime environments have only the minimum necessary permissions.
- Consider Disabling Install Scripts: Some package managers (like npm) allow packages to run arbitrary scripts during installation (
"preinstall","postinstall"). These can be a vector for attack. Running installs with flags likenpm install --ignore-scriptscan mitigate this specific risk, but may break packages that legitimately need setup scripts. It's a trade-off. - Checksum/Signature Verification: Package managers often verify checksums automatically. Some systems support cryptographic signatures for stronger authenticity guarantees, though adoption varies.
- Avoid
curl | bash: As noted, piping arbitrary scripts from the internet directly into a shell bypasses many security checks (like repository vetting, versioning, signature verification, potential HTTPS downgrade attacks) and makes reproducible builds harder. Prefer installing via a package manager whenever possible. If you must download manually, verify checksums/signatures provided by the author (obtained securely!) and consider scanning the downloaded artifact.
5. Keeping Up with Updates and Changes
Dependencies aren't static. They evolve to fix bugs, improve performance, add features, and patch security holes. Staying reasonably up-to-date is important, but requires a strategy.
- Why Update? Security patches are paramount. Bug fixes can improve stability. Performance enhancements are beneficial. New features might simplify your own code. Maintaining compatibility with the ecosystem often requires updates.
- Manual vs. Automated Updates:
- Manual: You periodically check for updates (e.g.,
npm outdated,mvn versions:display-dependency-updates) and apply them deliberately. Gives more control but is time-consuming and easy to forget. - Automated: Tools like GitHub Dependabot or Renovate Bot automatically detect new versions, open pull requests/merge requests to update dependencies, and often include release notes. This drastically reduces the effort but requires trust in your test suite.
- The CI Safety Net: Automated dependency updates are only safe if you have a comprehensive automated test suite running in CI. The pull request opened by Dependabot/Renovate should trigger your full build and test pipeline. If tests pass, merging the update is likely low-risk (especially for PATCH/MINOR SemVer bumps). If they fail, it prevents a broken dependency from being merged.
- Strategies:
- Update Frequently: Small, frequent updates (especially patches) are often easier to manage and debug than massive updates after long periods.
- Dedicated Pipeline/Schedule: Some teams have separate pipelines or dedicated time slots (e.g., "update Fridays") specifically for reviewing and merging dependency updates.
- Security First: Prioritize updates that fix known security vulnerabilities.
- Rollback Plan: Know how to revert a dependency update if it causes unexpected production issues (usually involves reverting the merge commit and redeploying).
- Monitor Breaking Changes (
MAJORupdates): These require careful planning, reading changelogs, potential code modifications, and extensive testing. Don't automate merging MAJOR version bumps without careful consideration.
Second-Order Effects: As noted, aggressive security patching requirements can force frequent, sometimes breaking, updates. This can increase development friction, make troubleshooting harder (as changes ripple through layers), and potentially lead teams to take riskier shortcuts like overusing overrides or inlining dependencies (which hides them from scanners). This highlights the need for robust testing and potentially architectures that better isolate components (like microservices, or well-defined modules within a monolith, perhaps using tools like NetArchTest, Packwerk, or Deptrac mentioned in your notes).
This section covers the main challenges outlined in your notes.
Next Steps:
- We could add a section specifically on Best Practices Summary/Checklist.
- Flesh out the Exercises section.
- Review and refine the flow and examples.
- Consider adding a brief section on Managing Dependencies in Monorepos if relevant to your audience.
- Discuss
devDependenciesvsdependenciesand prioritizing security/updates based on environment (as per your notes).
Okay, let's continue by adding the section on distinguishing dependency types (like devDependencies) and then summarizing the key takeaways into a Best Practices Checklist. Finally, we'll flesh out the exercises.
Understanding Dependency Types: Production vs. Development
Most package managers allow you to classify your dependencies based on where they are needed. The most common distinction is between runtime dependencies (often just called dependencies) and development dependencies (devDependencies).
- Dependencies (Runtime): These are packages required for your application to run in production. They include libraries that provide core functionality, frameworks your application is built on, utility functions used at runtime, etc. If you're baking that cake, these are the flour, sugar, eggs – the essential ingredients that must be in the final product.
- DevDependencies (Development): These are packages needed only during the development and build process. They are not required for the application to run in production. Examples include:
- Testing frameworks (Jest, Pytest, JUnit)
- Linters and formatters (ESLint, Prettier, Black, Checkstyle)
- Build tools and bundlers (Webpack, Rollup, TypeScript compiler, Babel)
- Code generation tools
- Documentation generators
Why Make the Distinction?
- Smaller Production Footprint: When deploying your application, you typically only install the runtime
dependencies. This results in smaller artifact sizes (e.g., smaller Docker images), faster deployment times, and a reduced attack surface (fewer packages installed in the production environment). Package manager commands often have flags for this (e.g.,npm install --production,pip install --no-dev). - Prioritization of Issues: When dealing with dependency updates or security vulnerabilities, you can often prioritize fixing issues in runtime
dependenciesoverdevDependencies. A vulnerability in a runtime library directly impacts your production application's security. A vulnerability in a testing framework, while still important to fix, primarily affects the development environment and CI pipeline, making it slightly less critical (though still needing attention!). - Clarity: It clearly documents the purpose of each dependency in your project.
How to Determine the Type?
- Rule of Thumb: If your code directly
imports orrequires a package, and that code runs in the production environment, it's usually a runtimedependency. If the package is only used for building, testing, or local development tasks, it's adevDependency. - Finding Unused Dependencies: Sometimes dependencies get added and later become unused. Tools or manual analysis can help identify these. Your note about using
straceto track file access during a build is an advanced technique for this, aiming to see which files weren't read and thus might be unnecessary (though care is needed as files could be needed for runtime, not just build time). More commonly, specialized tools exist for different ecosystems to detect unused dependencies (e.g.,depcheckfor Node.js).
Ensure you correctly classify dependencies when adding them (e.g., npm install <package> vs. npm install --save-dev <package> or yarn add <package> vs yarn add --dev <package>).
Best Practices for Dependency Management in CI/CD
Let's consolidate the key strategies into a checklist for effective dependency management, particularly relevant in a CI/CD context:
Setup & Foundation:
- [ ] Choose Your Tools Wisely: Select a standard package manager for your language/ecosystem. Understand its dependency resolution strategy.
- [ ] Use Lock Files: Always commit your
package-lock.json,yarn.lock,Pipfile.lock, etc., to version control. Use installation commands that respect the lock file in CI (e.g.,npm ci,yarn install --frozen-lockfile,pip install -r requirements.txtafterpip freeze). - [ ] Leverage SemVer: Understand Semantic Versioning (
MAJOR.MINOR.PATCH). Use version ranges (^,~) judiciously in your manifest (package.json, etc.) but rely on the lock file for reproducibility. - [ ] Classify Dependencies: Distinguish between runtime (
dependencies) and development (devDependencies) to optimize production builds and prioritize issue resolution. - [ ] Use a Centralized Repository (if applicable): Consider private repositories (Artifactory, Nexus, GitHub Packages) for internal libraries and as a vetted cache/proxy for public ones. Secure access using proper authentication, especially in CI.
Adding & Selecting Dependencies:
- [ ] Be Mindful: Don't add dependencies frivolously. Evaluate the need, maintenance status, popularity, license, and security posture before adding a new package.
- [ ] Check Licenses: Ensure dependency licenses are compatible with your project.
Maintenance & Security:
- [ ] Keep Dependencies Updated: Regularly update dependencies, especially to patch security vulnerabilities. Prioritize runtime dependency security issues.
- [ ] Automate Updates (with caution): Use tools like Dependabot or Renovate to automate update proposals via Pull Requests.
- [ ] Integrate Security Scanning: Run dependency vulnerability scans (
npm audit,snyk, OWASP Dependency-Check, etc.) automatically in your CI pipeline. Fail the build on critical vulnerabilities. - [ ] Have a Robust Test Suite: Comprehensive automated tests are your safety net when upgrading dependencies, whether manually or automatically.
- [ ] Pin System Dependencies: In Dockerfiles or CI environment setup scripts, pin versions of OS packages (
apt-get install package=version) and base images (ubuntu:20.04instead ofubuntu:latest) to avoid unexpected failures caused by upstream changes. Use flags like--no-install-recommendswithapt-getcarefully, understanding it might break packages needing those recommended dependencies.
Troubleshooting & Advanced:
- [ ] Visualize Dependencies: Learn to use tools (
npm ls,mvn dependency:tree,pipdeptree) to understand the dependency graph when troubleshooting conflicts. - [ ] Use Overrides Sparingly: Only use version overrides/resolutions as a last resort for conflicts or urgent security patches. Test thoroughly and document the reason. Plan to remove overrides when possible.
- [ ] Monitor Repository Status: Be aware that public repositories can have outages; having a local cache/proxy can mitigate this risk for CI.
By following these practices, you can significantly reduce the friction caused by dependency issues and build more reliable, secure, and maintainable CI/CD pipelines.
Exercises
Let's put your knowledge into practice! Choose the exercises relevant to the primary language/ecosystem you work with or want to learn about.
- Explore Your Project's Dependencies:
- Take an existing project (or a sample one).
- Identify its manifest file (e.g.,
package.json,pom.xml,requirements.txt). - Use your package manager to list all direct dependencies.
- Use your package manager to display the full dependency tree (including transitive dependencies). Can you spot any packages that appear multiple times at different versions (if your ecosystem allows) or that are required by several different direct dependencies?
- Identify the lock file. Examine its contents – can you find specific versions and locations for a few key dependencies?
- Simulate a Conflict (If possible/safe):
- (Use a sample/test project for this!) Find two libraries in your ecosystem that are known to depend on different MAJOR versions of a third, common library.
- Try installing both libraries into your test project.
- Observe the error message or the resolution strategy your package manager uses (does it fail? does it install multiple versions?).
- Use the visualization tools (from Exercise 1) to see the conflict in the tree.
- Try resolving the conflict by:
- Finding newer versions of the parent libraries (if they exist) that might agree on the transitive dependency.
- (Carefully) Using your package manager's override/resolution mechanism to force a specific version of the transitive dependency. Does the installation succeed now? (Note: The application might still break at runtime!)
- Dependency Audit:
- Take an existing project (or clone an older open-source project).
- Run a security audit using your ecosystem's tool (e.g.,
npm audit,yarn audit,pip-audit, OWASP Dependency-Check). - Analyze the report. Are there vulnerabilities? Are they in direct or transitive dependencies? Are they in runtime or development dependencies?
- For one identified vulnerability, research it online (using the CVE number if provided). Understand the potential impact.
- Try updating the specific package(s) to fix the vulnerability. Did this introduce any new issues or conflicts?
- Investigate a Dependency:
- Choose a direct dependency from one of your projects.
- Find its source code repository (e.g., on GitHub).
- Check its maintenance status: When was the last commit/release? Are issues actively being handled?
- Check its license. Is it permissive (MIT, Apache 2.0) or copyleft (GPL)?
- Look at its own dependencies. Does it pull in many other libraries?
- Pinning System Dependencies:
- Find a simple
Dockerfileonline that installs a package usingapt-get install <package-name>. - Modify it to pin the package to a specific version. You might need to search online for how to find available versions for that package in the base image's distribution (e.g., using
apt-cache madison <package-name>). - Change the
FROMline to use a specific version tag (e.g.,ubuntu:22.04) instead oflatest. Why is this important for reproducibility in CI/CD?
Staying Ahead of Deprecations
GitHub Actions dependencies change frequently: Node.js runtime versions are deprecated, runner images are removed, action APIs change, and commands like set-output and save-state get retired. Missing these notices can cause silent breakage or sudden pipeline failures.
Subscribe to these GitHub Changelog feed categories and route new posts to email or your project management tool with due dates:
- deprecation (RSS)
end of life,breaking changes,removal,brown out(not all posts are tagged consistently — consider subscribing to the full changelog as well)
A sample of past deprecations worth knowing about:
- Node 12 removed from runner → Node 16 → Node 20 transitions
set-output/save-statecommands replaced withGITHUB_OUTPUT/GITHUB_STATEfile approachactions/checkout@v1and@v2superseded by@v3/@v4- Ubuntu 18.04 runner image removed (December 2022)
- macOS 10.15 runner image removed (August 2022)
- CodeQL Action v1 deprecated
- Source Imports REST API deprecated
Treat deprecation notices the same way you treat a dependency security alert: acknowledge, schedule, and resolve before the deadline.
Dependabot and Updating Your Dependencies
Setting up Dependabot in your GitHub repository automates the process of dependency updates, ensuring that your project regularly receives the latest patches and versions of libraries and packages, which improves security and performance.
Typically, alerts have a priority associated with them such as critical and high. Start by addressing the critical and high priority alerts if you are receiving a lot of alerts initially.
High Toil Tasks
- Managing Dependabot Alerts: High volume, false positives, and manual merging can flood teams with unnecessary work. Many repositories with numerous dependencies can be flooded with alerts, making triage difficult.
- Troubleshooting Failing Workflows: Unclear error messages, inconsistent environments, and lack of monitoring make debugging time-consuming.
- Maintaining Self-Hosted Runners: Infrastructure management, resource scaling, and software updates require ongoing effort.
- Managing Secrets and Credentials: Manual rotation, insecure storage, and auditing create security risks.
Reducing Toil
- Auto-merge: Configure Dependabot to automatically merge updates for low-risk dependencies or version ranges.
- Ignore Rules: Define ignore rules to filter out unwanted alerts for specific dependencies or versions.
- Grouped Updates: Enable Dependabot to group related updates into a single PR to reduce review volume.
- Structured Logging and Monitoring: Capture useful debugging information and monitor workflow performance.
- Runner Infrastructure-as-Code: Manage runner infrastructure with code (e.g., Terraform) for automation and reproducibility.
- Dedicated Secrets Manager: Use a dedicated secrets management solution for secure storage, access control, and automated rotation.
Setting Up Dependabot
- Navigate to your repository on GitHub.
- Create a new file at
.github/dependabot.yml. - Add configuration:
version: 2
updates:
  - package-ecosystem: "npm"
    directory: "/"
    schedule:
      interval: "weekly"
    open-pull-requests-limit: 10
    commit-message:
      prefix: "chore"
      include: "scope"
    ignore:
      - dependency-name: "express"
        versions: ["4.x.x"]
- Commit the file — GitHub automatically activates Dependabot based on your configuration.
- Review and merge the pull requests Dependabot raises.
For advanced configurations and ecosystem-specific settings (Maven, NuGet, Docker, etc.), refer to the Dependabot documentation.
Setting up Dependabot not only maintains dependency health but also improves security by ensuring vulnerabilities are patched promptly.
Caching and optimization
Introduction
Definition of caching
Benefits of using caching
-
Also useful for increasing reliability of external services
-
Can reduce cost (VM running time), especially if the VM is expensive as you're normally charged for runtime and not how much CPU it uses
When not to cache
Setting up pipeline caching
Knowing your intermediate build artifacts
-
How to handle different types of files and assets that need to be cached, such as build artifacts, dependencies, and test results
-
Some artifacts do and don't benefit from compression, and some compression algorithms might be more efficient for certain types of data, you'd have to experiment with them
-
Whether symlinks have to be preserved or modification dates (tar might be good in this case)
-
Consider decompression algorithms that can be streamed, so you can decompress the data while downloading
-
Some files may be large, others might be a set of small files. This will impact how the files are stored and if any preprocessing is required. For example, one tar file will probably be better to compact the data, but tarring a large file might not provide any benefits (other than to provide a container.) Some very large files may have to be downloaded quickly, so a distributed cache system could be better.
-
Some artifacts can be quickly regenerated, some might be more complex. Consider this when prioritizing the caching strategies.
-
If you're building a dependency that is used by multiple teams, then it could instead be built once and then included as a dependency (e.g., through a CDN or as-is as an artifact) and then could be cached more widely. This also means it could exist on a more permanent storage medium which could improve the performance characteristics.
Creating a cache
Uploading and downloading a cache
Configuring cache timeout and size
Debugging and Troubleshooting
Cache metrics
-
Hit rate (is my cache being used?)
-
Miss rate (how often can it be used?)
-
Usage/size (is it too big/small?)
-
Performance/latency (is it taking forever to download?)
-
Eviction rate (are items just being cached never to be used again and evicted immediately? This might not show up in the miss rate) Does the eviction policy have to change? Is there enough disk space to hold the cache?
Incorrect or missing cache key
-
If cache string is too long, just hash it
-
The cache key determines which cache should be used, so if the key is incorrect or missing, the cache won't be used or the wrong cache will be used. This can lead to slower build times or incorrect build results.
Caching too many or too few files
- Caching too many files can lead to slow cache retrieval times and can also cause issues when different builds use different versions of the same file. Caching too few files can cause a slower build time because files that should be cached have to be rebuilt.
Using an old or non-existent cache
-
If the cache is not updated or invalidated when it should be, old or non-existent files can be used, leading to incorrect build results or slow build times.
-
Preventing vendor lock-in
-
When you construct your workflows, you want to make sure that you can run them locally. This is important because:
-
Fast feedback loop for debugging or adding steps to the build process. This is because some parts of the CI/CD workflow are proprietary and must be run on the CI server itself. This means that one may resort to manually updating the workflow file to update it, resulting in a very slow and frustrating experience.
-
An understanding of what is happening behind the scenes when your workflow is running, and to prevent "magic". It's important to have a good understanding of the build process and what processes do what, because debugging requires extensive knowledge of the system. It is also important to ensure its correctness, because if you do not understand what the desired state is or what the program is doing, then it is not possible to verify it.
-
When you run/test software locally, then it depends on a specific environment. If your CI/CD system is too complicated, then it might mean that it is not possible to run it within any reasonable approximation locally. This means that it can be difficult to know if your software is working as intended, because the two environments are different and may introduce subtle bugs.
-
If there is too much vendor lock-in, then it might be difficult to move to a new platform in the future because it would cause the existing workflows to have to be rewritten, verified, and require additional staff training. This means that your business requirements are partially dependent on what the vendor seeks to offer, which may or may not be aligned with your business model. Therefore, it is theoretically possible to be constrained by outside limitations on which you do not have control over.
-
Some things are difficult to replicate locally, but are not impossible. For example, caching actions usually upload to a vendor-specific location that is encapsulated within a vendor's proprietary action.
-
Even if actions/workflows are open-source, ultimately they depend on the infrastructure and idioms of the infrastructure that they are implemented within.
-
Other things
-
By key
-
Writing safe cache keys
-
Dependencies on package-lock.json, OS, and node and npm versions
-
Make sure to add a delimiter that isn't used by any scripts, so that values are not erroneously concatenated together and create a new cache key that may already exist. For example "3" and "39" or "33" and "9". If you use dashes then it becomes 3-39 or 33-9 but they cannot be mixed up.
-
Use a monotonically increasing number that is incremented when you want the cache to be reset
-
npm scripts may cause node_modules to not be cacheable because it can mutate it depending on the source code
-
Also, npm scripts may cause the node_modules not to be cacheable if software is installed outside of node_modules (for example, npm_config_binroot scripts | npm Docs.)
-
How consistent does it need to be?
-
For example, npm caches don't have to match the packages that are being installed, because it will backfill with items from the external registry. However, if the items are only being fetched from the cache, then there is a risk it could be out of date. Check the ETags of resources.
-
Checking the hash of the downloaded file can still help (even if you have to re-download it) because the downloaded file might in and of itself be an installer, so this would save on CPU time re-installing it
-
Advanced auto-expiring cache rules (TTL)
-
Expire after date
-
Expire if file matches hash
-
Expire after end of day, end of week, end of month
-
Expire after day of the week
-
Expire after X days (use X cache keys with +1 added to each of them?)
-
Expire if size of folder is too large
-
Algebra with keys (ORing, ANDing, XORing, etc.) ORing would be a cartesian product
Cost and Resource Management
GitHub Actions charges for compute time (minutes) and storage (artifacts, packages). These tips help keep both under control without sacrificing developer experience.
Workflow Duration and Timeouts
- Monitor how long your workflows take. Duration typically grows with the codebase — sudden increases indicate a problem.
- Lower the default 6-hour timeout to match your actual workflow duration plus a reasonable buffer (e.g., if your workflow usually takes 20 minutes, set a timeout of 40–60 minutes).
- Use Meercode (free tier available) or GitHub's own workflow analytics to visualize duration trends.
Concurrency Control
Limit concurrent builds per pull request to one. Auto-cancel older runs when a new commit is pushed:
concurrency:
  group: ${{ github.workflow }}-${{ github.ref }}
  cancel-in-progress: true
For deployment workflows, set cancel-in-progress: false instead — you don't want two deploys racing each other.
Branch and Trigger Selection
- Avoid running CI on branches that have no open pull request (except
main/master). - Don't trigger expensive workflows on documentation-only changes:
on:
  push:
    paths-ignore:
      - '**.md'
      - 'docs/**'
Artifact Storage
- Compress artifacts before uploading. Be explicit about what files you include.
- Set retention periods intentionally: PR/dev builds 1–3 days; release artifacts 30–90 days.
- Exclude files not needed for deployment or debugging (intermediate object files, test fixtures).
Test and Analysis Efficiency
- Fast fail first: Run the quickest-failing tests first in a separate early job.
- Selective testing: For monorepos, use path filters or tools like
nx affectedto run only tests relevant to changed code. - Static analysis: Only run static analysis tools if someone is actively looking at and acting on the results.
Dependabot Cost Considerations
Dependabot PRs trigger CI just like developer PRs. Limit open Dependabot PRs with open-pull-requests-limit in dependabot.yml:
version: 2
updates:
  - package-ecosystem: "npm"
    directory: "/"
    schedule:
      interval: "weekly"
    open-pull-requests-limit: 5
Use grouped updates to batch multiple dependency bumps into a single PR.
Appendix
Chapter X: File Transforms
Warning: this chapter may require significant revisions as some file transformations suggested are not best practice.
Introduction to File Transforms
As software moves through a CI/CD pipeline – from a developer's commit to a running application in production – the code itself is only part of the story. Configuration files, deployment manifests, resource pointers, and various other assets often need modification to suit the specific stage, environment, or build context. Database connection strings change between development and production, API keys differ for staging and live environments, feature flags might be toggled, and build numbers or commit identifiers need to be embedded for traceability.
Attempting to manage these variations manually is fraught with peril. It's slow, repetitive, incredibly error-prone, and fundamentally undermines the goals of automation and reliability that CI/CD aims to achieve. Maintaining separate branches for different environments' configurations is an anti-pattern that leads to merge conflicts and drift.
This is the domain of File Transforms. Within the CI/CD pipeline, file transforms are the automated processes responsible for altering file content, structure, names, or even their presence, ensuring that the application artifact is correctly configured and prepared for its intended destination. They act as the pipeline's intelligent find-and-replace, file organizer, and context-aware modification engine.
What are File Transforms?
A File Transform is the automated alteration of file properties – content, name, or inclusion status – executed as a step within a CI/CD pipeline. Instead of requiring manual intervention or complex branching strategies, the pipeline applies predefined rules and uses variables (often environment-specific) to modify files after they are checked out from source control but typically before they are packaged into the final deployable artifact or deployed directly.
Why are File Transforms important in CI/CD pipelines?
Observing real-world pipelines reveals the critical roles file transforms play:
- Environment Consistency: They ensure applications behave predictably across Development, Testing, Staging, and Production by applying the correct settings for each environment automatically. This eliminates a common source of "works on my machine" issues.
- Automation & Speed: They replace manual editing, significantly speeding up the deployment process and reducing the chance of human error in repetitive tasks.
- Security: Transforms allow sensitive data (like production passwords, API keys, certificates) to be injected during the pipeline run from secure stores (like CI/CD secrets management) rather than being committed to source control. Commands like
run: sed -i 's/#{KEYSTORE_KEY_PASS}#/${{ secrets.KEYSTORE_KEY_PASS }}/g' android/key.propertiesare prime examples of this secure injection pattern. - Maintainability: A single template or base configuration file can be kept in source control (e.g.,
config.template.json,deployment.template.yaml). Transforms then specialize this template for different contexts, reducing redundancy and making configuration easier to manage. - Traceability & Context Injection: Dynamic information like commit SHAs, build numbers, or release tags can be embedded into files during the build process (e.g.,
run: TAG=$(echo $GITHUB_SHA | head -c7) && sed -i 's|<IMAGE>|...:'${TAG}'|' ...). This helps in tracking deployed versions and debugging. - Artifact Correctness: Transforms ensure the final artifact contains only the necessary files, correctly named and configured for the target runtime (e.g., renaming
index.htmlto200.htmlfor SPA hosting, removing test files).
Types of File Transforms
Based on common operations seen in CI/CD scripts, file transforms generally fall into these categories:
Content modification
This involves altering the data inside a file. It's the most frequent type of transform.
- Placeholder/Token Replacement: Substituting predefined placeholders (like
__ConnectionString__,#{ApiKey}#,<IMAGE>) with values from CI/CD variables or secrets, often using tools likesed. - Example:
run: sed s/{PASSWORD}/$PASSWORD/ sample.txt - Dynamic Value Injection: Inserting build-specific data (commit SHA, tag, build ID) into configuration or deployment files.
- Example:
run: TAG=$(echo $GITHUB_SHA | head -c7) && sed -i 's|<IMAGE>|...:'${TAG}'|' ...deployment.yml - Structured Data Manipulation: Modifying specific fields within JSON, YAML, or XML files using tools designed for those formats.
- Example (JSON):
run: jq '.production = true' ops/config/router.default.json > router.config.json - Conditional Content: Commenting/uncommenting sections, enabling/disabling features, or adjusting file content based on environment variables.
- Example (Comment Toggling - Conceptual):
run: sed -i '/<debug enabled="true"/s/^/<!--/; s/$/ -->/' web.config(usingsedto comment out an XML line). - Example (Path Fixing):
run: sed -i "s+$PWD/++g" coverage.xml(Removing build-specific absolute paths).
File renaming
Changing the name of a file, typically using mv (Linux/macOS) or ren/Move-Item (Windows/PowerShell).
- Environment/Config Selection: Renaming a template or an environment-specific file to the standard name expected by the application.
- Example:
run: cp config.production.json config.json(Usingcpto select, butmvis also common). - Example:
run: mv .github/mock-google-services.json app/src/debug/google-services.json - Artifact Naming: Adding context (version, platform, timestamp) to output files or adjusting names for specific deployment targets.
- Example:
run: mv target/${{ matrix.target }}/debug/namecheap-ddns namecheap-ddns-${{ github.sha }}-${{ matrix.target }} - Example (SPA Fallback):
run: mv build/index.html build/200.html
Inclusion and exclusion rules
Controlling which files are part of the final package, often by deleting unwanted files using rm (Linux/macOS) or Remove-Item (Windows/PowerShell) before packaging.
- Cleanup: Removing temporary files, build logs, intermediate artifacts, or source control metadata.
- Example:
run: rm -rf node_modules package-lock.json - Example:
run: rm tests/Feature/ExampleTest.php - Example:
run: rm -rf .git - Selective Packaging: Ensuring only necessary binaries, assets, or configuration files for the target environment/platform are included.
- Example (Conceptual):
run: rm **/*.debug.so(Remove debug symbols). - Example (Seen):
run: find ./bin/targets/ -type d -name "packages" | xargs rm -rf {}(Removing platform-specific package directories).
Note: Changing file permissions using chmod (e.g., chmod +x gradlew) is extremely common in CI/CD scripts found in the wild, but it modifies file metadata rather than content or name, so it's often considered part of environment setup rather than a core file transform type.
Common File Formats for Transforms
While any text file can be transformed, these formats are frequent targets due to their role in configuration:
- XML: Used heavily in .NET (
web.config,app.config) and Java ecosystems (Mavenpom.xml, Ant build files). Tools like XDT (XML Document Transform) orxmlstarletprovide powerful manipulation capabilities. - JSON: The standard for web APIs and modern application configuration (Node.js, frontend frameworks).
jqis a popular and powerful command-line tool for JSON transformation, seen often in scripts. - YAML: Favored for its readability in configuration (Kubernetes, Docker Compose, Ansible, CI/CD pipelines themselves) and applications. Transformations often use
sedfor simple substitutions or employ templating engines (Jinja2, Helm, Go templates). - INI / Properties Files: Simple key-value formats common in various platforms (Python, PHP, legacy Java).
sedis very effective for substituting values based on keys or placeholders.
Practical Examples and Exercises
Let's illustrate these concepts with common scenarios, drawing on patterns observed in real pipelines.
Transforming configuration files for different environments
Scenario: Setting a database connection string and enabling production logging in appsettings.json for a .NET application.
- Template (
appsettings.template.json):
{
"ConnectionStrings": {
"DefaultConnection": "__DbConnection__"
},
"Logging": {
"LogLevel": {
"Default": "Debug"
}
},
"FeatureFlags": {
"NewUI": false
}
}
- CI/CD Variables (Production Scope):
DB_CONN_PROD(Secret):Server=prod-db.example.com;...ENABLE_NEW_UI:true- Transform Commands (using
sedfor secrets,jqfor structure):
# 1. Copy template to working file
run: cp appsettings.template.json appsettings.working.json

# 2. Inject secret connection string using sed (often simpler for direct replacement)
run: sed -i 's|__DbConnection__|${{ secrets.DB_CONN_PROD }}|' appsettings.working.json

# 3. Use jq to modify log level and feature flag, outputting to final file
run: jq '.Logging.LogLevel.Default = "Warning" | .FeatureFlags.NewUI = ${{ env.ENABLE_NEW_UI }}' appsettings.working.json > appsettings.json

# 4. Clean up working file (optional)
run: rm appsettings.working.json
Updating file paths and resource references
Scenario: Setting the correct base URL in a frontend configuration based on the deployment environment.
- Template (
src/config.js):
const config = {
apiUrl: "__ApiBaseUrl__",
// ... other settings
};
export default config;
- CI/CD Variable (Staging):
API_URL_STAGING:https://staging-api.example.com - Transform Command:
run: sed -i 's|__ApiBaseUrl__|${{ env.API_URL_STAGING }}|' src/config.js
Modifying template files for dynamic content
Scenario: Setting the Docker image tag in a Kubernetes deployment.yaml based on the commit SHA.
- Template (
k8s/deployment.template.yaml):
apiVersion: apps/v1
kind: Deployment
# ... metadata ...
spec:
template:
spec:
containers:
- name: my-app
image: my-registry/my-app:<IMAGE_TAG> # Placeholder
- Transform Command:
# Use shell command substitution and sed
run: TAG=$(echo $GITHUB_SHA | head -c7) && sed -i 's|<IMAGE_TAG>|'${TAG}'|' k8s/deployment.template.yaml
(Note: Using Kustomize or Helm variables is generally preferred here, see "When to Avoid Transforms").
How do I specify which files to transform?
- Direct Path: Most commands (
sed,mv,cp,rm,jq) take direct file paths.run: rm tests/Feature/ExampleTest.php - Wildcards/Globbing: The shell expands patterns like
*,?,**. run: rm -rf **/*.logrun: chmod +x scripts/*.shfindcommand: For complex selections based on name, type, modification time, etc., combined withxargsor-exec.run: find ~/.m2 -name '*SNAPSHOT' | xargs rm -Rf
How do I change specific values or text within a file?
sed: Stream Editor, excellent for pattern-based text replacement (substitutions, deletions). The most common tool seen for simple replacements.run: sed -i 's/old-text/new-text/g' file.txtjq: Command-line JSON processor. Powerful for reading, filtering, and modifying JSON data structures.run: jq '.key.subkey = "new_value"' input.json > output.jsonawk: Pattern scanning and processing language. Useful for more complex text manipulation and data extraction thansed.run: awk '/START/{flag=1;next}/END/{flag=0}flag' file.txt > extracted.txtperl: Powerful scripting language often used for complex text processing via one-liners.run: perl -pi -e 's/foo/bar/g' file.txt- Dedicated Tools:
xmlstarletoryq(for YAML) offer similar structured modification capabilities for their respective formats. - Templating Engines: (Jinja2, Helm, etc.) Render entire files from templates and variables, offering loops, conditionals etc. (Invoked via their specific CLIs or libraries).
How do I include or exclude specific files from the transformation process?
- Exclusion by Deletion: The most direct method seen in scripts is deleting unwanted files/directories before packaging or deployment.
run: rm -rf node_modules .git coveragerun: find . -name '*.tmp' -delete- Inclusion by Copying/Moving: Explicitly copy or move only the desired files into a staging area or the final artifact location.
run: mkdir staging && cp target/*.jar staging/run: mv build/app-release.apk release-artifacts/- Important Distinction: This pipeline-level inclusion/exclusion is different from build tool ignores (
.dockerignore,.gitignore, Maven excludes) which prevent files from entering the build context or artifact in the first place (see "When to Avoid Transforms").
How do I rename a file during the transformation process?
- Use the standard OS move/rename command:
- Linux/macOS:
mv oldname newname(Example:run: mv build/index.html build/200.html) - Windows (PowerShell):
ren oldname newnameorMove-Item oldname newname
Can I perform multiple transformations on a single file?
Yes, absolutely. This is done by sequencing the transformation commands in your pipeline script. Each command operates on the output of the previous one.
steps:
- name: Copy template run: cp config.template.xml config.xml
- name: Remove debug attributes (using xmlstarlet or similar) run: xml ed -L -d "/configuration/system.web/compilation/@debug" config.xml # Example command
- name: Replace connection string placeholder run: sed -i 's|DB_CONN|${{ secrets.PROD_DB }}|' config.xml
- name: Set API URL variable run: sed -i 's|API_URL|${{ env.PROD_API_URL }}|' config.xml
How do I handle environment-specific settings during file transformation?
This is the core purpose. The strategy involves:
- Store Settings: Define environment-specific values (connection strings, API keys, URLs, feature flags) as variables or secrets in your CI/CD system (e.g., GitHub Secrets, GitLab CI Variables, Azure DevOps Variable Groups). Scope them appropriately (e.g., to 'Production' or 'Staging' environments).
- Use Placeholders: Define clear placeholders in your template files (e.g.,
#{DatabasePassword}#,__ApiUrl__,${SERVICE_ENDPOINT}). - Reference Variables in Transforms: Use the CI/CD system's syntax to access these variables within your
runcommands.
- Secrets:
${{ secrets.MY_SECRET }} - Environment Variables:
${{ env.MY_ENV_VAR }}or$MY_ENV_VAR(depending on shell/context). - Example:
run: sed -i 's/__API_KEY__/${{ secrets.PROD_API_KEY }}/g' config.js
- Conditional Logic (Less Common in Transforms): Sometimes, pipeline logic might choose which transform to apply or which file to copy/rename based on an environment variable (e.g.,
if [ "$ENVIRONMENT" == "production" ]; then cp config.prod .env; fi).
When to Avoid Transforms / Use Build & Deployment Tools Correctly
While file transforms using pipeline scripts (sed, mv, rm, etc.) are common and sometimes necessary, over-reliance on them can lead to brittle, inefficient, and hard-to-maintain pipelines. Often, tasks performed via script-based transforms are better handled by build systems, runtime configuration patterns, or deployment tools. Consider these alternatives:
- Configuration & Secrets Management:
- Avoid: Using
sedorjqto inject dozens of settings or complex structures into base configuration files during the build. - Prefer:
- Runtime Environment Variables: Design applications (using libraries like
dotenv, frameworks like Spring Boot, .NET Core Configuration) to read configuration directly from environment variables set by the CI/CD deployment step or the execution environment (e.g., Kubernetes Pod definition). - Configuration Management Services: Use AWS Parameter Store/Secrets Manager, Azure App Configuration/Key Vault, HashiCorp Vault, Google Secret Manager. Applications fetch configuration dynamically at startup or runtime. Secrets remain securely managed outside the pipeline scripts.
- Framework-Specific Configuration Layers: Leverage features like .NET's
appsettings.Environment.jsonor Spring Profiles, where environment-specific files automatically override base configurations based on an environment indicator (likeASPNETCORE_ENVIRONMENTorSPRING_PROFILES_ACTIVE).
- Artifact Content Management (Inclusion/Exclusion):
- Avoid: Copying everything into a build context (like a Docker stage) and then using
rm -rfextensively to remove unwanted development dependencies, test files, source code, or.gitdirectories just before packaging. - Prefer:
- Build/Packaging Tool Excludes: Utilize
.dockerignoreto prevent files from entering the Docker build context at all. Use.gitignorewhen creating archives directly from Git. Configure build tools (Maven, Gradle, Webpack) to exclude unnecessary files/directories from the final artifact (e.g., test resources, dev dependencies). - Multi-Stage Docker Builds: Perform the build, including dev dependencies and tests, in an initial "builder" stage. In the final, lean "runtime" stage,
COPY --from=builderonly the necessary compiled code, runtime dependencies, and assets. This creates smaller, more secure final images.
- Deployment Parameterization:
- Avoid: Using
sedor similar tools to modify Kubernetes YAML, Terraform HCL, CloudFormation templates, or other deployment manifests to insert image tags, replica counts, resource limits, or environment-specific settings during the pipeline. - Prefer:
- Deployment Tool Variables/Templating: Use the native parameterization features of your deployment tool:
- Helm:
helm install/upgrade ... --set image.tag=$TAG --set replicaCount=3or use values files. - Kustomize: Use overlays and patches (
kustomize edit set image ...). - Terraform: Use input variables (
terraform apply -var image_tag=$TAG ...). - CloudFormation: Use parameters.
- Ansible: Use variables and templates (Jinja2).
- Dependency Management:
- Avoid: Using
wgetorcurlto download dependencies (libraries, tools) directly withinrunsteps if a standard package manager exists. - Prefer:
- Package Managers: Use
npm install,pip install -r requirements.txt,mvn dependency:resolve,go get,apt-get,choco install, etc. These tools handle dependency resolution, versioning, and often integrate with CI caching mechanisms more effectively. - CI Platform Tool Installers: Use actions like
actions/setup-node,actions/setup-java, etc., which manage tool installation and path configuration.
Guideline: Use pipeline file transforms primarily for tasks specific to the pipeline's execution context (like intermediate cleanup, setting permissions on downloaded tools) or for very simple, well-defined substitutions. Delegate artifact construction logic (what goes in the package) to build tools and environment-specific configuration loading to the application runtime or dedicated deployment tools.
Challenges and Difficulties in File Transforms
Despite their utility, script-based file transforms introduce challenges:
- Dealing with complex file structures: Simple text replacement (
sed) is fragile when dealing with nested structures in JSON, YAML, or XML. Accurate modification often requires format-aware tools (jq,yq,xmlstarlet, XDT) which have steeper learning curves and can still be complex for intricate changes. Regex complexity insedcan quickly become unreadable. - Debugging and troubleshooting transformation issues: Transforms often run silently on build agents. If a transform fails or produces incorrect output (e.g., invalid JSON/XML, wrong value injected), diagnosing it can be difficult. Errors might only appear later when the application fails to start or behave correctly. Requires careful logging (
echo,cat), inspecting intermediate files (if possible), and simulating locally. - Handling different file encodings and formats: Ensuring the transformation tool correctly reads and writes files with the appropriate encoding (UTF-8, UTF-16, etc.) and line endings (LF vs. CRLF) is crucial. Incorrect handling leads to corrupted files. Mixing formats (e.g., transforming JSON within an XML comment) can be awkward.
- Managing dependencies and side effects of transformations: The order of transformations matters. A
sedcommand might unintentionally change a section needed by a subsequentjqcommand. Ensuring idempotency (running the transform multiple times doesn't cause harm) is important but can be tricky to guarantee with complex scripts. Accidental modification of the wrong files due to broad wildcards is a common risk. - Cross-Platform Compatibility: Scripts using Linux-specific commands (
sed,awk,grep,mv,rm) will fail on Windows build agents unless compatibility layers (like Git Bash or WSL) are used. PowerShell equivalents (Select-String,ForEach-Object,Move-Item,Remove-Item) have different syntax. Writing truly cross-platform scripts requires care or conditional logic.
Best Practices for File Transforms
To make file transformations more reliable and maintainable:
- Use Placeholders and Environment Variables: Standardize on a clear placeholder syntax (e.g.,
__TokenName__,${VariableName},#{Setting}#). Map these directly to environment variables managed securely by your CI/CD system. Prefer simple token replacement over complex regex when possible. - Keep Templates in Source Control: Check in the base or template files (e.g.,
web.template.config,config.template.json,deployment.template.yaml) with placeholders, not the transformed, environment-specific files. - Version Control Transformation Logic: The pipeline YAML containing the
runcommands is your versioned transformation logic. For complex transforms using separate scripts (Perl, Python, PowerShell), check those scripts into source control too. For XML transforms, check in the.xdtfiles. - Choose the Right Tool (and know when not to use transforms): Use simple
sedfor basic text replacement. Usejq/yq/xmlstarletfor structured data when necessary. Use templating engines (Helm, Jinja2) for complex generation logic. Use shell scripts (bash,powershell) for sequencing commands or custom logic. Critically evaluate if the task belongs in the pipeline transform step or should be handled by build tools or runtime configuration (see "When to Avoid Transforms"). - Validate Transformed Files: Where feasible, add a pipeline step after transformation but before deployment to validate the syntax or schema of the resulting files (e.g.,
jq . config.json > /dev/null,yamllint,xmllint --schema ...). - Secure Secret Handling: Always use the CI/CD platform's secret management features (
${{ secrets.VAR }}). Ensure secrets are masked in logs. Inject secrets as late as possible, preferably during the deployment step to the specific environment, rather than embedding them in build artifacts that might be stored elsewhere. - Idempotency: Design scripts and commands so they can be re-run safely without causing errors or unintended side effects (e.g., use
mkdir -p, ensuremvorrmcommands handle non-existent files gracefully if necessary). - Test Your Transforms: For complex transformation logic (especially in separate scripts), consider writing unit or integration tests for the transformation itself. Test the end-to-end pipeline thoroughly in non-production environments.
- Clear Logging: Ensure
runsteps produce meaningful output. Useechocommands strategically to indicate what transform is happening and on which files, especially before and after critical steps. Avoid logging secret values.
Practical Examples of cd in CI/CD
Here are concrete examples showcasing the various usages of cd within a GitHub Actions context:
1. Going Back a Directory:
- name: Move to Parent Directory
run: cd ..
This navigates to the parent directory of the current working directory.
2. Conditional Directory Change:
- name: Enter Optional Directory
run: cd optional-directory && true
This attempts to change to optional-directory. The && true ensures the step succeeds even if the directory doesn't exist, preventing workflow failures.
3. Going Back Two Directories:
- name: Move Two Levels Up
run: cd ../../
This navigates two levels up in the directory hierarchy.
4. Home Directory (Workspace):
- name: Access Workspace Directory
run: |
cd ~/
# Perform operations within the workspace
This moves to the workspace directory, represented by ~, which is the default directory for your workflow.
5. "Working-directory" for Specificity:
- name: Build Project
working-directory: ./project-folder
run: |
npm install
npm run build
This uses the working-directory option to specify a different starting directory for this step, enhancing clarity and control.It's important because CD only applies to this step and it gets reset.For all the subsequent steps. Also, this is important when you are using scripts in different languages. So using the working directory means that you can use an action for example. And thought well, just change that you're not able to run a script plus an action at the same time. So in this way working directory is a little bit more agnostic.
Complete Example:
name: CI/CD Pipeline
on:
push:
branches:
- main
jobs:
build:
runs-on: ubuntu-latest
steps:
-
uses: actions/checkout@v3
-
name: Navigate to Project
working-directory: ./my-project
run: |
echo "Current directory: \$(pwd)"
cd src
echo "Building in directory: \$(pwd)"
# ... build commands ...
This example shows how cd and working-directory can be used to navigate directories and control the context for different steps in your workflow, promoting organization and clarity in your CI/CD processes.
Setting up Static Analysis in GitHub Actions for a React App
Here’s a guide to setting up static analysis actions in your React app’s GitHub Actions workflow:
1. Define Your Workflow:
name: Static Analysis
on: push: branches:
- main pull_request: branches:
- main
jobs: static-analysis: runs-on: ubuntu-latest
steps:
-
name: Checkout code uses: actions/checkout@v3
-
name: Setup Node.js uses: actions/setup-node@v3 with: node-version: "18" # Use your desired Node version
-
name: Install dependencies run: |
npm install
Static analysis steps below
2. Choose Your Tools:
ESLint (Catches code style and potential errors):
- name: Run ESLint uses: actions/eslint-action@v3 with: files: "src/**/*.js" eslint-path: "./node_modules/eslint" # Adapt if ESLint is installed globally
Prettier (Enforces consistent code formatting):
- name: Run Prettier uses: actions/prettier@v3 with: files: "src/**/*.js"
Stylelint (Analyzes CSS and SCSS for style errors and inconsistencies):
- name: Run Stylelint uses: stylelint/actions/lint@v2 with: configFile: ".stylelintrc.json" # Adjust config file path if necessary files: "src/**/*.{css,scss}"
SonarQube (Detects bugs, code smells, and security vulnerabilities):
- name: SonarQube Scan uses: sonarsource/sonarqube-scan-action@master env: SONAR_TOKEN: ${{ secrets.SONAR_TOKEN }} # Store your SonarQube token securely with: projectBaseDir: "."
Configure SonarQube project settings as needed
3. Customize Configuration:
- Create configuration files (e.g., .eslintrc.json, .prettierrc.json, .stylelintrc.json, sonar-project.properties) for each tool in your project root.
- Use eslint-config-react-app for a good starting point for React-specific ESLint rules.
4. Fail on Errors (Optional):
Configure actions to fail the workflow if issues are found. This enforces code quality. For example:
- name: Run ESLint uses: actions/eslint-action@v3 with: files: "src/**/*.js" eslint-path: "./node_modules/eslint" failOnError: true
Streamlined Guide to Setting Up a Continuous Deployment Pipeline
This guide provides a concise overview of setting up a continuous deployment (CD) pipeline, focusing on key concepts and best practices:
1. Creating the Pipeline:
-
Use your CI/CD tool and connect it to your artifact repository.
-
Choose a clear and descriptive pipeline name (e.g., "Production - [Software Name]").
2. Deployment Infrastructure:
-
Decide on your hosting environment (cloud providers like AWS, Google Cloud, Azure, or on-premise).
-
Key cloud provider offerings include:
-
Container orchestration (Kubernetes services like ECS, AKS, GKE)
-
Serverless platforms (AWS Lambda, Azure Functions, Google Cloud Functions)
-
Infrastructure as Code (IaC) tools (CloudFormation, ARM, Deployment Manager)
-
Monitoring and Logging services
-
Security and Compliance tools
-
Artifact Management services
-
Carefully evaluate hosting providers based on:
-
Existing relationships and contracts
-
Support contracts and SLAs
-
Use-case support (e.g., IaC compatibility)
-
3. Continuous Deployment Pipeline Steps:
-
Artifact Retrieval: Fetch the correct artifact versions from your repository.
-
Containerization (if applicable): Build and package your application within a Docker container.
-
Artifact Packaging: Prepare all necessary files, configurations, and dependencies.
-
Security Scanning: Scan the built container for vulnerabilities.
-
Cleanup: Remove temporary files to ensure a clean deployment package.
-
Container Registry: Push the versioned container image to your registry.
-
Stakeholder Notification: Inform relevant parties about the deployment.
-
Deployment: Automate the deployment process to your chosen infrastructure.
-
Use safe deployment practices like blue-green or rolling deployments for minimal downtime.
-
Infrastructure Provisioning: Utilize IaC to manage and automate infrastructure setup.
-
Monitoring and Rollback: Implement robust monitoring to detect and address issues during and after deployment. Consider strategies like rollbacks or roll forwards.
4. Release Management:
-
Gradual Rollout: Incrementally release new features using techniques like blue-green deployments to minimize risk and impact on users.
-
Monitoring and SLAs: Establish comprehensive monitoring to track application health, performance, and user experience. Set and meet Service Level Agreements (SLAs) to ensure application availability.
Key Considerations:
-
Feature Flags: Utilize feature flags to control the release of new features independently from deployments.
-
Database Migrations: Carefully plan and execute database schema changes, especially in environments with multiple application versions.
-
Testing: Perform thorough pre-deployment and post-deployment testing to catch environment-specific issues.
By following these guidelines, you can establish a robust and efficient continuous deployment pipeline that enables faster and more reliable software releases.
What is IaC (infrastructure as code?)
-
So, you have your application sitting as build artifacts. That's not super useful to the customer. How do you get it to the customer? Well, it has to be deployed to an environment accessible to the customer, usually via the internet.
-
Continuous Deployment (CD) uses the build artifacts from Continuous Integration (CI) and deploys them to production using Infrastructure as Code (IaC). This isn't just about running scripts; CD involves comprehensive processes like testing and monitoring. By leveraging CI artifacts, trust is maintained, ensuring that what was tested is what gets deployed. Essentially, Continuous Deployment spans the journey from a developer's initial feature development to its live presence in production.
-
Continuous Delivery, on the other hand, offers the flexibility to release updates whenever desired, without it being compulsory. Regular releases, as advocated by CD, foster resiliency and facilitate rapid adaptation to user feedback. Smaller, frequent changes are easier to manage and rectify if issues arise. Plus, with the unpredictable ways customers might use features, it's advantageous to remain agile and receptive to evolving requirements.
-
Note: Reusing CI artifacts in CD instills trust; otherwise, the integrity of the entire CI process would be questioned because the artifacts that were tested are different from what is being deployed.
-
When we talk about IaC, it means Infrastructure as Code. It is a way to specify which infrastructure needs to be provisioned for your application to run.
-
In the past, this may have been a set of instructions, written down on what the current infrastructure looked like and how to set it up. For example, "Click on this button, type in this field, click on Create VM, name it this, etc.". Documentation quickly goes out of date, and it's error-prone and difficult to follow these steps. Not to mention that any configuration changes, no matter how small, in one environment without updating the docs can cause configuration drift: an unfortunate occurrence for managing complex infrastructure.
-
The reason why manual infrastructure deployments are not very CI/CD-like, is because they're complicated. They live in people's heads as a fragmented system. And since computers can't mind-read yet, it's not easily possible to re-create that environment, should something go wrong, or if you want to maintain a known good state. Did we change such-and-such last week? Memory is fickle.
-
Why is it related to CD?
-
The CD pipeline would take the template provided in VCS and run the terraform script on your cloud provider and prepare the infrastructure. This should happen all automatically.
-
What are the principles or values of IaC?
-
Idempotency: no matter how many times you deploy, you'll get the same thing.
-
Immutable: immutable means something that cannot change. Therefore, instead of updating the infrastructure, which could cause configuration issues, replace everything with a new, deployed copy.
-
Composable. Create other puzzle pieces that fit into other architecture patterns.
-
Why should I use IaC?
-
Consistency. Everytime you roll out, it will be exactly the same.
-
Reproducibility.
-
Version controlled, thus, it is a single source of truth. Easily rollback to a previous architecture, find what changed (i.e., auditability), or inspect the current architecture.
-
Speed and a fast feedback loop. Reduce trying to manage your infrastructure and trying to track what you changed manually, which could lead to configuration drift between different environments (e.g., QA/dev and prod.) The issue with configuration drift is that it makes it difficult for developers to have a fast feedback loop, because they can't trust that their changes will work in prod if it works in dev because the environments might be too different. Tracking changes in dev to reflect in prod is also tedious.
-
Security.
-
What providers do I have for infrastructure deployments? What are some ways I can run IaC code? There are several tools and providers available for infrastructure deployments:
-
Terraform: A cloud-agnostic tool that uses HCL.
-
AWS CloudFormation: Specific to AWS, it uses JSON or YAML templates.
-
Azure Resource Manager (ARM): Used for deploying resources in Microsoft Azure.
-
Google Cloud Deployment Manager: For Google Cloud Platform (GCP) resources.
-
Ansible: An open-source automation tool that can handle tasks such as configuration management and application deployment.
-
Chef and Puppet: Configuration management tools that allow you to define the state of your systems and then automatically enforce that state.
Certainly! Infrastructure as Code (IaC) is a practice in which infrastructure (networks, virtual machines, load balancers, and connection topology) is provisioned and managed using code and software development techniques. The "advanced beginner" in software or IT might be familiar with setting up environments manually through user interfaces or direct commands. IaC takes this to the next level, leveraging code to automate these tasks. Here's a more detailed breakdown tailored for an advanced beginner:
-
Code, Not Manual Configuration: Instead of manually setting up databases, servers, or networks, in IaC, these resources are defined in code files. This is similar to how a software developer writes programs to execute tasks instead of doing them manually.
-
Version Control: Just like software code, infrastructure code can be versioned. This means you can maintain a history of changes, track alterations, and revert to previous configurations if needed. This is typically managed using version control systems like Git.
-
Consistency and Reproducibility: By defining infrastructure as code, you ensure consistency across different environments. If you've ever heard the phrase "It works on my machine", IaC helps to solve that problem. Everyone uses the same configuration files to set up their environments, which can significantly reduce discrepancies between development, staging, and production setups.
-
Automation and Speed: With IaC, tools can read the code files and set up the environment automatically. This can drastically reduce the time to provision or scale infrastructure. No more manual setups or lengthy procedures.
-
Documentation: The code itself acts as documentation. Instead of keeping separate documentation that details how infrastructure is set up (which can become outdated quickly), the IaC configuration provides an up-to-date representation of the infrastructure setup.
-
Tools and Platforms: Various tools enable IaC. Some of the popular ones include:
- Terraform: An open-source tool that allows you to define infrastructure in a descriptive manner across various cloud providers.
- AWS CloudFormation: A service from Amazon Web Services that lets you describe AWS resources in JSON or YAML format.
- Ansible, Puppet, Chef: Configuration management tools that can be used to set up and manage the state of servers.
-
Drift Management: One of the challenges in infrastructure management is "drift", where the actual state of the infrastructure deviates from its expected state. IaC tools can often detect and correct drift, ensuring that the infrastructure remains consistent with the code definition.
-
Safety and Testing: With IaC, you can apply software testing principles to your infrastructure. Tools allow for validation and testing of infrastructure code before it's applied, reducing potential issues in real-world deployments.
In essence, IaC is the practice of treating infrastructure setup and configuration with the same rigor, precision, and automation as application code. This approach results in more efficient, consistent, and reliable operations, bridging the gap between software development and operations.
Instead, we can define what we want our infrastructure to be, in a template, usually called an IaC template. They can be written in multiple programming languages--this one is written in a language called "Bicep".
param location string = resourceGroup().location

resource myVM 'Microsoft.Compute/virtualMachines@2019-07-01' = {

name: 'myVM'

location: location

properties: {

hardwareProfile: {

vmSize: 'Standard_DS1_v2'

}

osProfile: {

computerName: 'myVM'

adminUsername: 'adminuser'

adminPassword: 'YourStrongPasswordHere'

}

storageProfile: {

imageReference: {

publisher: 'MicrosoftWindowsServer'

offer: 'WindowsServer'

sku: '2016-Datacenter'

version: 'latest'

}

osDisk: {

createOption: 'FromImage'

}

}

networkProfile: {

networkInterfaces: [

{

id: resourceId('Microsoft.Network/networkInterfaces', 'myVMNic')

}

]

}

}

}
-
What you can immediately see here is that there is now a single source of truth: the infrastructure does not live in people's heads, fragmented, it exists, documented, and very clear instructions that computers can understand. If you need a new environment, well, just redeploy. It's squeaky-clean, and brand-new, just like the last one.
-
This enables quite a few things.
-
First, we can now deploy our template pretty much anywhere (well, on the same cloud provider, more on that in a bit.) I would like to have a test environment that is essentially identical to production. Bam. Done. Now I can test my code freely, and know that it's likely to work on production.
-
What if I made a mistake, and changed a network adapter but I forgot what settings I changed? IaC templates are part of your repository, and are version controlled with the other code. Therefore, just revert back. All of the changes are logged, so you know what went wrong and how to fix it.
-
All of a sudden, we have more traffic. All we need to do is just deploy the template again (well...)
-
Ultimately, they allow for much more control, reproducibility, and experimentation, albeit indirectly.
-
This process should be very easy to do. It should be a single button process, with potentially the ability to select which version to deploy. It should be clear which version is the latest version. All versions should be in a state where they can be deployed, because the CI pipeline has validated the changes. Note: depending on your process, you may have to validate the changes through a QA process. Normally, unfinished features are behind feature flags, which allows them to be conditionally enabled only on QA's devices in production. This allows QA to test the features while also not slowing down development on unrelated features, and allows deployment to continue to take place.Let's recap what we have discussed so far.
-
The puzzle-pipeline, from inception to art gallery, is much like a software development pipeline. In the puzzle metaphor, the employees were able to send their assistant to check if the picture of the puzzle looks good in the frame in the art gallery. The assistant can work while the employees are still working on the puzzle. In the case of software development, the pipeline provides a set of checks (such as building and testing the code) that provides developers with a baseline level of confidence that their changes work. Instead of sending it to the art gallery via an assistant (who provides feedback quickly), the pipeline is able to run autonomously, quickly and provide feedback. This allows the software developers to make quick changes on the fly.
-
Since the pipeline runs after each developer merges their changes, then therefore the application is always integrated, developers have access to other developers' changes, and since the tests ran, it gives a semblance of high code quality and instills confidence in the application.
-
Much like the puzzle, the repository is like the puzzle with the grippy board. The grippy board that helps hold the puzzle pieces together while working on it isn't put into the final product, it is just used for development purposes, but everyone who is working on the puzzle needs it.
-
This is a collaborative process, provided by CI, that, through code review and small PRs, allow for some semblance of the big picture and allows people to work together to incrementally add the puzzle pieces together.
Continuous Monitoring
Look at Grafana "exemplars" and "correlations". and application topology map.
-
In the world of software development, the role of continuous monitoring can't be overstated. It's the heartbeat that tells us how our applications are performing, where they're faltering, and how users are interacting with them.
-
Imagine this: You've just released a new feature. Is it working as expected? Is it meeting user needs? These questions underscore the necessity of a robust monitoring system. But, while having a myriad of dashboards might seem helpful, it's not just about accumulating data. It's about distilling this data into actionable insights, helping teams swiftly locate and address issues.
Why Monitor?
- The purpose of monitoring extends beyond troubleshooting. It offers insights into user behavior, providing key business metrics like daily or monthly user engagement. Such data isn't just numbers; it's a reflection of user satisfaction and product viability.
Characteristics of Effective Monitoring
-
Coverage: Traceability through the system is crucial. This means tracking a user request from initiation to conclusion. Correlation IDs or trace IDs can be invaluable in this regard.
-
Relevant Data: Log entries should provide meaningful information. Whether it's an error message, user ID, application version, or the server it's running on, every bit of data aids in piecing together the bigger picture.
-
Strategic Logging Points: Position logs where they can offer the most diagnostic value.
-
Priority Management: Assign importance to your logs, ensuring critical logs don't get buried under the noise.
-
Freshness: Updated, real-time data often carries more value than stale information.
Making Sense of Data
- Collecting data is only the initial step. The challenge lies in understanding this data, and will likely take 95% or more of your time. Visualizing it, plotting graphs, and discerning patterns will likely consume a significant portion of your time. Graphs, while they should be comprehensive, must remain straightforward, avoiding needless complexities that could mislead or confuse.
The Importance of Feedback
- Consider a jigsaw puzzle shipped to a customer. How do we know if it reached in perfect condition? Did the colors appeal to the user? Did they find the image appealing? It's this feedback, collected via monitoring, that guides further iterations of the product. Continuous monitoring, embedded within the CI/CD pipeline, offers constant feedback on performance, errors, and user engagement.
Telemetry: A Close Look
- Telemetry is the backbone of continuous monitoring. It involves collecting data from the platforms where applications are run. This data is gathered on both the server, providing metrics like CPU usage and memory consumption, and within the application, capturing user-specific metrics. These might include engagement levels or user satisfaction metrics.
Monitoring Frequency
-
By definition, continuous monitoring is unceasing. Data, much like a river, keeps flowing into the central hub, offering a live pulse of the application.
-
So the reason why you don't monitor absolutely everything is because there's a cost of monitoring. Otherwise it's just more every single instruction in every single line of code. And the reason is because of that is monitoring is designed to.Be a little bit pragmatic. So you have to kind of know like, OK, what am I trying to actually solve for this?But it was my goal. Am I trying to reason about the program's execution?To find a bug. So for example, am I trying to reduce entropy?With the program execution, when someone runs something, then these logs generated and I can retrace the program steps, which case you don't need to log every single line of code likely.You see the log you know inside of the if statements and potentially some.Variables are useful.Information.Like that and.Yeah, there definitely is a way to avoid logging, which is, you know, just debugging. But.Debugging is kind of more of a.To all that's.Used to kind of fix something as a means to an end and it is kind of difficult to use a sustainably because.Logs provide more context.And there's sometimes that you can't use it to debugger, like you know, if some customer reproduced at some point or something like that layer code or that's never be totally different in the logs can capture that. But you can't go back in time with the debugger and try to figure out what exactly happened. It's very difficult to take dumps and such.Um.So.And another thing is if you matter too much, um, you have to do something with this data. And if you just have way too many logs while Southern application performance, if it's got too much, if you're using like mobile applications, for example, well, you know, it's, you know, you're pumping out like hundreds of megabytes of logs.Over the user cellular connection or the ASB battering ram and such.The other part is actually like how to process it. And if you're logging like way too much stuff, you're spending a lot of these CPU cycles and.Storage and self storing all this stuff.And it's even more difficult to audit as well.Have you said that like you, too little is also?Definitely probably a larger problem so.Log 2 matches. Probably better to do that instead of logging too little I'd say.
-
And another thing, sometimes people differentiate it.It's metrics and locking and analytics so.Logging is just kind of the act of just like saying ohh you know, the program breached.This point or something like that, uh, metrics are kind of more about.Ah.Logging things that can be graphed, so for example like CPU usage would be considered a metric. You could have a graph that shows like over time.How much memory using, how much CPU you're using inside, etc. Technically these are logs, but there could be a bit differently to kind of process differently as well. They're not really associated to a code path per se, it's just like.Diagnostics for the for the whole machine.
-
And let's try to do this for another application. The first step is with logging. It's normally to help to reduce the entropy of your program state.So in this case.We have the application initializers and displays some stuff to the user. Let's just kind of go over like a very basic logging exercise. Let's also go into correlation IDs to show how you can trace the request back from users web browser all the way throughout the application. What request the application?Makes, et cetera, and we'll see why later, why this is really helpful and important.And this usually requires doing some manual setup with the conference doctor. No per se.Like.That this is associated to this request or something like that.So yeah, I think it's going to be really useful.
-
So the first thing I probably do is bring up our code that we have and then figure out where it probably be good spots to do.Some logging and then as we make our application more complicated, we'll see kind of how this scales.Umm.As well and a lot of don't necessarily have committed through every single application this call like you can admit it only like 10% of the time or 5% of the time. Just get like a good understanding of what's happening, especially there's a lot of users hitting that same point. You don't necessarily need like 100% of the time, it's always.Logging that because it could be bad for performance. But again, it kind of depends on your use case. You're probably going through this a little bit more as well.
import React, { useState, useEffect } from 'react';

import axios from 'axios';

// Data fetching logic extracted to a custom hook

function useWeather(apiKey) {

const [weather, setWeather] = useState(null);

const [loading, setLoading] = useState(true);

const [error, setError] = useState(null);

useEffect(() => {

async function fetchWeather() {

try {

const response = await axios.get(`http://api.openweathermap.org/data/2.5/weather?q=London&appid=${apiKey}`);

setWeather(response.data);

setLoading(false);

} catch (error) {

setError(error);

setLoading(false);

}

}

fetchWeather();

}, [apiKey]);

return { weather, loading, error };

}

function Weather() {

const apiKey = process.env.REACT_APP_WEATHER_API_KEY;

const { weather, loading, error } = useWeather(apiKey);

if (loading) return <p>Loading weather\...</p>;

if (error) return <p>Error fetching weather</p>;

return (

<div>

<h1>{weather.name}</h1>

<p>Temperature: {weather.main.temp}°C</p>

<p>Condition: {weather.weather[0].description}</p>

</div>

);

}

export default Weather;
Let's explore where it might be beneficial to implement logging in an application. Proactive logging is crucial as it allows for quicker bug resolution without needing additional log deployments. For example, in an application that handles weather data, important log points could include:
-
Initial API Key Check: Verify if the API key is set but avoid logging sensitive information.
-
Conditional Statements: Log within conditions handling loading errors or operational states to trace the application flow and identify issues.
-
Performance Metrics: Log the duration it takes to load the weather data, potentially using Web Vitals to capture timing from the initial request to the display on the user's screen.
-
Error Handling: Implement an error boundary to log errors without crashing the application, providing a fallback UI with support links for a better user experience.
-
Telemetry and Metrics: Beyond basic logging, collect telemetry on user interactions, such as location queries, to inform higher-level management reports and monitor system performance.
Additionally, consider logging retry attempts in server communications to correlate them with session IDs, enhancing error analysis and improving the overall reliability of data capture in your application. This approach to logging not only aids in immediate troubleshooting but also enhances long-term application stability and user satisfaction.
Web Vitals primarily focuses on assessing the performance of applications, particularly useful for single-page applications, though adaptable for others. It measures high-level performance metrics like initial load time and various user interaction metrics to detect performance regressions. Installation and usage are straightforward: simply install the Web Vitals package and integrate it into your application.
It's designed to capture events such as input delays during usage, continuously updating to reflect the maximum input delay observed. This requires careful database query structuring to ensure only the latest event per session is considered, avoiding duplicates. This is because Web Vitals may send multiple events as it updates the maximum observed values while the application is in use. If the user exits prematurely, some data may not be transmitted, although web beacons could mitigate this issue, albeit with limited library support.
Reliability and Performance Metrics
- It's impractical to keep a human eye on the influx of data at all times. This is where automated alerts come in, signaling when intervention is necessary. Using reliability metrics like ICE (Ideal Customer Experience) and ACE (Adjusted Customer Experience), teams can gauge application performance against established benchmarks.
Introduction
-
Let's set the scene. You've released a new feature, or want to ensure that your website or app is still usable by the customers. You can use monitoring to make sure that your customers expectations (with regard to automated tests and performance) remain valid.
-
There is one thing about monitoring, however. It's likely that your dashboards aren't going to tell you precisely where the problem is, therefore, you should make your code flexible, and develop a good monitoring strategy to know where to log or to debug next. If that was the case, then, well, you better get coding, because you're going to need a lot of dashboards. This might not be a worthwhile strategy. Part of monitoring is about reducing execution entropy and to reduce disorder by tracing execution. It's important to be able to know how to read a dashboard, which metrics are important, which are less important, and how this corresponds with the actual system, including how to trace requests and look up logs.
-
Monitoring isn't all about trying to find bugs. It's also useful for understanding user behavior, for example, how many users use the app per day/month or how many users use the platform. These are very important business KPIs.
-
Things that a good monitoring system has:
-
Coverage. The ability to trace a request through the entire system. This doesn't mean that you will necessarily know precisely what happens at each step, only that it goes through a system, but it got messed up for example. There has to be a complete path from the user's web browser all the way to the request being serviced, and back again. Teams should provide a correlation id with requests, or provide the capability for you to add your own trace id to the request so that you can track it and helps the other team know if you need help. This might mean that you need to add monitoring to many other intermediary services.
-
Useful data. The events/metrics/logs have to be useful and contain relevant information which can be used to debug. For example, if a user is trying to sign up, but fails, then it might be useful to log their user id or the associated error message. One of the goals should be to reduce execution entropy. Think about it from the person using the logs to ascertain previous system behavior. Are they able to find out where the request failed within your application? How much are they able to narrow it down? It might also include the application's version, along with other versioning information, such as what server it is running on.
-
Useful logging points. This is similar to useful data, but the logging should be in places where it matters, and has a capability to help debug the application, for example, usually before and after control-flow statements, but this depends.
-
Priority/importance. Not all logs are useful, but some are. This doesn't mean you shouldn't log anything that is not critical, it just means to assign a priority to your logs. This allows you to easily filter for the high-important items, providing a better signal to noise ratio.
-
Frequency. Stale or old data is normally less useful than fresh, up to date data, much like a stream.
-
Collecting data is the "easy" part. What do I do with all of this data? This is called sensemaking, literally, making sense of the data. IThe act of aggregating, graphing, plotting, and transforming your data is likely to take 90% or more of your time. It's important that you have clear graphs that represent your data accurately, and you might find it useful to graph the same data using multiple data visualization formats multiple times to get different perspectives. Show Me the Numbers: Designing Tables and Graphs to Enlighten: Few, Stephen: 9780970601971: Books - Amazon.ca This book is intended for how to design boring graphs. Boring graphs aren't a bad thing, you don't want to be distracted by unnecessary visuals which might alter your perception of the data, or to distract you. Graphs should be used to enlighten, not confuse (at least within the technical realm.)
Why is monitoring important?
-
After the puzzles have been shipped to our customers, how do we know if they liked them? Were they satisfied? We can put our phone number in the box so that they can call us if they liked it or didn't like it.
-
Some of the other questions we'd like answered are:
-
Was the puzzle squished in shipping?
-
Do the colors look nice?
-
Did the image look ok?
-
Instead of spending more and more and more energy making the process perfect, which would significantly hinder the integration time (i.e., diminishing returns), we instead try to be resilient and understand how to fix things as they come up, and limit the amount of damage. We expect that there are, at some point, going to be issues. Therefore, we proactively make sure that we have the capability to know when these errors will occur, and limit the amount of customers that are impacted by doing incremental rollouts. We also want to have the ability to know if our customers are using the feature as well, which is important for the business (which would be considered a non-error metric.)
-
Continuous Monitoring corresponds to this feedback mechanism: getting feedback. In this case, continuous monitoring refers to getting feedback from a customer's device where they are running our application, in terms of performance, errors, engagement, and more. Developers should embed telemetry inside of their features to ensure that customers are using them, and to quickly turn off the feature flag should there be an error. This is because features with errors could corrupt data, and are not beneficial to the customer's experience. Feature flags are a huge part of continuous integration and CD: they enable developers to quickly experiment and integrate code, all the way to production. Much like a river, events are continuously generated, and continuously logged, and continuously monitored.
-
With continuous monitoring, developers will add monitoring to the features that they release, including monitoring metrics for the physical servers that they are deployed to.
Terms
5. KPIs: Key Performance Indicators. Metrics that demonstrate how effectively a company is achieving its business objectives.
7. Correlation id: A unique identifier value that is attached to requests and messages that allow tracing of the whole chain of events of a transaction.
8. Telemetry: An automated process where measurements and data are collected at remote points and transmitted to receiving equipment for monitoring.
10. MAU: Monthly Active Users. The number of users who interact with a product within a 30-day window.
11. SLA: Service Level Agreement. A contract between a service provider and the end-user that specifies what level of service is expected during the agreement's duration.
12. ICE (Ideal Customer Experience): A metric that measures user satisfaction, calculated as the number of successes divided by starts.
13. ACE (Adjusted Customer Experience): A metric that considers both successes and expected failures, divided by starts.
14. Error Budget: An engineering concept based on the premise that 100% uptime or reliability is neither realistic nor the goal; instead, a certain "budget" of allowable errors or downtime is set.
What is telemetry?
-
Telemetry is a method to collect and send data from customer devices where our applications run. Developers embed telemetry within features to monitor performance, errors, engagement, and other metrics.
-
The way continuous monitoring is integrated into your application is two-fold:
-
On the servers hosting the application, there are several integrations or applications you can use to monitor server-specific metrics, such as the number of requests served per second, CPU usage, memory, disk, etc. These are usually agents or applications that run directly on your server, or, it could be provided by your cloud-hosting provider. Normally, this doesn't require modifying the application, but it depends on what type of metrics you want to collect.
-
On the applications themselves, normally, you'd want to collect application-specific or user-specific telemetry. This does require modifying the application to add code to log the specific metrics that you are interested in. There are some frameworks on how to collect this telemetry, and, depending on which telemetry you are collecting, might be sent to a third-party server or your server. If collecting it yourself, it is normally via an HTTP endpoint which stores events into a database that can be queried later (e.g., for reporting.) Some useful metrics that you might be interested in are how many users are using your application per month (MAU), per week, or per day, and whether the user's are happy.
-
There might be several points in-between, such as those from different teams, that may also benefit from monitoring.
Frequency of monitoring
- Well, continuous monitoring monitors continuously. This means that as event data is generated, it is streamed (like a river) to our centralized analytics hub. In some cases, it might be aggregated or batched up on the client's side, but this is an advanced topic.
Benchmarks for reliability and performance
-
Of course, someone isn't staring at the data all day, that would not be a very good use of their time. Instead, we can set up alerts or rules that trigger an event (such as a phone call, email, etc. based on the severity of the alert) for an intervention to occur. An intervention is an act that a human does in order to fix or silence the alert; the computer says that something is wrong, and the human has to either fix it or silence the alert by evaluating the situation. Sometimes, you can also set up automatic interventions where a pre-programmed action takes place if there is a certain type of alert.
-
Let's say we have some telemetry for our new feature set up. Whenever there is an error, the error handler triggers and sends us some error telemetry. If there's a lot of people using our application, there's bound to be maybe one or two false positives. Say that there are millions of people using our application. We might not want to wake up every time someone encounters an error, otherwise I would not get any sleep.
-
In the industry, we measure application reliability and success through something called ACE and ICE Delve Telemetry & Monitoring. My name is Luka Bozic and I'm a... | by Delve Engineering | Medium.
-
"ICE (Ideal Customer Experience) = successes / starts". In this case, we have 999999 successes and 10000000 total starts (one error.) So, our ICE would be 0.999999.
-
"ACE (Adjusted Customer Experience) = (successes + expected failures) / starts". Expected failures are errors that are retried (succeeded), or errors that are technically not "errors". In this case, our ACE would be the same as our ICE.
-
What would my ICE and ACE be? It depends on your application, but usually 99.95% is a good start. This really underscores the importance of good monitoring and also bridges the gap between what the customers see, and what is being evaluated against. Monitoring is only as good as what you put into it.
-
But, that doesn't allow for much experimentation, does it? Correct. This allows for about four hours and 20 minutes of downtime, per year SLA & Uptime calculator: How much downtime corresponds to 99.95 % uptime. Going up to 99.99% is about 52 minutes of downtime per year. Note that this normally means that the entire application is unavailable; if items are feature flighted then it is likely that an individual customer(s) will have downtime. Therefore, if you are going to make an SLA, then know that it can restrict how much experimentation takes place.
-
Wow, we should be super on the safe side, right? Well, technically. You can take calculated risks, such as by using an error budget which allows the team to perform more risky changes when you still have SLA remaining. This allows customers to expect a certain level of stability, while also ensuring that the team can continue to experiment and deliver features on time. This also helps keep stakeholders informed as to the extent that customers are impacted.
Getting started with monitoring
- It's likely that your application is complicated. Where do we start to collect data? When we think about what we need to collect, we need to start with a user-focused mindset. This normally involves collecting telemetry on the user's side, such as performance, errors, and frequency metrics (e.g., how often a button was pressed.) It's important to think about the big picture about what you're trying to achieve first, and then do the concrete implementation of the telemetry later. For example, say I want to know if the "Create project" feature that is being rolled out meets customers expectations. We know for sure that it can't meet customers' expectations if it doesn't work. Therefore, we can add an error handler to send error data back to our analytics hub should there be issues. We can then set up alerting, or rules on the data, that will tell us immediately if customers' expectations are not being met. This helps with experimentation as you get a very fast feedback loop: as soon as there is an issue, you will be notified usually in the order of a few minutes or less, and can correlate it with what you're doing.
Ok, where do I start?
-
First, you have to think about what you're trying to monitor, especially if it is a business case. For example, the business wants to know how much people like the application. This could be broken down into several sub-goals, such as user retention, logins, activity, etc. and then these can be monitored individually, by turning them into scenarios. Identify these scenarios in your app, and then apply logging to those locations.
-
Another situation which overlaps is determine if there are issues or problems in your application, for example errors or performance issues. What are the core user scenarios, for example, when they click on your app, how long does it take to load for the first impression? What about some other processes, like creating a project? Does that take 10 minutes when it should take 10 seconds? What is the entire flow from when a user enters the app to that point? This might require logging at many different points, but there should be a well-reasoned strategy, such as logging in places that reduce execution entropy. For example, logging twice in a row is, in general, probably not as useful to determine what happened next than if it was logged after an if statement. Here's an example.
Let's consider an example involving a simple function to process user registration in a hypothetical application.
Poor Logging Strategy
def register_user(username, password, email): try: # ... some code to add user to database ... db.add_user(username, password, email)
    # Vague and non-descriptive log
    print("Operation completed.")

except Exception as e:
    # Logging the whole exception without context
    print(e)
Usage
register_user("alice", "password123", "alice@example.com")
Issues with the above code:
-
Using
printinstead of a proper logging library. -
The success message "Operation completed." is vague. We don't know what operation was completed.
-
Catching all exceptions and just printing them out without context can make it hard to understand the root cause.
-
Sensitive information, like a password, might get logged inadvertently in the exception message.
Good Logging Strategy
Using Python's logging module:
import logging
logging.basicConfig(level=logging.INFO) logger = logging.getLogger(name)
def register_user(username, password, email): try: # ... some code to add user to database ... db.add_user(username, password, email)
    # Descriptive log message with relevant context
    logger.info(
        f"User registration successful for username: {username}, email: {email}"
    )

except Exception as e:
    # Logging error with context and without exposing sensitive information
    logger.error(
        f"Failed to register user with username: {username}, email: {email}. "
        f"Error: {type(e).__name__}"
    )
Usage
register_user("alice", "password123", "alice@example.com")
Improvements in the above code:
-
Using the
loggingmodule which provides more functionality and flexibility compared to simple print statements. -
The success log is descriptive, providing context about which operation was successful.
-
The error log provides enough information to understand what went wrong without dumping the whole exception, and without exposing any sensitive information like passwords.
-
It's easy to change the logging level, format, and destination (e.g., file, console, external system) with the
loggingmodule.
In practice, a good logging strategy would also involve considerations like log rotation, centralized logging for distributed systems, monitoring of logs for anomalies, etc.
-
The reason why you want to include other information in the logs (e.g., successful, and not necessarily just a logging guid) is because you want to be able to quickly glance at the logs in your logging viewer (whatever that is) and be able to quickly discern if there are issues. Otherwise, you'd have to look up the logging ids every time.
-
Another important thing is: if there was an error, what was the user's experience? This is more of a software-related question and not necessarily a CI/CD one.
How do we collect this data?
-
This would depend on the application that you're writing, but normally there is an endpoint, called /analytics for example that captures event payloads. The event payloads typically correspond to a particular user (e.g., by sending the user's id with the request, along with their session id, time, and what they were doing.) Be careful to read all privacy laws applicable in your area (e.g., GDPR) as some information may have different retention policies or the ability to capture certain types of information.
-
Here's a sample code impl in a TypeScript application.
const telemetry = new TelemetrySender('https://telemetry.endpoint.com/sendEvent');

const event: TelemetryEvent = {

eventId: 'userClickedButton',

timestamp: Date.now(),

data: {

buttonId: 'saveBtn',

userId: '12345'

}

};

telemetry.send(event);
-
In this case, an event is sent to the analytics server once the user clicks on the button. This event is usually associated with the currently logged in user, particular feature flags enabled in the application, or might be part of the payload itself. This would depend on your specific telemetry's implementation, but should contain enough data to trace the request back throughout the application (e.g., via a correlation id) so that you can debug it.
-
This event can be anything: it could be an error, a successful event, or diagnostics (e.g., something neutral.) It's up to you to decide what you should monitor, but focus on what the user sees, and what telemetry might be triggered if a user performs a specific action.
-
There are other monitoring tools that are much more high-level. For example, they might try to load your website in a virtual browser, or boot your application in a VM and verify that the content of the website looks the same. If, for example, it doesn't load, then it can notify you. The advantage of also using this layer of monitoring is that if the website does not load, then it is not possible for the client-side telemetry to emit useful data. Or, for example, say the telemetry was successfully emitted, but there was a CSS issue that caused a div to take up the entire screen, making it impossible for people to navigate the website. By collecting data, you are able to notice trends and patterns, and so if there is all of a sudden a lack of telemetry, or much more, then you are able to have historical stats to back it up and then be notified to do an investigation.
How do I process this data?
- There are many tools available to do so. For example, databases that support KQL (Kusto), MySQL, NoSQL, ClickHouse, etc. The act of creating queries is outside the scope of this book, but is likely to take the majority of your time.
What should I monitor?
-
Developing a monitoring strategy is important because otherwise the monitoring might not reflect the true user's experience. This can make it difficult to get a fast feedback loop, and for experimentation, as you can't trust your data or dashboard to reliably notify you if there is an error. This means that things like feature rollouts via feature flags, incremental deployments, and more would not be as trustworthy.
-
Say a user is creating a new project. Some items that you might want to log or monitor are if creating the project is successful (i.e., did the user just see a white screen? Was there a crash?), how long it took to create the project, what the user was doing beforehand, etc. The errors are usually logged in an error handler, but would depend on the framework that you are logging in.
-
There are other levels of where stats should be collected at. For example, the HTTP request itself, such as its status code, latency, etc. This is usually done server-side, and because of the homogeneity of many back-ends, many alerting templates likely will automatically monitor this as a default. These are mostly diagnostic data: for example, 100ms for an HTTP request doesn't mean much in and of itself, or 10% CPU usage, and then fluctuates to 5% for example doesn't mean much either. This is useful for example if you are having issues on the client, or people are experiencing issues and you find out that the CPU usage is at 110%, then it's likely there's a CPU usage issue.
-
However, some are useful for keeping track of. If the CPU usage is steadily rising, with more and more traffic, then you might need to consider your scaling strategy or to provision more servers for example. This provides an early warning sign before issues occur.
-
It's also important to collect actual user feedback as well, for example, through a feedback form. This is helpful for collecting higher-level errors, such as usability or new features, which would be difficult to capture via diagnostic data.
-
Now you have a whole bunch of events in your database. What do you do with them? They are not useful if they just sit in the database.
-
In the case of errors, you'd typically want to create an alert on this. There are several options available, such as DataDog that can help with this. They have different integrations, such as being able to call your phone if there is a certain amount of errors that occur within a timespan. Note that it's only good as your monitoring setup: if you don't do any monitoring, then you won't get any alerts. This doesn't mean that your application is healthy, however.
Importance of goals
- It's likely that you will be overwhelmed with numbers, dashboards, and data. Do I care if one HTTP request took 1000ms, and other one took 1001ms?
There's lots of places to monitor. Where do we start? Well, let's create a strategy.
-
Webapps are very complex. Only measuring the HTTP calls is a poor representation of the user's experience, because many HTTP calls can comprise a user's request. Therefore, even a single call per user could lead to a bad experience (or a slow script) which might not be reflected in the time that the HTTP calls are made. Browsers pipeline requests, and can do requests in parallel, thus making it very challenging to reconstruct it.
-
web-vitals useful for measuring web-app perf GoogleChrome/web-vitals: Essential metrics for a healthy site. (github.com)
-
Know the limitations of your monitoring tool. If it can only measure status codes, then therefore it might be too granular to use for specific user-experience metrics, such as click time.
-
Therefore, it depends on the context and application (and where it is running.) You might find it helpful to try simulating the environment that it might run on, including artificially slowing down the environment to make sure the telemetry is accurate.
-
Sometimes, the request can't be served at all. In that case, server side monitoring allows for knowing if there are issues server-side.
-
Differentiate between diagnostics and goals. Diagnostics are like checking your heart rate, it doesn't really do anything on its own. Or checking how tall someone is. Goals are being able to capture that into something that can be modified or measured or graded against.
-
Make sure that when you are consuming the data, that the data is accurate.
What do I do with the data?
-
Graphing and plotting data, and making sense of what you're seeing is called sensemaking. It is a very important process because different perspectives on how you see and visualize data can alter business outcomes and what you need to do to change the application in response to different events. Try to avoid using templates for high-level business objectives because this might fail to cater to individual apps' specific needs and features, and might be a sign that your company is developing the same application.
-
There's different things, like median, mean, mode, percentiles, etc. please do not average percentiles that does not make sense. Averages are so-so, depends on what you are trying to measure. Percentiles might be misleading so be careful on what you are actually measuring and how it is actually impacting customer experience, cite video about 99.99% percentile video about the issues with that and the 20 HTTP request scenario.
-
"I"m trying to measure how many users use the application", what does "use" mean, does it mean login? If so, this is usually straightforward. Make sure to account for users logging in multiple times for example.
-
"I'm trying to measure some performance of something" ok this might be a bit complicated. Is it measuring from the user's perspective, and then the percentile is over the user's session? For example, the user is clicking on things, and one of their interactions was very slow. Are we aggregating the 90th percentile per user, and then the percentile of that, or aggregating it across all feature interactions? The latter is not as useful, because a single interaction could cause a poor user experience, and it doesn't discern between a single user having a bad time (but used the application a lot), versus many users having a poor experience.
-
Performance regressions, web-vitals for front-end, etc.
-
Monitoring the actual CI/CD pipeline itself could be useful, for example, if the runner is using more and more RAM, or more and more disk space and might be getting full soon, or it is taking longer and longer to complete (thus compromising the fast feedback loop.) The pipeline is just a server so I'm wondering if regular monitoring tools would apply. If it's slow then it might be using just a single CPU, or too much network, etc.
-
Sample size is important, and provides confidence in estimates (use effect size.) Using heuristics are unlikely to be reliable and are difficult to compare over time.
-
https://www.youtube.com/watch?v=Y5n2WtCXz48 12% increase in revenue with faster load times, might be getting a bit off topic...
-
For other data, such as goals or diagnostics, you'd typically want to perform sensemaking on them. There are many tools that can connect to your database (e.g., ClickHouse) and can visualize the data. Visualizing data is a way where you can generate insights on the data and be able to do stuff with it. For example, if the performance of a particular part of your application is slow, then you can optimize engineering efforts to improve that piece.
Conclusion
- As we embark on the journey of continuous integration and delivery, monitoring remains our guiding star. It's not about collecting vast amounts of data but making sense of it. With a strategic approach to monitoring, teams can ensure software products that are not just functional but also resonate with the users' needs and preferences.
How do I get the information from my monitors and how do I set up monitoring and logging? How do I associate the logs with a specific application version?
The section on "Monitoring and Feedback in Continuous Deployment" is comprehensive and well-structured. It offers readers insights into various tools, best practices, and methodologies related to monitoring in CI/CD. Here are some suggestions and observations:
- Introductory Transition: You could introduce the topic with a sentence or two, setting the context for the reader. For instance:
- "Continuous Deployment relies heavily on effective monitoring and feedback mechanisms to ensure software performance and stability. Let's delve into the specifics of setting up and managing these mechanisms."
- Goal of Monitoring:
- Consider highlighting the dual aims: "The primary aims of monitoring are to ensure application performance and reduce or eliminate ambiguity during troubleshooting."
- Dashboard Types:
- It might be worthwhile to mention that dashboards are visual representations of data, making them indispensable for rapid diagnostics and decision-making.
- Design Considerations:
- Add a point on responsiveness. With the increase in mobile use, ensuring that dashboards are mobile-friendly and adapt to different screen sizes can be crucial.
- Performance Monitoring:
- Mention other performance metrics like Disk I/O, Network bandwidth, etc., to give a more rounded view.
- Logging Considerations:
- You could also highlight the need for secure logging. Certain data should never be logged (like passwords, personal user details, etc.) due to security and privacy concerns.
- 5 W's of Logging:
- Great touch here. This will be incredibly useful for developers and sysadmins alike.
- Blue-green database deployment strategies:
- It feels a bit out of place since you provided a detailed section before and after it. Consider expanding on it or positioning it in a more appropriate section or context.
- On trust and automation:
- The content here is dense and rich. To enhance readability, consider breaking down the longer sentences.
- Highlight the importance of human oversight. Even with automation, human involvement remains critical for edge cases and unforeseen circumstances. Emphasize that automation is a tool, not a replacement for human judgment.
- Citations:
- Ensure that any referenced content is appropriately credited, as you've done. It adds credibility and depth to the material. However, depending on the medium of this content (e.g., a book, an online course, etc.), you may need to follow specific citation styles or consider hyperlinking directly to the source if it's a digital medium.
- General:
- A few headings seem to end with URLs (e.g., Logging and Log Management (ipfs.localhost)). Ensure that these URLs are meant to be there or if they were placeholders that should be updated.
- Consider providing some practical examples or case studies. Real-world scenarios or illustrations can help ground the theoretical information.
Overall, you've done an excellent job at consolidating a vast amount of information into a coherent and informative piece. The content covers the essentials of monitoring and feedback in CI/CD thoroughly, making it a valuable resource.
1. Goal of Monitoring:
The aim is to reduce or eliminate ambiguity when diagnosing incorrect functionality. It's important to log strategically, showing a clear execution path but ensuring it doesn't excessively slow down the application due to data storage concerns.
What should I add to the code to do monitoring? Where do I monitor?
Monitoring software/tools
Certainly! Monitoring and observability are critical components of the CI/CD pipeline, especially in production environments. Here's a list of some popular CI/CD software monitoring products:
1. Datadog: A cloud-based monitoring and analytics platform that allows for full-stack observability by integrating with numerous platforms and services. It offers real-time performance dashboards, end-to-end tracing, synthetic monitoring, and log management.
2. Prometheus: An open-source system monitoring and alerting toolkit originally built at SoundCloud. It's now a standalone open-source project and maintained independently of any company. It integrates well with the container orchestration system Kubernetes.
3. New Relic: Provides insights into application performance, infrastructure monitoring, and customer experience. The platform offers a suite of products that track various aspects of applications and infrastructure health.
4. Splunk: Known for its powerful log aggregation and search capabilities, Splunk has expanded its capabilities to offer infrastructure and application monitoring with its Splunk IT Service Intelligence (ITSI) and SignalFx products.
5. Elastic Stack (ELK Stack): Comprises Elasticsearch, Logstash, and Kibana. It's widely used for searching, analyzing, and visualizing logs in real-time.
6. Grafana: An open-source platform for monitoring and observability. Grafana allows users to create, explore, and share dashboards from multiple data sources, including Prometheus, Graphite, and InfluxDB.
7. Dynatrace: A software intelligence platform that offers application performance monitoring (APM), artificial intelligence for operations (AIOps), cloud infrastructure monitoring, and digital experience management.
8. AppDynamics: Acquired by Cisco, AppDynamics is an application performance management (APM) and IT operations analytics (ITOA) company. It provides real-time monitoring of applications and infrastructure.
9. Sentry: An open-source error tracking tool that helps developers monitor and fix crashes in real-time. It's especially useful for identifying issues in code post-deployment.
10. Raygun: Provides error and performance monitoring for software applications. It helps developers diagnose issues in their applications by providing detailed error diagnostics and performance timing information.
11. Honeycomb: An observability platform that allows for high-cardinality data exploration, helping developers understand and debug production issues.
12. LightStep: Focuses on tracing and is particularly optimized for microservices and serverless architectures.
It's worth noting that the best monitoring solution often depends on the specific requirements of the organization, the existing tech stack, and the nature of the applications being monitored. Many companies use a combination of several tools to achieve full-stack observability.
2. Dashboard Types:
There are generally two types:
Diagnostics Dashboards: These display data without context, such as memory usage or heart rate. They offer a snapshot without specific goals.
KPI Dashboards: These are goal-oriented, showcasing metrics like Monthly Active Users (MAU), Daily Active Users (DAU), customer behavior in an app, or success rates for particular scenarios.
3. Design Considerations:
Maintain minimalism, avoiding unnecessary decorations that could clutter the dashboard.
Collect relevant data, understanding the significance of metrics like averages, percentiles, and exceptional cases.
Prioritize end-to-end (E2E) metrics that mirror user experience, rather than an aggregate of smaller, potentially unrelated metrics.
4. Metrics to Consider:
Focus on higher-level metrics like those from the web-vitals library for web applications to better reflect the user experience.
While HTTP-based metrics are helpful for diagnosis, they may not always be indicative of the overall customer experience.
5. Graphing Data Sources:
There are primarily two categories:
Diagnostics: More developer-centric, they might include metrics like memory usage.
KPIs/Scenario Metrics: More user-focused, they show how users interact with a feature, for instance.
6. Performance Monitoring:
CPU usage can be an indicator, but it's essential to pair it with end-user experience metrics to get a holistic view.
Consider utilizing cloud providers for scalability and fault tolerance. Robust monitoring tools should alert immediately if there's a performance issue, possibly via third-party software to ensure redundancy.
7. Logging Considerations:
Log managers manage, tabulate, and graph logs but don't instruct on what or where to log.
Developers should create clear, concise log messages that provide essential debugging information.
Also important to know what and when to log, and what to include in the log messages.
Assigning priority levels to different logs is crucial. Telemetry is typically what's logged, with different types categorized by importance.
Logging and Log Management (ipfs.localhost)
In general, logs should provide insights into:
- What Happened?
Provide appropriate details. Merely stating "Something happened" is not particularly useful.
- When Did It Happen?
Include timestamps. If relevant, specify when the event started and ended.
- Where Did It Happen?
Specify details such as the host, file system, network interface, etc.
- Who Was Involved?
Identify the user, service, or system entity.
- Origin:
Where did the entity come from?
These key points represent the "5 W's of Logging". They have been borrowed from disciplines like journalism and criminal investigation, among others.
For a more comprehensive understanding, it's beneficial to know:
- Additional Information:
Where can one find more details about the event?
- Certainty:
How confident are we that the provided details accurately represent the event?
- Impact:
What or who is affected by this event?
If we were to wish for even more insights, it would be great to know:
- Future Events:
What might happen next based on the current event?
- Correlated Events:
What else happened that might be relevant or important?
- Recommended Actions:
Given the event, what should one do next?
Feature Flags
Precedent
-
Likely originated (the word "flag" as used in programming to indicate a state) from International maritime signal flags - Wikipedia
-
Best of Velocity: Move Fast and Ship Things - Facebook's Operational and Release Processes - YouTube facebook popularized it? 2013 so nope
-
10+ Deploys Per Day: Dev and Ops Cooperation at Flickr | PPT (slideshare.net) 2009
Feature Flags
Precedent
-
The programming term “flag” likely draws inspiration from international maritime signal flags, where visual flags convey state and intent. See: International maritime signal flags — Wikipedia.
-
Feature flags (a.k.a. feature toggles) have been used for years. Notable early public discussions include:
-
“10+ Deploys Per Day: Dev and Ops Cooperation at Flickr” (2009) — highlighted deployment practices that paved the way for frequent releases and controlled exposure. Slides.
-
Facebook’s “Move Fast and Ship Things” (2013) — popularized modern rollout and operational controls at scale. Talk.
What are feature flags?
Feature flags are remotely controlled if statements. They allow you to alter code paths at runtime without redeploying. In CI/CD, they enable rapid, low-risk releases by:
- Decoupling deploy (ship the code) from release (expose functionality).
- Letting in-progress features coexist safely.
- Enabling targeted rollout (e.g., beta users, specific geographies, user types, IP ranges, or account age).
Flags are often resolved by fetching key–value pairs (e.g., "EnableSpecialFeature": true) from a server. Throughout this chapter, feature flag and feature toggle are used interchangeably.
Why use feature flags?
Advantages
- Release independence: Turn features on/off at runtime, independent of your deployment pipeline. Multiple features can be released (or hidden) in parallel.
- Fine-grained targeting: Expose a feature to cohorts (beta testers, premium users), regions/languages, or by request attributes.
- Safer integration: Merge work early and often; keep risky paths guarded until they’re ready.
- Progressive delivery: Roll out gradually, monitor, and roll back instantly if needed.
- Graceful degradation: Disable heavy or unstable features during incidents without impacting core functionality.
- Resource management: Throttle access to expensive capabilities (e.g., AI inference) based on load, plan, or time of day.
- Strangler pattern support: Route a portion of traffic from a legacy path to a new one while maintaining session/state.
A/B testing vs. Canary releases
- A/B testing (split testing): Show two or more variants (A, B, …) to different users at the same time to compare behavior (e.g., conversion or retention).
- Canary release: Gradually roll out a new version to a small percentage of users or servers to detect issues before a full rollout.
Versus blue–green deployments
- Feature flags excel at runtime control of behavior and targeted exposure. They’re ideal for iterative product work and experimentation.
- Blue–green is better for big-bang changes (infrastructure shifts, database migrations, framework swaps). Automate blue–green to reduce risk. Use both approaches together when appropriate: e.g., deploy via blue–green, then release via flags.
Implementation basics
Feature flags can start simple (e.g., a JSON file downloaded at runtime) and evolve. Complexity grows when you need, for example, “10% of users” — at that point, server-side assignment is preferable: pass user or request context to a flag service and return a resolved set of flags. Avoid doing percentage splits purely on the client; it complicates debugging and often requires redeploys for changes.
Always version and track flags alongside code (e.g., in the repository) so behavior changes are auditable and reproducible.
Frontend vs. backend flags
- Frontend: UI variations, layout changes, client-only behavior.
- Backend: API paths, provider selection, infra toggles, gating of costly operations.
Example: selecting a new weather API provider is backend; switching between Celsius/Fahrenheit display is frontend.
DIY example: remote JSON via Azure Storage + GitHub Actions
This simple approach fetches flags from a blob at runtime. It’s quick to start with, though specialized SaaS or a self-hosted service will scale better for complex needs.
Security note: If you host a public blob, treat it as non-secret. Prefer time-limited SAS URLs or private access behind an API. Never rely on flags to hide sensitive code—ship only what clients should see.
1) Create a GitHub repository
Create/clone a repo
git clone https://github.com/your-username/feature-flags-azure-storage.git
cd feature-flags-azure-storage
2) Add a flags.json
{
  "EnableSpecialFeature": true,
  "ShowNewHomepage": false,
  "BetaTestingMode": {
    "enabled": true,
    "users": ["user1@example.com", "user2@example.com"]
  }
}
Optionally maintain per-environment files (e.g., flags.dev.json, flags.staging.json, flags.prod.json). Validate with a JSON schema in CI.
3) Optional: GitHub Actions workflow (deploy blob)
Create .github/workflows/deploy-flags.yml:
name: Deploy Feature Flags
on:
  push:
    branches: [ main ]

jobs:
  deploy:
    runs-on: ubuntu-latest
    steps:
      - name: Checkout
        uses: actions/checkout@v3

      - name: Azure Login
        uses: azure/login@v1
        with:
          creds: ${{ secrets.AZURE_CREDENTIALS }}

      - name: Upload to Azure Blob Storage
        uses: azure/storage-blob-upload@v1
        with:
          source_dir: '.'
          container_name: 'feature-flags'
          storage_account: ${{ secrets.AZURE_STORAGE_ACCOUNT }}
          sas_token: ${{ secrets.AZURE_STORAGE_SAS_TOKEN }}
Replace the upload step with your preferred method if needed; this is illustrative.
4) Azure Storage setup (summary)
- Create a storage account and container (e.g.,
feature-flags). - Generate a SAS token with read permission and sensible expiry.
5) Add GitHub Secrets
AZURE_CREDENTIALS— Service principal JSON (see Azure docs).AZURE_STORAGE_ACCOUNT— Storage account name.AZURE_STORAGE_SAS_TOKEN— Read-only SAS token for uploads/reads.
6) Commit & push
git add .
git commit -m "Initial setup with feature flags"
git push origin main
7) Client code (JavaScript example)
async function fetchFeatureFlags(url) {
  const res = await fetch(url, { cache: 'no-store' });
  if (!res.ok) throw new Error(`Flag fetch failed: ${res.status}`);
  const flags = await res.json();
  return flags;
}

// Example usage
(async () => {
  const url = 'https://your-storage-account.blob.core.windows.net/feature-flags/flags.json?your-sas-token';
  const flags = await fetchFeatureFlags(url);

  if (flags.EnableSpecialFeature) {
    // Enable the new path
  }

  if (flags.BetaTestingMode?.enabled) {
    // Check current user against BetaTestingMode.users
  }
})();
Operational flow: To change behavior, update flags.json (or use a flag service UI). Your app refetches on an interval or per request; behavior flips without redeploying. Log the set of resolved flags with errors/crashes to aid reproducibility.
Practical considerations
Data implications
Different cohorts may generate different data shapes. Plan migrations and compatibility carefully. Use flags to gate access to new schemas and write dual-format when transitioning.
Complexity management
- The number of combinations grows as 2^N for N independent boolean flags (e.g., 10 flags → 1,024 combos). Testing and bug reports must include flag states.
- Consider automated analysis (e.g., PCA or other ML) to correlate problematic outcomes with flag combinations in telemetry.
- Regularly sunset obsolete flags and keep implementations simple.
Project & UX coordination
- Communicate rollout plans across teams to avoid incoherent, mixed experiences.
- Bundle related flags into coherent “releases” when it helps UX consistency.
Server-side evaluation (SSR/API mediation)
- Resolve flags on the server so clients only receive relevant code/paths. This improves security (no hidden UI to unhide) and simplifies debugging.
Monitoring & observability
- Track exposure, conversions, and errors by flag and variant. Telemetry is directional, not perfect—treat it as a signal.
Security notes
- Flags do not provide true concealment. Anything shipped to clients can be discovered and toggled.
- If secrecy matters, don’t ship related resources until the feature is truly live.
- If you must ship client flags, consider obfuscation and name hygiene; rely on this only as a minor deterrent.
Limitations & risks
- Combinatorial explosion: Many flags → many interactions → harder QA. Always capture flag states in logs and error reports.
- Inadequate concealment: Client-delivered code can be probed (including enterprise-only features). Avoid leaking names that reveal roadmap details.
- Default dependencies: If the flag server fails, fail safe. Choose secure defaults and timeouts to prevent accidental exposure or outages.
- Overuse: Excess flags increase cyclomatic complexity and test cost. Some changes (OS upgrades, huge refactors) simply aren’t “toggleable.”
Mitigations
- SSR / server-side checks so clients only see what they can use.
- Usage monitoring with telemetry and anomaly detection.
- Semi-long-lived branches for high-risk or sensitive work; produce isolated builds for test environments.
- Code obfuscation only as a deterrent; pair with not shipping disabled resources.
- Lifecycle automation (see below) to prevent stale flags.
Feature flags vs. branching
-
Both separate lines of work, but at different layers:
-
Branches isolate source code. Non-trunk work isn’t deployed; it lives in the repo until merged.
-
Flags control runtime execution of already-deployed code in production and other environments.
-
Flags enable early integration and experimentation without redeploys. Branches defer integration and are ideal for larger or unstable work.
-
Use both: develop on branches, merge often, protect risky paths with flags, and release progressively.
(Metaphor: a tree’s branches diverge from the trunk; flags decide which “path” to walk at runtime.)
Environments
An environment is a curated set of flag states. Common environments are dev, staging, and prod, but you can create cohorts such as beta, experimental, or region/language-specific sets.
- Assign environments automatically (e.g., by deployment target) or dynamically (e.g., new users get
experimental). - Allow manual opt-in for beta programs.
- Keep environment definitions in code or your flag service for traceability.
Lifecycle
- Short-lived by default: Most flags should live days/weeks, not months. Once a feature is at 100%, remove the flag and dead code.
- Time bombs / expiries: Add an expiration date and alerts; auto-disable or page owners when stale.
- Ownership: Record an owner, purpose, and cleanup plan for each flag.
- Cleanup tooling: Use static analyzers or tools (e.g., Uber’s Piranha) to remove unused flags automatically.
- Testing discipline: If you plan to disable a widely enabled feature, periodically test the off path with other active flags.
Naming patterns
Good names prevent technical debt and make cleanup/search reliable.
- Clear and concise: Prefer full words over abbreviations.
- Consistent casing: e.g.,
PascalCaseorsnake_case— pick one. - Action verbs: Start with
Enable,Disable, orToggleto clarify intent. - Positive names: Prefer
EnableNewUIoverDisableOldUI. - Categorize with prefixes:
payment_,ui_,search_to group logically. - Indicate type: Append
_rollout,_killswitch,_abtest. - Indicate status:
_beta,_experimental,_temporary. - Tie to work items: Include IDs (e.g.,
EP01_EnableDarkMode) to improve traceability. - Team scoping:
frontend_,backend_, etc., if that helps ownership. - Versioning: Include a version when relevant (e.g.,
_v2). - Dates (optional): Suffix with
YYYYMMDDfor planned removal (e.g.,_rm20250401). - Avoid special characters that complicate regex or tooling.
Example: ui_EnableDarkMode_rollout_beta_v2_rm20250401
Popular feature flag providers/managers
- LaunchDarkly — mature feature management with targeting and experiments.
- Split.io — flags + experimentation + monitoring.
- Optimizely — experimentation and feature management (formerly Episerver).
- ConfigCat — flags and remote config across environments with targeting.
- Flagsmith — open-source feature flags and experimentation.
Quick checklist
- Add a flag behind every non-trivial user-facing change.
- Decide targeting and metrics before rollout.
- Log resolved flag states with errors and key events.
- Prefer server-side evaluation and avoid shipping unused code.
- Set an expiry and owner for each flag; clean up after 100% rollout.
- Keep naming and documentation consistent across the org.
You want to perform A/B testing or canary releases to gather user feedback or performance data before fully deploying a new feature. Undertaking A/B experiments to optimize user experience. For instance, enabling features only for specific user segments like beta testers.
You need to provide different feature sets to different users or user groups, such as premium or trial users.
You want to develop and release features independently and maintain a single codebase that serves multiple deployment environments.
Use an effective branching strategy when:
You want to manage and organize parallel lines of development, such as features, bug fixes, or release branches.
You need to isolate experimental or unstable code changes from the stable main branch to prevent disruptions in production.
You want to ensure that different development teams can work on features simultaneously without interfering with each other's work.
You need a systematic approach to merge code changes from different branches into the main branch, ensuring the codebase remains stable and up-to-date.
You want to maintain a clear version history and facilitate traceability of code changes.
Needing high agility, where if an issue arises with a new feature, it can be quickly turned off without redeploying the entire application.
Incrementally transitioning from an older system to a newer one using the strangler pattern. For example, redirecting requests from an old application to a new one in real-time while maintaining user session states.
Advantages of Feature Flags You've already discussed blue-green deployment strategies. Why wouldn't I just use those instead of feature flags?
They serve different purposes. With feature flags, you can release new features independent of the deployment pipeline, and multiple features can be released at once. You also have more control over who you release it to, such as specific groups of users or via geographical location, and normally you can turn feature flags on and off much faster than going to another deployment through a deployment pipeline. They also allow hiding in-progress development. They also allow exposing features to certain people, or environments, for example QA to test.
Blue-green deployments are typically reserved for significant changes such as large-scale infrastructure updates, database migrations, or complete framework shifts, like migrating from React to Angular. This method is especially useful for scenarios where feature flags are not feasible, such as with incompatible frameworks or extensive application refactors. It's standard practice to automate the blue-green process to handle these major changes efficiently, ensuring stability and minimal disruption. This approach is also suitable for smaller updates like package upgrades, ensuring all changes, whether minor or major, undergo the same rigorous deployment process.
You want to use feature flags to incrementally expose (or hide) features that are currently being developed. This will be part of your regular CI workflow. When you're working on a feature, put it behind a feature flag. There is an annotated example below with a code implementation.
Artifacts, Docker, and Versioning
What are artifacts?
- Artifacts are the outputs of your build: binaries, libraries, archives, documentation, container images, etc. (A running container is not an artifact; the image it runs from is.)
- Artifacts can be treated individually or as a package (e.g., a tar/zip containing multiple files).
- In dependency graphs, one project’s outputs become another’s inputs (e.g., app A depends on app B’s published artifact).
Docker essentials
What is a Dockerfile? A Dockerfile is a text file with instructions to build a Docker image—a portable, reproducible environment including your app and its dependencies.
Example: simple Python web app Dockerfile
1) Base image
FROM python:3.8-slim
2) Working directory
WORKDIR /app
3) Copy sources
COPY . /app
4) Install dependencies
RUN pip install --trusted-host pypi.python.org -r requirements.txt
5) Expose port (example)
EXPOSE 80
6) Default command
CMD ["python", "app.py"]
Notes
- Build with a tag immediately to avoid dangling, untagged images:
docker build -t myuser/myapp:v1.0 .
- If you build without
-t, you’ll get an image with<none>:<none>and an image ID (e.g.,d49c4d85c3ea), which is hard to track. Retag if needed:
```bash
 docker tag d49c4d85c3ea myuser/myapp:v1.0
#### Tagging images & pushing to registries

* A **tag** identifies *which* image you mean (and often *where* it lives). The full name includes the registry when pushing somewhere other than Docker Hub:
e.g. ghcr.io/acme/myapp:v1.2.3
* Common tag strategies:

* **SemVer**: `v1.2.3`
* **Channels**: `dev`, `staging`, `prod`
* **Immutability**: short **Git SHA** (`sha-abc123`)
* Combine: `v1.2.3-sha-abc123`
* Avoid relying on `latest`; be explicit.

**Build, tag, push (general)**

# Build
docker build -t myuser/myapp:v1.0 .

# (Optional) Retag with registry hostname
```bash
docker tag myuser/myapp:v1.0 myregistry.example.com/myuser/myapp:v1.0
Login + push
docker login myregistry.example.com
docker push myregistry.example.com/myuser/myapp:v1.0
Pull elsewhere
docker pull myregistry.example.com/myuser/myapp:v1.0
Azure Container Registry (ACR) example (condensed)
Login to Azure
az login
Create registry (once)
az acr create --resource-group myresourcegroup --name myregistry --sku Basic
Docker/ACR auth
az acr login --name myregistry
Tag with login server
docker tag myuser/myapp:v1 myregistry.azurecr.io/myapp:v1
Push + verify
docker push myregistry.azurecr.io/myapp:v1
az acr repository list --name myregistry --output table
az acr repository show-tags --name myregistry --repository myapp --output table
Reproducible builds & Docker cache
- Local builds often use cached layers; CI runners may not. This can produce different results.
- Prefer pinned versions and idempotent steps. For example, avoid a bare
apt-get install curl; pin to a version or use deterministic sources. - Consider occasional no-cache builds in CI to catch drift:
docker build --no-cache -t myuser/myapp:ci-check .
Integrating artifact repositories with CI/CD
- Restore step: Use your language’s package manager (NuGet, npm, pip, Maven, etc.) pointed at your artifact/package repository.
- Auth: Connect via service principals, API keys, or your CI provider’s service connection.
- Local test first: Validate repo access and package restore locally before automating.
Why not always rebuild instead of storing artifacts? Toolchains and environments change. Even a one-bit difference means it’s no longer the same artifact, which complicates audits, rollbacks, and security verification. Artifact repositories provide immutability, retention, and traceability.
Artifact tracking & naming
-
Decide how you’ll trace an artifact across environments (build → QA → staging → prod). Use consistent metadata: build number, version, commit SHA, build date, source branch.
-
When is a version assigned?
-
Some teams assign a build version each run and record which version gets promoted.
-
Others version only on release. Either way, record which artifact was released.
-
Marketing vs. engineering versions: “Version 5” publicly can map to many internal patch versions (5.0.1, 5.2, …). Keep a mapping.
-
Evergreen/remote assets (e.g., JS payloads fetched at runtime): make sure you instrument with telemetry so you know exactly which version each client is running.
-
Name safety: If embedding branch names in image names or tags, slugify them to match Docker’s allowed characters.
-
Pre-release ordering (
v1.0-devvsv1.0-beta): define conventions clearly; SemVer pre-release identifiers compare lexicographically—document what “comes before” in your process.
Artifact maintenance & retention
-
Keep just enough history to support rollbacks, audits, and customer support; avoid hoarding every build forever.
-
Use your repository’s retention policies and deprecation features:
-
Track downloads/usage to learn what’s still in use.
-
Deprecate versions with clear comms (replacement, removal date, impact, contact). For rarely used artifacts, a silent deprecation may be fine, but document the decision.
-
Providers often default to ~30 days retention for temporary artifacts; configure to your needs.
Git tags & release automation
- Git tags label a specific commit (lightweight or annotated). Tags alone don’t “make a release”—your CI/CD must react to them.
- Typical flow:
- Decide release strategy (what triggers a release, who approves).
- Implement a tagging strategy that encodes that decision (e.g., push
vX.Y.Ztag onmain). - CI job on tag push: build, set app version, create release notes, publish artifacts/images.
-
Version in the app: If your app shows a version string, update it in your config or embed it during build (and do this before/as you tag).
-
SemVer vs. evergreen:
-
SemVer needs human judgment for “major” changes; automate detection of obvious API breaks where tooling exists, but expect manual decisions.
-
Evergreen (monotonic or SHA-based) can be fully automated; use promotion markers (e.g., “this SHA is now prod”).
FAQ: Why does a container image get built on every merge? Your CI may be wired to build on each push/merge and optionally auto-deploy (CD). The pipeline runs the Dockerfile, tags the image, and pushes it to a registry for the target environment.
References & further reading
- CI & old versions: https://stackoverflow.com/questions/41954891/ci-what-to-do-with-old-versions
- Automated deployment: https://stackoverflow.com/questions/8902468/automated-deployment-using-ci-server
- Build versioning in CD: https://stackoverflow.com/questions/33821137/build-versioning-in-continuous-delivery/33821876#33821876
- Release with Docker: https://stackoverflow.com/questions/30632046/how-to-use-docker-to-make-releases
- Branching from tags: https://stackoverflow.com/questions/55359931/when-to-create-a-branch-from-tag
Blue-green database deployment strategies
- See Refactoring Databases for patterns and caveats; treat schema changes as versioned, reversible artifacts aligned to the app release cadence.
Here’s a tighter, de-duplicated version that keeps the substance and flow.
Integrating Artifact Repositories with CI/CD Pipelines
- Package manager restore. Add a restore step that targets your artifact/package repo (e.g., NuGet for C#, npm, pip, Maven/Gradle).
- Authorization. Connect via service principals/identities, API keys, or your CI provider’s service connection. Follow your provider’s documented login steps.
- Test locally first. Validate repo access and restores in your dev environment/IDE before wiring CI.
- Why store artifacts (vs. re-building)? Toolchains and environments drift. Even a 1-bit change yields a different artifact, complicating audits, rollbacks, and security verification. Artifact repos give immutability, retention, and traceability.
Artifact Tracking & Naming
-
Lifecycle traceability. Decide how you’ll track an artifact from build → QA → staging → prod. Attach consistent metadata: build number, semantic/app version, commit SHA, build date, source branch.
-
Multiple creation points. Builds, non-customer pipelines, and tests may each produce artifacts. Record which ones are customer-facing.
-
Naming conventions. Use a clear schema (e.g.,
<org>/<module>:<version>or<group>/<name>/<version>). Keep it consistent with your repo’s layout rules. -
When versions are assigned.
-
Some teams stamp every build and promote selected builds.
-
Others version only on release. In all cases, record the released artifact version in release notes/logs.
-
Marketing vs. engineering versions. Public “Version 5” often maps to many internal versions (5.0.1, 5.2…). Maintain the mapping.
-
Evergreen/remote assets. If clients fetch assets at runtime (e.g., JS payloads), instrument with telemetry to know exactly which version each client runs.
Artifact Maintenance & Retention
- Keep what you need—no more. Excess versions increase storage cost and confusion. Dependency managers can help resolve “right version,” but set a policy.
- Retention defaults. Many providers default temporary artifacts to ~30 days—tune to your support/rollback requirements.
- Support horizon. For shipped artifacts, align retention to contractual/regulatory support windows (e.g., years). Re-creating exact artifacts later can be hard.
- Policies & tooling. Use your artifact manager’s retention rules, usage/download stats, and lineage to understand what’s still in use.
- Deprecation. Mark versions deprecated (and optionally block download). Communicate replacements, removal dates, impact, and contacts. For rarely used artifacts, a low-touch deprecation may suffice.
- Definition reminder. Artifacts are only the essential bits needed to run—avoid hoarding nonessential build byproducts.
Tagging Notes (SemVer & Branch Names)
- Pre-release ordering. Define conventions up front (
-dev,-beta,-rc). SemVer compares pre-release identifiers lexicographically—document what “comes before” what. - Automating bumps. Incrementing tags requires reading the last published version; encode rules in your release script.
- Branch names in tags/images. If embedding branch names, slugify them—Docker image names have restricted characters.
Reproducible Build Environments
- Capture the inputs. Pin tool versions, OS/base images, and dependency versions; record input checksums and build metadata. Non-idempotent steps cause drift.
- Use containers. Dockerfiles provide isolated, repeatable build environments and allow conflicting host dependencies to coexist safely.
- Bit-for-bit vs. behavior. Small toolchain changes may alter bytes without changing behavior—but the artifact is still not the same, which matters for audits and supply-chain security.
Feature Flags and Toggles
What Are Feature Flags?
Feature flags (also called feature toggles) are conditionals that let you enable or disable parts of your application at runtime without deploying new code. Think of them as remotely controlled if statements.
Common implementations range from a simple JSON file in a storage bucket to dedicated platforms like LaunchDarkly or Split. Start simple — a JSON file is often enough to get started.
Why Use Feature Flags with CI/CD?
Feature flags are what make it safe to merge incomplete work to main continuously. Rather than waiting on a long-lived feature branch, you merge early and keep the new code path hidden behind a flag until it is ready.
Benefits:
- Separate deployment from release. Deploy code to production while keeping the feature hidden. When the business is ready, flip the flag — no new deployment required.
- Reduce risk. If a newly released feature causes problems, turn it off immediately without a rollback deployment.
- Support A/B testing and gradual rollouts. Enable the feature for 5% of users, measure impact, then expand.
- Increase development velocity. Developers integrate to
mainmore frequently without waiting for a complete feature. - Empower product teams. Product owners can control release timing independently of engineering deploy cycles.
Prerequisites: Modular Code
Feature flags only work cleanly in modular code. Attempting to add a flag to a tightly coupled codebase (where changing one path requires changes across many modules) is painful and error-prone. Clean architecture — where features can be enabled or disabled at a clear boundary — is a prerequisite.
Scheduling Workflows and Cron Pitfalls
If you use cron-scheduled workflows alongside feature flags for time-based rollouts, keep these in mind:
- GitHub does not guarantee exact execution times. Workflows scheduled at popular times (especially around midnight UTC) are frequently delayed. If exact timing matters, use a webhook or
workflow_dispatchinstead ofschedule. - The last day of the month cannot be expressed cleanly in cron syntax. If you need end-of-month runs, schedule for the 29th, 30th, and 31st with a script block that checks whether today is actually the last day of the month before proceeding. Alternatively, run on the first day of the next month and reference the prior month's data.
Getting Started
- Start small. Choose a non-critical feature for your first experiment.
- Minimize toggle scope. Keep the flag's impact to as few code paths as possible. Design flags to be removed once the feature is fully released.
- Collect baseline data first. Before enabling a new feature, capture baseline metrics so you can measure impact.
- Don't over-engineer the framework. Start with a JSON file or environment variable. Add a full feature-flag service only when you have proven the need.
- Collaborate with product. Educate product owners on what flags can do — they are a powerful tool for experiments and targeted rollouts.
Key Considerations
- Data is crucial. Use flags to gather data, validate hypotheses, and make informed decisions — not just to hide code.
- Technical and business value. Flags reduce technical risk (safe rollouts, quick rollback) and create business value (experimentation, independent release timing).
- Tooling can help. Platforms like LaunchDarkly, Split, Unleash, and Flagsmith manage flag lifecycle, targeting rules, and analytics so you don't have to build that infrastructure yourself.
For observability, monitoring, and how to measure whether a flagged feature is performing well, see the Observability, Monitoring, Logging, and Reporting aside.
Observability, Monitoring, Logging, and Reporting
Application Monitoring
Deploying your application successfully doesn't always guarantee it's functioning correctly, especially in complex setups with a backend. Errors can arise from many sources: backend server failures, problematic builds that prevent the app from loading, or external API issues (for example, a weather data endpoint that is rate-limited or down).
Common error categories to monitor
- Deployment errors — Is the application loading? A blank page or failure to load can indicate file deployment issues or client-side script errors.
- API dependency failures — External APIs can fail, be blocked, hit rate limits, or return unexpected responses.
- Performance degradation — Slow load times degrade user experience and may indicate the need for optimization.
Setting clear goals before you instrument
Monitoring without defined success criteria produces noise. Before adding dashboards, answer:
- What does success look like for this service? (e.g., 99% adjusted customer experience score, 100 monthly active users)
- What metrics reflect that? (error rates, load times, user engagement events)
- Who are the stakeholders and what questions do they need the dashboard to answer?
What to measure
Beyond server-level metrics (CPU, memory, disk), focus on user-facing indicators:
- Web Vitals (Largest Contentful Paint, Cumulative Layout Shift, Interaction to Next Paint) — measure what users actually experience.
- Error rates — HTTP 4xx and 5xx rates, JavaScript exceptions.
- Engagement events — search interactions, map zoom, account creation, subscription sign-ups.
- Custom metrics — actions specific to your application (e.g., "weather forecast viewed").
Error budgets
Set a practical error budget: a threshold of acceptable errors that allows for innovation without compromising user experience. Configure alerts at meaningful thresholds rather than alerting on every minor error. Alert fatigue is real.
Dashboard design principles
- Use white space to group related data.
- Include both quantitative data (numbers) and qualitative signals (outstanding customer issues).
- Avoid decorative elements that distract from the key message.
- Make critical data stand out (larger text, visual distinction).
- Keep chart styles consistent so comparisons are easy.
- Include error budget metrics: surplus, deficit, burn-down rate.
CI/CD Observability and Telemetry
CI/CD pipelines themselves can be observed as a system. Slow pipelines, flaky tests, and high failure rates are signals worth tracking.
Key resources:
- GUAC — Graph for Understanding Artifact Composition; enables automated dependency graph analysis. Works best with automated (not manual) dependency management.
- run-with-telemetry — GitHub Action
runwrapper with OpenTelemetry instrumentation. - otel-export-trace-action — Export GitHub Actions traces to an OpenTelemetry collector.
- Elastic CI/CD Observability Guide — Practical reference for ingesting pipeline telemetry into Elastic Stack.
Talks and presentations:
- Embracing Observability in Jenkins with OpenTelemetry (DevOpsWorld 2021) — covers the plugin approach for Jenkins.
- Making CI/CD Pipelines Speak in Tongues with OpenTelemetry (cdCon 2022) — cross-platform perspective.
- FOSDEM 2022 – OpenTelemetry and CI/CD — foundational talk.
- Strategic Sampling: Architectural Approaches to Efficient Telemetry (FOSDEM 2024).
- What is CI/CD Observability and How to Bring It to Pipelines (FOSDEM 2024).
- Squash the Flakes: Minimizing Flaky Test Impact (FOSDEM 2024).
What Gets Logged in CI/CD Workflows
Understanding what real-world pipelines log helps you design your own logging strategy. Based on analysis of Google's open-source GitHub Actions workflows, these are the most common data types captured in logs:
- Tool and dependency versions —
cmake --version,bazel version,go version; implicit insetup-node,setup-javaetc. - Commit SHAs and hashes —
${{ github.sha }},git rev-parse HEAD,hashFiles(...)for cache keys. - Configuration and flags — build types (Release/Debug), compiler flags, CMake presets, tool arguments.
- File paths —
$GITHUB_PATHadditions, artifact upload/download paths, lists of changed files. - Test results — pass/fail status, verbose output, JUnit XML paths, coverage upload status, flaky test re-run counts.
- Static analysis findings — file:line:message from ESLint, golangci-lint, Ruff, mypy; SARIF upload status.
- Dependency information — packages installed, cache hit/miss status, outdated dependency lists.
- Deployment and release details — target tags, asset upload status, registry publishing status, SLSA provenance logs.
- System environment info —
ccache --show-stats,docker info, processor count. - Git operation details — changed file lists, merge-base hashes, commit counts.
Code Coverage and Reporting
Coverage measures how much of your code is exercised by tests. It is a useful signal but must be interpreted carefully — see the "Test Coverage Paradox" for why 100% coverage does not equal high confidence.
Popular coverage integrations (based on real workflow data):
- Coveralls — simple coverage badge and history.
- CodeClimate — combines coverage with maintainability metrics.
- SonarCloud — code quality, security hotspots, and coverage in one platform.
- Codecov — coverage diffs on PRs, flag-based coverage.
Setting up SonarCloud with GitHub Actions
Step 1: Generate a SonarCloud token
- Log in to SonarCloud → My Account → Security.
- Generate a new token and copy it.
Step 2: Store the token as a GitHub secret
Repository Settings → Secrets and variables → Actions → New repository secret → name it SONAR_TOKEN.
Step 3: Define SonarCloud project properties
Add these to your project's configuration file (sonar-project.properties, pom.xml, build.gradle, etc.):
sonar.projectKey=your-project-key
sonar.organization=your-organization-key
sonar.host.url=https://sonarcloud.io
Step 4: Add a workflow
Single project:
name: SonarCloud Analysis
on:
  push:
    branches: [main]
  pull_request:
    types: [opened, synchronize, reopened]

jobs:
  sonarcloud:
    name: SonarCloud Scan
    runs-on: ubuntu-latest
    steps:
      - uses: actions/checkout@v4
        with:
          fetch-depth: 0
      - name: SonarCloud Scan
        uses: SonarSource/sonarcloud-github-action@master
        env:
          SONAR_TOKEN: ${{ secrets.SONAR_TOKEN }}
Monorepo (multiple projects):
name: SonarCloud Monorepo Analysis
on:
  push:
    branches: [main]
  pull_request:
    types: [opened, synchronize, reopened]

jobs:
  sonarcloudProject1:
    name: Project 1 Scan
    runs-on: ubuntu-latest
    steps:
      - uses: actions/checkout@v4
        with:
          fetch-depth: 0
      - name: SonarCloud Scan
        uses: SonarSource/sonarcloud-github-action@master
        env:
          SONAR_TOKEN: ${{ secrets.SONAR_TOKEN }}
        with:
          projectBaseDir: project1/

  sonarcloudProject2:
    name: Project 2 Scan
    runs-on: ubuntu-latest
    steps:
      - uses: actions/checkout@v4
        with:
          fetch-depth: 0
      - name: SonarCloud Scan
        uses: SonarSource/sonarcloud-github-action@master
        env:
          SONAR_TOKEN: ${{ secrets.SONAR_TOKEN }}
        with:
          projectBaseDir: project2/
Step 5: Commit, push, and view results
Push the workflow file to trigger your first analysis. Results appear in your SonarCloud project dashboard: code smells, bugs, security vulnerabilities, and coverage.
Notes:
- For reusable workflows, use
secrets: inheritto passSONAR_TOKENsecurely. - For C/C++ projects, use the same action — it automatically installs the build wrapper.
- Refer to the SonarCloud documentation for language-specific configuration.
To create and publish a new NPM package to GitHub Artifacts (assuming you want to use GitHub Packages as your artifact repository), follow these detailed instructions. This guide will also show you how to create three versions of your package.
Step 1: Set Up Your Project
- Create a New Directory for Your Project:
mkdir my-npm-package

cd my-npm-package
- Initialize a New NPM Package:
Initialize your project with npm init. This command will prompt you to enter several pieces of information (like the package name, version, description, etc.), or you can use npm init -y to accept default values.
npm init -y
- Create Your Package:
Write the code for your package. Create a new file (e.g., index.js) and add your code logic:
// Example function in index.js

function greet(name) {
  return `Hello, ${name}!`;
}

module.exports = greet;
Step 2: Configure GitHub Packages
- Authenticate to GitHub Packages:
You need to authenticate with GitHub Packages to publish your package. Create a .npmrc file in your project root:
//npm.pkg.github.com/_authToken=TOKEN

@YOUR-USERNAME:registry=https://npm.pkg.github.com
Replace TOKEN with your personal access token (PAT) from GitHub (make sure it has the appropriate scopes for package publication), and YOUR-USERNAME with your GitHub username.
- Update
package.json:
Add a publishConfig section to your package.json to specify the GitHub Packages registry:
"publishConfig": {
"registry": "https://npm.pkg.github.com/@YOUR-USERNAME"
},
"name": "@YOUR-USERNAME/my-npm-package",
"version": "1.0.0"
Replace YOUR-USERNAME with your GitHub username.
Step 3: Publish Your Package
- Publish the Package:
Ensure you are logged into NPM configured to use your GitHub token, then publish your package:
npm publish
- Verify Publication:
Check your GitHub repository under the 'Packages' section to see your newly published npm package.
Step 4: Update and Publish New Versions
To publish new versions of your package, you will make changes, update the version in your package.json, and then run npm publish again. Here's how to create three versions:
- Version 1.1.0 (Minor Update):
Make some changes to your code. Then update the version in package.json:
"version": "1.1.0"
Publish the updated version:
npm publish
- Version 1.1.1 (Patch Update):
Make minor changes or fixes. Update the version:
"version": "1.1.1"
Publish the patch:
npm publish
- Version 2.0.0 (Major Update):
Make significant changes that might break backward compatibility. Update the version:
"version": "2.0.0"
Publish the new major version:
npm publish
How do I consume this package on GitHub on my developer's machines? They would also need to create their .npmrc file (not committed to Git) with the aforementioned content. You may not want to give all developers package publish permissions.
Artifacts vs. Packages: Choosing the Right Registry
When deciding where to host build output, distinguish between two scenarios:
-
Short-lived build artifacts (e.g., compiled binaries from a PR): Use
actions/upload-artifact/actions/download-artifactto pass them between jobs within a single workflow run. These are ephemeral and tied to the workflow run. -
Versioned, shareable packages (e.g., an npm library, a Docker image, a .NET NuGet package): Use GitHub Packages (
npm.pkg.github.com,ghcr.io, etc.) for easier access, streamlined authentication viaGITHUB_TOKEN, and visibility alongside your repository.
On-premises resources and self-hosted runners
For resources that cannot move to the cloud (special servers, shared file drives, internal artifact repositories), deploy a self-hosted GitHub Actions runner inside your network. The runner connects outbound to GitHub and executes jobs with access to internal resources — no inbound firewall rules are required.
Proxying public registries
Rather than pulling packages directly from public registries (npmjs.org, Docker Hub, PyPI), consider routing through a private registry proxy (e.g., Nexus, Artifactory, or GitHub Packages with upstreaming). Benefits include:
- Control over which package versions are allowed in your organization.
- Ability to detect and block potentially malicious downloads.
- A cached copy that keeps builds working even if the upstream registry has an outage.
- An audit trail of what packages were pulled and when.
Security tools
Certainly! Here's a list of 10 security build tools, commonly known as static application security testing (SAST) tools or static code analysis tools. These tools scan your source code or binaries to find vulnerabilities without executing the program.
• dependabot to update deps
-
Checkmarx: A widely used tool that scans source code or even binaries to find security vulnerabilities.
-
SonarQube: A continuous inspection tool that provides insights on code quality. It includes a security analysis feature.
-
Fortify Static Code Analyzer (SCA): Provided by Micro Focus, it's a solution for detecting vulnerabilities in applications.
-
Veracode: A SaaS-based tool that provides full application scans, including static, dynamic, and software composition analysis.
-
Coverity: Offered by Synopsys, it provides static code analysis to detect and fix critical software defects in C, C++, Java, and more.
-
Klocwork: Used for identifying vulnerabilities; it integrates seamlessly into desktops, build tools, and CI servers.
-
RIPS: A PHP-specific static code analysis tool, known for its accuracy and speed.
-
Bandit: A tool designed to find common security issues in Python code.
-
Brakeman: A static analysis security vulnerability scanner specifically for Ruby on Rails applications.
-
GitLab Static Application Security Testing (SAST): Integrated into the GitLab CI/CD process, automatically scans the latest code changes for vulnerabilities.
Configuring build tools
Setting up the build tool with the appropriate configuration file(s)
-
How do I force other developers to use extensions in the IDE? Workspaces, etc. You can do so implicitly by forcing these checks on the CI server, such as linting. It should have the same configuration as the ones that developers have. Therefore, developers will be inclined to use the recommended extensions because that way they won't have to redo a commit or a formatting change.
-
IDE extensions such as linting on save/format, particular rules, etc.
-
The testing commands won't work (usually) if you don't have any tests. It's advisable to write some more using CI/CD, or at least writing a single test, to show that the test build step can block the build if it fails.
-
Try to run these commands on your local computer and see if they work (via the command line) outside of your IDE. This is because your IDE might have certain software pre-installed (or different environment variables set), which could make things more complex. If they work, then you're on the right track.
-
git commit hooks? Might be too advanced, unsure.
Defining the build lifecycle, including phases and goals
- When you're building it, make sure that the runner's OS matches the ones that you're developing on. This is important because testing is done on the build machines, thus, if you build it on a different OS it is possible for idiosyncrasies. If you are using multiple OSes, do a matrix build, but don't use the artifacts from the other build steps (just test them.) Instead, just deploy the artifacts that are targeted for the destination OS. The latter part is optional but provides a baseline level of assurance that the tests/compile passes on the systems where it is being developed.
Getting better control on your dependencies, and lock files
-
Lock files are a way to control your dependencies at a specific version, including any of its dependencies. Its goal is to make a reproducible build environment. The lock files are required because, even if you run the same commands in the same environment on non-dependency locked files, it's possible that it might use the latest or a different version of the dependency, depending on whatever dependency satisfies the one in the manifest and is in the artifact repository on the remote.
-
You might already have a lockfile. If not, I would recommend that you create one. This is how you do it in the popular programming languages:
- JavaScript (using npm):
- Once you have
package-lock.jsonin your project directory (e.g., from npm install). - Run:
npm ci
- This command uses the
package-lock.jsonfile to provide a clean, exact installation of your dependencies.
- Python (using pipenv):
- With both
PipfileandPipfile.lockpresent in your project directory: - Run: pipenv install --ignore-pipfile
- This ensures that the installation uses versions specified in the
Pipfile.lock.
- Java (using Maven):
- While Maven's
pom.xmldoesn't function as a lock file in the traditional sense, you should specify exact versions inpom.xml. - Run: mvn clean install
- Maven will fetch and install the exact versions defined in
pom.xml.
- Ruby (using Bundler):
- Once you have a
Gemfile.lockin your project: - Run: bundle install
- Bundler will install the exact versions specified.
- C# (using .NET Core/NuGet):
- With specified versions in your
.csprojfile: - Run: dotnet restore
- The .NET CLI will fetch and install the correct packages as listed in the
.csproj.
It's crucial to ensure that the lock files (or their equivalents) are committed to your version control system so others can benefit from consistent builds.
How big should my PRs be?
-
PRs should be concise and focused, encapsulating a single, coherent change or improvement that can be reviewed in context. Extremely small PRs are not helpful for providing context, and very large PRs can be overwhelming and difficult to revert.
-
If a new feature isn't yet complete, use feature flags that allow partial functionality to be committed and tested without impacting users.
On pair programming
-
Pair programming is a practice where two people work together, typically on the same machine in real time. It can be especially helpful if one is a senior dev mentoring a junior dev, providing a high-bandwidth communication channel and real-time feedback.
-
Pair programming was popularized in Extreme Programming (XP). It is similar to code review, but occurs synchronously and can catch issues earlier. Async code reviews (via PRs) often complement or replace pair programming.
Note: Some projects (e.g., Python) don't produce traditional compiled outputs. Adjust your CI/CD pipeline accordingly.
Common Project Layouts (C#, Python, JavaScript/TypeScript, Java)
Below is a concise overview of typical project structures. Adapt them based on your specific needs.
C# Project Layout
- /src: Main source code.
- ProjectName: Contains .cs files and ProjectName.csproj
- /tests: Unit and integration tests.
- ProjectName.Tests.csproj
- /docs: Documentation.
- /lib: Libraries not in package managers.
- /tools: Build and related tools.
- /scripts: Build, deployment, and migration scripts.
- /packages: NuGet packages (less common in .NET Core).
- /.git: Git metadata.
- .gitignore & .gitattributes: Git configuration.
- /bin: Compiled binaries.
- /bin/Debug
- /bin/Release (usually for deployment)
- /obj: Intermediate files (not for deployment).
Python Project Layout
- /src (optional): Main source code.
- your_package_name: .py files
- /tests: Unit tests (often using pytest).
- /docs: Documentation (e.g., Sphinx).
- /scripts: Utility or migration scripts.
- /data: Datasets or config files.
- /venv or /env: Virtual environment folder (ignored in .gitignore).
- setup.py: Packaging and distribution script.
- requirements.txt: Dependencies list.
- .gitignore: Git ignore rules.
Deployment often involves installing dependencies from requirements.txt using pip in a fresh environment.
JavaScript/TypeScript Project Layout
- /src: Main source code.
- /components (for React, etc.)
- /models or /types
- /assets
- /utils or /lib
- /dist or /build: Transpiled/compiled output (for deployment).
- /tests or **/**tests****: Unit/integration tests with Jest/Mocha, etc.
- /public: Static assets (index.html, CSS, etc.).
- /node_modules: Installed dependencies (ignored in Git).
- package.json: Project metadata and dependencies.
- package-lock.json or yarn.lock: Exact versions for deterministic builds.
- tsconfig.json: TypeScript compiler config (if using TS).
- .gitignore: Git ignore rules.
- .eslintrc / .prettierrc: Linter/formatter configs.
Java Project Layout
- /src: Main code/resources.
- /main/java (source code)
- /main/resources (config, images, etc.)
- /test/java (test code)
- /test/resources (test resources)
- /target or /build: Compiled artifacts (JARs, WARs).
- pom.xml (Maven) or build.gradle (Gradle).
- .gitignore: Ignore rules.
- README.md: Documentation.
Deployment and Release Strategies
Commonly used deployment strategies in CI/CD:
- Blue-Green Deployment
- Two environments: Blue (current production) and Green (new version). Switch traffic to Green when ready.
- Advantages: Quick rollback, reduced downtime.
- Disadvantages: Requires duplicated environments.
- Canary Deployment
- Gradual rollout to a subset of users before expanding to all.
- Advantages: Early detection of issues, reduced risk.
- Disadvantages: Requires sophisticated routing and monitoring.
- Rolling Deployment
- Incrementally replace old version instances with new.
- Advantages: Simpler than Blue-Green in terms of environment duplication.
- Disadvantages: Multiple versions run simultaneously during rollout, complicating rollback.
- Feature Toggles (Feature Flags)
- Deploy code behind flags; enable features when ready.
- Advantages: Granular control, quick rollback without redeploy.
- Disadvantages: Adds complexity if toggles are not well managed.
- Shadow Deployment
- New version runs alongside old in production, but real traffic doesn't affect live users.
- Advantages: Test with real traffic without user impact.
- Disadvantages: Resource-intensive, requires traffic mirroring setup.
The best strategy depends on your application, infrastructure, and team capabilities. Many organizations use a combination of these based on their needs.
Security and reproducibility
Add Git Credential Manager here too and say to use OAuth instead of PATs
Setting up security policies
-
Security is very important when working with continuous integration repositories. This is because continuous integration has an achilles heel: it makes it very easy to get changes to production, which means that attackers can also make malicious changes to production easily. Therefore, it is important that you have strong security policies to make sure that only authorized users are able to access the repository and to perform certain actions. This means that one has to prevent a single unauthorized account from doing bad changes.
-
Right now, each developer has an identity. This means that if a developer's account is compromised, then the damage can be tracked and the account can be disabled or reset.
-
Make sure that a PR requires at least two approvers in order to be merged (not including the person who authored the PR.) These policies are usually managed by your CI/CD software. Of course, if there is only a single person on the team (or two people), then it might not make sense for two people to approve.
Useful References
- Security best practices - Azure DevOps | Microsoft Learn
- Use Azure Key Vault secrets in GitLab CI/CD | GitLab
- Security hardening for GitHub Actions - GitHub Docs
After reviewing the information from Azure DevOps, GitLab, and GitHub Actions, we can combine the similar points and extract general themes as follows:
1. Authentication and Access Control
-
User and Admin Access: Always grant the least required permissions. Use systems like Microsoft Entra Privileged Identity Management (PIM) for Azure or ID Tokens for OpenID Connect (OIDC) Authentication in GitLab for tighter access controls.
-
Tokens and Service Accounts: Use tokens like the GITHUB_TOKEN in GitHub, service principals in Azure, and ID tokens in GitLab with specific scopes. Service accounts should have limited privileges and zero interactive sign-in rights. PATs (Personal Access Tokens) should be scoped, time-limited, and securely stored.
-
Cross-repository Access and Service Connections: Scope access strictly to necessary resources, using service connections or authentication tokens, and avoid broad permissions.
2. Pipeline and Workflow Security
-
Pipeline Construction and Execution: Use templates in Azure Pipelines, manage definitions with YAML, and enforce code review policies. In GitLab, make use of project-level secure files. Ensure jobs, like in GitHub Actions, run on specific branches only and sanitize inputs in build scripts.
-
Runner Impact and Management: Understand the potential risks with compromised runners (e.g., in GitHub Actions). Utilize hardening measures, and if self-hosting runners, ensure they're isolated and grouped properly. Consider ephemeral runners for added security.
-
Secret Management: Store secrets securely, using tools like Azure KeyVault, HashiCorp Vault in GitLab, or avoid logging them in pipeline variables. Use specific CI/CD variables for third-party integrations.
3. Third-Party Integrations and Tools
-
Integration Best Practices: Disable outdated or insecure methods, like Azure Classic service connections or PAT-based GitHub authentication. When integrating GitHub with Azure DevOps, avoid personal accounts.
-
Tooling and Automated Checks: Use tools like OpenSSF Scorecards in GitHub to detect supply chain risks, and consider tools for downloading secure files in GitLab or checking software bills of materials (SBOM) in GitHub runners.
4. Auditing and Monitoring
-
Logging and Error Checks: Monitor service account activity, utilize security logs for account activities, and audit logs for organization activities (especially in platforms like GitHub). In GitLab, use error messages and administrative tools for diagnosing issues.
-
Repository and Branch Monitoring: Implement repository-specific security policies, disable potentially insecure features like repository forking in Azure, and monitor production build definitions for potential credential leaks.
5. Deployment and Service Configuration
-
Service Connection Scope: In Azure DevOps, specifically scope service connections to necessary resources. Avoid generic contributor rights and use purpose-specific team accounts.
-
Environment Distinction: Maintain a clear boundary between test environments and production. Ensure production secrets are kept separate and securely stored.
By consolidating similar points across the three platforms (Azure DevOps, GitLab, and GitHub Actions), these general themes provide an overarching perspective on best security practices in DevOps environments.
The integration of security into the development and deployment lifecycle is an essential part of modern software practices. The term "DevSecOps" has emerged to emphasize this integration, underscoring the importance of security throughout the DevOps lifecycle. When it comes to books about CI/CD and even broader software development topics, there are several security-related areas that are often underemphasized or overlooked:
-
Shift-Left Security The idea behind "shifting security left" is to integrate security considerations and checks earlier in the development process. While some CI/CD books might touch on automated testing or code quality checks, they may not delve into integrating security scanning tools, static analysis for security vulnerabilities, or dependency checks in the early stages of the pipeline.
-
Secrets Management Handling API keys, database credentials, certificates, and other secrets is critical in CI/CD pipelines. Many books might not detail best practices for secrets management, like using secret managers (e.g., HashiCorp Vault, AWS Secrets Manager) or how to rotate and revoke secrets.
-
Immutable Infrastructure The concept of immutability, where infrastructure is never modified after it's deployed (and is instead replaced), can enhance security. This approach reduces the attack surface and ensures consistency. Many books might not discuss the security benefits of this method in detail.
-
Container Security As containerized applications and microservices architectures become more popular, securing containers is paramount. This includes scanning container images for vulnerabilities, ensuring containers run with minimal permissions, and using trusted base images. Many books might not go into the intricacies of container security.
-
Infrastructure as Code (IaC) Security IaC tools like Terraform or CloudFormation have their vulnerabilities. Some books might not discuss how to secure IaC scripts, best practices for code reviews, or the importance of scanning IaC for misconfigurations.
-
Runtime Application Self-Protection (RASP) RASP solutions provide real-time application security, detecting and blocking attacks in real-time. The integration of RASP into CI/CD might be an overlooked topic in many beginner books.
-
DAST and SAST Dynamic Application Security Testing (DAST) and Static Application Security Testing (SAST) are methodologies for identifying vulnerabilities in running applications and source code, respectively. Their integration into CI/CD pipelines can be crucial but might not be thoroughly covered.
-
Incident Response in CI/CD How to handle security incidents, particularly in a CI/CD context (like rolling back insecure deployments or patching in a CI/CD model), can be a topic that's glossed over.
-
Supply Chain Attacks Ensuring the integrity of software components, packages, and dependencies is critical to prevent supply chain attacks. Some books might not delve into the importance of verifying component integrity or the risks of using outdated or compromised packages.
-
Compliance and Auditing In regulated industries, compliance with security standards is mandatory. How to ensure and validate compliance in a CI/CD model might not always be explored in depth.
Given the importance of security in today's software landscape, those interested in CI/CD should seek out resources that give due attention to security considerations. If a general CI/CD book doesn't cover security in depth, consider complementing it with resources specifically focused on DevSecOps and security best practices in the context of modern software development and deployment.
-
https://stackoverflow.com/a/49552383/220935 for using the job token instead of long-lived ssh keys to clone repo
-
Automatic token authentication - GitHub Docs github auth token, don't use ssh keys pls
Why is security important?
-
Why care about CI/CD security? Isn't it all containerized and isolated anyway?
-
The goal of CI/CD is about making it super easy to move changes from a developer's workstation and into production as quickly as possible. This means that malicious code can also make its way to production easily.
-
The issue is that isolation can only go so far. Isolation is between other containers or VMs on the host, but does not protect the contents inside of the VM. This means that unauthorized users may run code or have it added to the build artifacts. It also does not prevent isolation from the internet, that is, if the pipeline downloads a malicious resource, then it can run it in the pipeline, and infect the build artifacts.
-
Unauthorized users could create branches that contain malicious code that is run on the CI. This could cause intellectual property to be leaked, such as the contents of the source code on the CI pipeline being uploaded to another server. This is because it is usually possible to change the build script.
-
This is of special importance because the pipeline usually contains secrets, injected through environment variables or added to temporary files in the machine. Malicious scripts may gain access to these credentials and can provision other VMs and resources outside of the pipeline. For example, using API keys.
-
The exact process to set up YubiKeys and other devices varies depending on the device used, therefore, the instructions won't be provided in great detail here. However, I will go over an outline. The general thread is that engineers are issued a physical device that they can use to log in. The device does not usually store passwords and should not be considered a password manager. Engineers should contact the server administrator immediately if they suspect that their device has been lost or stolen. YubiKeys (and other devices) can't protect against every single possible threat, in fact, nothing can. Make sure that you have backup authentication methods in case your YubiKey is not available or it is lost (and you need to recover your account via the administrator.) YubiKeys can also be used on an individual level too to increase your security.
-
How do I secure production? I already have 2FA set up and I get an SMS. Why is that considered insecure, I never let my phone out of my sight, right? Go into SMS attacks/SIM attacks.
-
How do I make it so that another engineer has to approve someone else's request to access production systems outside of the CD pipeline? All major cloud providers support this scenario. It might be called "Azure Privileged Identity Management (PIM)", "Google Cloud Identity Platform", or "AWS SSO". For other cloud providers, see their RBAC (Role Based Access Control) or permissions pages to see if they support this scenario.
-
Start with security when you start with your stories/tasks, don't re-engineer after-the-fact. Add tests for security.
-
Only authorized users should have access to the codebase to download artifacts.
-
Security monitoring on server side, making sure that application does not make strange HTTP requests.
-
Keep secrets out of codebase
-
SBOMs (secure bill of materials)
-
Many application security scanning tools
-
Secret scanning
-
There might be unintentional security vulnerabilities in your application, such as embedding passwords inside of the build artifacts that are then published to customers.
-
Packages used on CI servers may have security vulnerabilities, some which may have not been reported yet. Some genuine packages may have security vulnerabilities.
-
This has happened on numerous occasions. For example, the removed packages from npm.
-
Malicious use of resources. Even if nothing infects the build artifacts, or remains undetected, it can use excessive CPU and make the builds take longer. This can cost the organization money and resources.
-
Expose security telemetry to developers (Pragmatic Pipeline Security - James Wickett - YouTube) for example seeing attacks and being able to mitigate them if they are surfaced
-
CICD-SEC-1: attackers can push code to branch(es) (or artifact(s) that are used in production) that are then (auto-)merged and deployed to production.
-
CICD-SEC-2: production identities are not secured, or production lacks the right ACLs and gives too many people access.
-
CICD-SEC-3: a dependency is compromised in a package by an attacker publishing a malicious version or by typojacking a legitimate dependency.
-
CICD-SEC-4: changing the build script causes the pipeline to re-run, thus executing the attacker's code in the build script.
-
CICD-SEC-5: pipelines are highly privileged and usually contain many secrets/passwords/access to production systems; malicious code can take advantage of this if it executes on the pipeline runner.
-
CICD-SEC-6: credentials printed to logs, embedded in code, embedded in images, or are unrotated.
-
CICD-SEC-7: generic advice on securing CI/CD architecture.
-
CICD-SEC-8: 3rd party apps linked to your account are too permissive and request too many permissions.
-
CICD-SEC-9: make sure to check checksums of things downloaded, sign your code and artifacts.
-
CICD-SEC-10: make sure to have sufficient logging and auditing set up.
-
Sandboxed does not mean intellectual property is safe
-
Anything can be uploaded to a server in the post-install scripts. To check which packages have these scripts (or scripts in general):
```bash
npm view js-common --json | jq .scripts
- Use example of ransomware npm package as an example
- [https://stackoverflow.com/a/68865402/220935](https://stackoverflow.com/a/68865402/220935) can help identify which package's install scripts are causing issues (disable each type of script, re-run build and verify)
- [FOSDEM 2023 - The 7 key ingredients of a great SBOM (archive.org)](https://web.archive.org/web/20230604142619/https://fosdem.org/2023/schedule/event/sbom_key_ingredients/)
- Best practices, such as not including API keys in your CI pipeline because they can be slowly dispersed throughout the organization and shared amongst multiple people, and might not obey the same security policies as the rest of the code.
- Static code analysis for security issues, as well as malware within the pipeline itself (e.g., malicious packages published to npm.)
- Make sure that only authorized people have access to the pipeline and can push stuff to it
- If running an open-source project, make sure that people can't submit PRs and run cryptominers and such
- Make the runners stateless to prevent secrets from being written to disk for long periods
- Don't print passwords to the console or API keys as those are written to the logs (which are stored for a long time)
- Signing the application does not mean that the build is reproducible. The fact that the build is reproducible is different from signing, because you can sign malware.
- Authentication data is hardcoded (in clear) under VCS (BP29)
- " "Authentication data is hardcoded (in clear) under VCS" bad smell (BP29), is considered still relevant by our survey participants since it is mainly related to security issues"
- Hardcoded application credentials are a security risk, because these credentials can be read by other developers. These credentials will then exist unencrypted on harddrives, meaning they can be part of backups, spread, or be read by other programs on the machine. Developers may use the credentials to do testing, even though those credentials should not be used for that purpose.
- If working on an open-source application, credentials will be immediately taken advantage of if they are pushed to a public repository. While there are security scanners that usually revoke the credentials, this in and of itself makes it an inconvenience.
- It also makes the application unportable because the credentials must be manually changed.
- Counterpoints:
- Rapid prototyping or test applications can hardcode their credentials, because setting up the necessary infrastructure can be time consuming. It may also require service connections and other boilerplate work that reduce the velocity.
- [Sabotage: Code added to popular NPM package wiped files in Russia and Belarus | Ars Technica](https://arstechnica.com/information-technology/2022/03/sabotage-code-added-to-popular-npm-package-wiped-files-in-russia-and-belarus/)
## Malicious Code in Open-Source Software Targets Russia and Belarus
### Overview
A developer inserted malicious code into the popular open-source package, node-ipc, targeting computers in Russia and Belarus. This act stirred controversy within the open-source community and raised concerns regarding the safety of free software.
### Key Points
1. **The Software Affected**
- The software, node-ipc, enhances other open-source code libraries with remote interprocess communication and neural networking capabilities.
- As a dependency, node-ipc is automatically downloaded and integrated into other libraries, such as Vue.js CLI, which receives over 1 million weekly downloads.
2. **Malicious Action**
- The author of node-ipc introduced a version of the library that identified and sabotaged computers in Russia and Belarus, countries involved in the invasion of Ukraine.
- This malicious version identified developers based on their IP addresses. If the IP address was traced back to Russia or Belarus, the version would delete files and replace them with a heart emoji.
- To hide this malicious code, the author, Brandon Nozaki Miller, encoded the changes, making it challenging for users to detect the issue by visual inspection.
3. **The Fallout**
- Liran Tal, a researcher at Snyk, pointed out that this act represents a significant security risk for any system using the affected npm package if geolocated to Russia or Belarus.
- Tal highlighted that the node-ipc author manages 40 other libraries, raising concerns about potential malicious activity in those libraries as well.
- Many in the open-source community criticized the author’s actions, raising questions about trust and the implications of such aggressive actions on the author’s reputation and stake in the developer community.
4. **Protestware Emergence**
- The malicious node-ipc update is an example of what’s being termed “protestware.”
- Other open-source projects have also released updates protesting Russia’s actions in the war.
- This incident underscores the potential risks when individual developers can significantly impact many applications through open-source contributions.
5. **Past Incidents**
- In January, another incident occurred when a developer’s update to two JavaScript libraries, with over 22 million downloads, caused over 21,000 dependent applications to malfunction.
6. **Resolution**
- After the discovery of the malicious code, the developer released updates to remove it from node-ipc versions 10.1.1 and 10.1.2.
- Snyk advises developers to cease using the compromised package or use an npm package manager to override the affected versions.
7. **Snyk’s Statement**
- While Snyk supports Ukraine, they emphasized that such intentional abuse damages the global open-source community, leading them to flag the affected node-ipc versions as security vulnerabilities.
### Secure resource and Managed Secrets and Key Management Service
#### How to store keys in KeyVault
#### How to get keys in pipeline
#### Using service principals
- When you open your door to your house, you use a key which is a proxy for authenticating you to access the house (through authorization.) When using an API, you can use an API key, which is similar. It authenticates you to the service, and the API's backend authorizes you to make requests. The issue with this approach is that it is not tied to an identity, that is, whoever has the key is the person who is allowed to make the requests. This is not good because many people can use the same key, or someone can steal it. They are also difficult to rotate, as doing so requires scanning your entire codebase, rotating them, and replacing them.
- Run a static security analysis tool to find secrets currently in the codebase, and then rotate them. Once they are committed then it is too late, it is not possible to erase it because it exists in logs and has violated its RBAC boundary.
- How do I know if a secret has been previously committed to the source code? Use [https://stackoverflow.com/a/48739656/220935](https://stackoverflow.com/a/48739656/220935) to search through the commits. Note that you may want to try other permutations, such as base64 encoding the string (locally) and doing other forms of fuzzy matching. If it has been committed, then it is recommended that you rotate it.
- If you are approving PRs, then it might be useful to have a proof-of-presence (or YubiKey) to show that there is something physically present approving the PRs. This should minimally slow down the development (it takes about 30 seconds or less to authenticate.) Make sure that these work across VMs/screen sharing etc.
- I don't need to know or see what the keys are. A better approach is to dynamically inject them into the environment at runtime, using a secure key provider that stores them in a vault. When requesting them, the provider should authenticate and authorize me to access the keys.
- The issue with this approach however is that the keys are still available to the application, and the application may accidentally log the keys, or a hacker may inject malicious code into the pipeline to access the keys. Additionally, developers may have to copy the keys locally to do testing and may unintentionally leak them. Since there are no ACLs on the keys, anyone with the keys can still use them and waste resources.
- A better approach is to not use keys at all, or, to never allow the user access to see the key.
- What does shifting left on security mean? It means avoiding reactive approaches for security. Security in pipelines usually takes a very reactive approach rather than a proactive approach. For example, secret scanning checks for keys that exist in the source code. I don't think there should even be the possibility of having a key generated by an app for an API. These should be managed identities or identities of some kind that are created in the pipeline's environment through a service connection. There are no tokens or anything to manage, and no secret keys that might have the opportunity to be released to the world. There should, in theory, be nothing for the security token static analysis to report because the tokens do not exist in the source code because there are no tokens to manage and no tokens are provided to the user (e.g., API keys.) Everything is given to the pipeline at runtime with limited lifetimes, and the tokens are revoked once the pipeline finishes.
- The issue with storing API keys in source code is that the keys are no longer subject to RBAC. They can exist wherever the source code exists, which may mean that they unintentionally cross security boundaries.
- If someone compromises your API key, then they can use it anywhere until it's rotated. It is also difficult to determine who has access to it, because requests are just made using the same key, so there isn't a form of identity. Cloud services re-use the same IPs (including pipelines), thus, this makes the challenge of finding out if the key was compromised more difficult.
- You could consider using usernames, but this merely means that a username has to be specified with the key in order to use it. This effectively makes the key longer, but it's trivial to get the username.
- Storing the key in a secure location helps, but the key still exists in plaintext. It might be behind authentication, for example. It's still injected in plaintext and passed to the API, so your program still has to see it. It might be injected into environment variables, which allows attackers to view it. It doesn't matter how secure you store it, whether it's in an HSM, at the end of the day, it's in plaintext.
- A better solution would be to use token-based auth, and authenticate against an identity. It is still possible for attackers to retrieve the token and authenticate against your API. However, you now know precisely when and where the token was compromised, and will know that it expires in a few hours (or less), compared to an API key that might exist anywhere for any length of time.
- Think about what would happen if the API key was released. Would they be able to run up costs? Or, is it restricted to a certain rate limit? Would it be an annoyance, or could they access customer data?
- You'd want to have firewalls in your pipeline to prevent data exfiltration as well. Although this might make it painful to try to set up new dependencies or software that require external resources so it could inhibit development. If the pipeline doesn't need to access external resources, or at least often, then it might make sense to add a firewall with some exceptions. Why can't things be packaged for offline access?
### Role-based access control (RBAC)
#### Permissions
#### Who to give permissions to
- Auditing permissions
- Team doesn't need writable tokens if they're just going to download packages (writes should require special perms unless everyone is publishing packages.) Easy to request perhaps.
- Try to make permission sets for different scenarios. This will avoid giving people arbitrary permissions, and also help understand what people are capable of. It also makes it easy to "undo" a particular permission scenario by just removing that scenario instead of trying to manually identify which permissions were in use for this scenario (as they might overlap.)
#### Lifecycle management
- Assign permissions to a group or team, rather than to individual employees, to ensure continuity even if someone leaves the company. This might be iffy if the group has a lot of permissions because then anyone can easily get access.
### Popular security static analysis tools
- Open-Source Tools
- FindBugs with FindSecBugs Plugin: A static code analysis tool for Java that can identify security vulnerabilities with the FindSecBugs plugin.
- Checkmarx: Although primarily a commercial tool, Checkmarx does offer a limited free version that performs static code analysis for multiple languages.
- Bandit: Focuses on Python codebase and is designed to find common security issues.
- Brakeman: A static analysis tool for Ruby on Rails applications.
- SonarQube: Offers various language plugins and detects many types of vulnerabilities. The Community Edition is free.
- ESLint with Security Plugin: A widely-used linting tool for JavaScript that can also be used for security checks with the right set of plugins.
- Flawfinder: Scans C and C++.
- Cppcheck: Another static analysis tool for C/C++ codebases.
- YASCA (Yet Another Source Code Analyzer): Supports multiple languages including Java, C/C++, and HTML, but focuses primarily on web vulnerabilities.
- Commercial Tools
- Checkmarx: A leading SAST tool that supports multiple programming languages and is designed for enterprise use.
- Veracode: Offers a static analysis service as part of a larger application security suite.
- Fortify Static Code Analyzer: Provided by Micro Focus, it covers multiple languages and offers integration with IDEs and CI/CD tools.
- IBM AppScan: Focuses on identifying vulnerabilities in web and mobile applications, supporting multiple programming languages.
- Kiuwan: Offers a broad range of language support and integrates with various IDEs and CI/CD tools.
- Synopsys Coverity: Supports multiple languages and offers CI/CD integration.
- GitLab Ultimate: Built-in SAST in their Ultimate plan. It supports many languages and is integrated directly into the GitLab CI/CD pipeline.
### Commit signing
- I have not had a user-friendly experience with commit signing, but I'm hoping that tools have evolved since then and it is easier to do.
- Is there a way to easily debug common issues with commit signing? Maybe by trying to sign a file manually with your key and verify that it works? Is there an exe that git uses internally to sign the commits?
- [amazon.ca/Yubico-YubiKey-NFC-Authentication-USB/dp/B07HBD71HL](https://www.amazon.ca/Yubico-YubiKey-NFC-Authentication-USB/dp/B07HBD71HL?th=1)
- 
## Signing commits using a YubiKey and Git
Signing commits using a YubiKey and Git involves several steps, but it provides an added layer of security to your Git workflow. A YubiKey is a hardware security module (HSM) that can store private keys securely, making it harder for malicious actors to access them. By following the steps below, you’ll be able to sign your Git commits using the private key stored on your YubiKey:
1. **Prerequisites**:
- Ensure you have a YubiKey that supports OpenPGP.
- Install GnuPG (`gpg`).
- Install Git.
2. **Set Up GnuPG with YubiKey**:
a. Insert your YubiKey and check if GnuPG recognizes it:
```bash
gpg --card-status
b. If it's a new YubiKey, you might need to generate a new key pair:
gpg --card-edit
admin
generate
- Configure Git to Use GPG: a. Tell Git about GPG:
```bash
  git config --global gpg.program $(which gpg)
b. Get your GPG key ID (usually the last 8 characters):

```bash
gpg --list-secret-keys
You should see output that looks like:
sec rsa4096/1234ABCD1234ABCD 2022-01-01 [SC]
In this case, 1234ABCD1234ABCD is the key ID.
c. Tell Git to use this GPG key for signing:
```bash
  git config --global user.signingkey 1234ABCD1234ABCD
4. **Automatically Sign All Commits**:
If you want to sign all commits by default in every Git repository on your computer, run:

```bash
```bash
  git config --global commit.gpgsign true
5. **Signing a Commit**:
If you haven’t enabled automatic signing, you can sign individual commits using the `-S` flag:

```bash
```bash
  git commit -S -m "Your commit message"
6. **Verify Signed Commits**:
To verify the signed commit:

```bash
```bash
  git log --show-signature
This will show if the commit was signed and if the signature was valid.

7. **Pushing and Working Remotely**:
When you push your signed commits to platforms like GitHub or GitLab, they should recognize and display the "Verified" badge next to each signed commit, confirming its authenticity.

8. **Using Pinentry for Passphrase Prompting**:
If you’re using the passphrase for your GPG key and working in a GUI environment, you might need `pinentry` to be set up correctly for passphrase prompting.

Check your `gpg-agent.conf` (often located in `~/.gnupg/gpg-agent.conf`) and ensure it has the appropriate pinentry program set, for example:
pinentry-program /usr/bin/pinentry-gtk-2
Restart `gpg-agent` after making changes:

```bash
gpgconf --kill gpg-agent
Remember, while signing commits vouches for the integrity of the commit (i.e., that it has not been tampered with), it does not attest to the quality or safety of the code within the commit. Always review code carefully, regardless of its signature status.
If you do not have a YubiKey, you can use GPG with keys stored securely somewhere on your computer.
Commit Signing with GPG (Without a YubiKey)
Commit signing in Git adds an extra layer of integrity checks to your project by showing that a commit was made by a particular individual and has not been tampered with. This is accomplished using GPG (GNU Privacy Guard) to sign your commits. Here are step-by-step instructions:
Step 1: Install GPG
- Linux: You can install GPG using the package manager for your specific Linux distribution. For Ubuntu/Debian:
sudo apt-get update
sudo apt-get install gnupg
- macOS: If you have Homebrew installed, you can run:
brew install gnupg
- Windows: Download and install it from the official website.
Step 2: Generate a GPG Key Pair
Open your terminal and enter the following command:
gpg --full-gen-key
You will be asked for the kind of key you want, its size, and the duration the key should be valid. Generally, the default settings are good enough. Finally, you’ll be asked for your user ID (email) and a passphrase.
Step 3: List GPG Keys
Run the following command to list the GPG keys for which you have both a public and private key pair:
gpg --list-secret-keys --keyid-format LONG
Step 4: Add GPG Key to Git Config
From the list of GPG keys, copy the GPG key ID you’d like to use. It’s the part after the / in the sec row. Next, set that GPG key in your Git configuration:
git config --global user.signingkey [your-key-id-here]
Step 5: Enable Automatic Commit Signing
You can configure Git to sign all commits by default for a repository or globally. To enable it for all repos, use:
git config --global commit.gpgsign true
For a single repo, navigate to the repository directory and run:
git config commit.gpgsign true
Step 6: Add GPG Key to GitHub/GitLab/Other
- To get the GPG public key, use:
gpg --armor --export [your-key-id-here]
- Copy the GPG key, beginning with
-----BEGIN PGP PUBLIC KEY BLOCK-----and ending with-----END PGP PUBLIC KEY BLOCK-----. - Add this key to your GitHub/GitLab account.
- On GitHub, go to Settings → SSH and GPG keys → New GPG key.
- On GitLab, go to User Settings → GPG Keys → Add Key.
Step 7: Tell Git About Your GPG Key (Optional)
If you are using different key pairs or your machine doesn’t pick the right one, you can set the GPG program and the signing key for each repo or globally.
For each repo, navigate to its directory and run:
git config user.signingkey [your-key-id-here]
Or globally:
git config --global user.signingkey [your-key-id-here]
Step 8: Verify Your Commits
After these steps, your commits should be signed, and you can verify them with:
git log --show-signature
This should show that your commits are GPG signed.
That’s it! You’ve now set up GPG signing for your Git commits. This adds a layer of security to your project, ensuring that your commits are verified as coming from you.
Introduction to Reproducible Builds
What is determinism and nondeterminism?
-
Deterministic builds are builds that generate identical build artifacts when given the same inputs in the same environment.
-
Non Determinism thus is the opposite of deterministic, which means that the output could be unpredictable.
What causes non deterministic behavior?
-
Non-determinism can be caused by several sources, such as filesystem inodes, threading, I/O accesses, different payloads after downloading software, datetimes, modification dates, intentional non-determinism (e.g., guids.) Usually, modification dates, dates in general, and things that are intentionally non-deterministic (such as guids/ids) are the most common sources. To fix non-determinism, you must make something deterministic. Therefore, make the modification dates the same (or don't package the modification date), and make sure that the inputs are the same each time. For example, if your application is creating artifacts to be put in a tar file, and they are of a different order each time, then instead order them by something that is deterministic, such as their filename. This will prevent issues with re-ordering in the archives. This has a very large scope, because you have to understand file formats and go very deep into the build process to make things deterministic. This requires a lot of time and energy, and in some cases you may have to do a lot of debugging, as some scripts may interact with other scripts in different ways that can't be easily Google'd because they are specific to your setup.
-
Sources of non-determinism
- memory cache, tlb misses, SMI's (from BIOS)
-
Configuration files: Often changed and can lead to errors if not managed correctly.
-
I/O operations: Frequent in CI/CD processes, potential for errors.
-
File system operations: Common, can lead to issues.
-
Access to external services: Calls to databases, other services are frequent.
-
Networking: Network-related issues are relatively common.
-
Use of environment variables: Often used and can be misconfigured.
-
System time: Time differences can affect synchronization and scheduling.
-
Time-related functions: Used for delays, timeouts, etc.
-
Creating tars/zips, different versions of software: Specific to deployment tasks, less likely to be an issue in builds.
-
OS scheduling policies: Can affect the order of job processing.
-
Memory allocation: Depending on the tasks, could be an issue.
-
Non-deterministic thread scheduling: Multithreading is common but the OS scheduler may not always behave as expected.
-
Race conditions: Likely if improper synchronization in concurrent settings.
-
Context switching: Likely to happen but usually well-handled.
-
Signal handling: Used less frequently, but still possible.
-
CPU cache: Even less likely, specific to certain types of jobs.
-
This might be as innocuous as changing the date inside of an executable to the time it was built, or something that changes the actual code itself, such as a simple bit flip. These would normally appear as small changes to the executable code. But bit flips can have dire consequences, especially if they are done maliciously.
-
Concurrency is only possible when tasks are interleaved, dictated by the OS scheduler. Given that the OS scheduler is not deterministic, therefore, tasks may not be deterministic.
-
This is different from data races, where outputs might be overwritten or whose order matters.
-
For example, if a program that sums numbers doesn't care which array element was populated first, as long as the final array output contains the right elements. This can speed up processes on multi-core processors, which is why concurrency is normally used.
-
An OS isn't meant to be deterministic, in fact, that might slow it down. This is because some operations may take less time due to the nature of the data, or the priority of some other tasks.
-
There are other forms of nondeterminism that don't relate specifically to concurrency. When writing files, they could have any inode and aren't guaranteed to be in a specific order. File listing operations don't care what order they are, and so go through the files as-is. Unfortunately, since they are not sorted, this means that the outputs could be different, and therefore the data could be processed differently. Linux has an I/O scheduler that's not super related but batches up changes so that it is more efficient to write them to disk, maybe briefly mention that.
-
There are multiple layers of nondeterminism, filesystems, listings of files, threading, cores, network, delays, interruptions, other tasks, scheduling, etc.
-
To what extent should builds be reproducible on developers' machines if the CI server is reproducible?
Reproducible & Deterministic Builds
-
"A build is reproducible if given the same source code, build environment and build instructions, any party can recreate bit-by-bit identical copies of all specified artifacts" - Definitions --- reproducible-builds.org
-
It works on my computer! Why doesn't it work on yours? Having predictability and consistency is of paramount importance for single developers, and those who work on teams because you have to be able to run your program and get the same output to make sure it is working correctly. The term was not yet coined at this stage, and was rather a function of just developing software and the ability to not be chaotic. The ability to recreate the same outputs is of critical importance, otherwise it is unclear what the output should be, and whether the program is working correctly. If other developers are unable to reproduce the build (i.e., even the ability to generate viable build artifacts), then they can't integrate their changes.
-
Reproducible builds go a step further and ensure that the actual binaries/build artifacts are identical on a bit-for-bit level (or a strong hash.)
-
Reproducibility can be thought of like a supply chain inside of a supply chain. If you look at the entire software development process, you can model it as a supply chain. For example, there are a set of inputs (e.g., packages), some transformation/development in the middle, and then output(s), such as build artifacts. A CI/CD pipeline is like a mini-supply chain. It takes a set of inputs (e.g., your package), builds it through a few steps, and then produces output(s). Each step in that chain may or may not be reproducible. For example, say that you're compiling some code, it generates some EXEs for example (which are reproducible), and then another step stamps the current timestamp in the file. This would mean that the second step in the process is not reproducible.
-
Reproducible builds are deterministic builds, but across different environments that may or may not have the same exact environment, but the dependencies are the same. For example, different locales, timezones, filesystems, etc. but the commands to create the build are identical, and the versions are identical.
-
When we start talking about reproducibility, we are going further than merely being able to have developers build and run the client application on their computer and all of the features working as intended. It is about having the underlying build artifacts being identical on the filesystem.
-
Reproducibility is a gradient as it is not possible to know for sure if something is truly reproducible forever. For example, the kernel could change, there could be a one in a million race condition, etc. It depends on the effort required to make the build match a hash. If the hash is agreed upon for multiple parties, then it can be accepted as the truth.
-
Stronger version of reproducible builds: cryptographic signing
Importance of Reproducible Builds
-
You want to have some level of reproducibility, otherwise it might not be clear what software you're shipping or if the testing has the capacity to be done correctly (given it could be done on different versions.)
-
Why reproducible builds are important, one bit flip can change app behavior for example
-
The goal is reproducibility is to ensure the binaries/build artifacts are identical between different builds, as even one bit could cause a completely different program behavior. This behavior could be malicious. It's possible that a single bit might not do anything, or it could. Another goal is to prevent bugs due to the build software. For example, if it's creating a different binary each time, is there an internal threading issue/bug in the compiler/build script that might be unintentionally changing the program's behavior, thus, it is not possible to instill confidence in it due to the fact that the application is different each time? It is also important when you are building source code from the source, because it shows that the package has not been modified in transit from the developer's machine and you can trust the source code to some extent. If building using multiple different computers and different compilers, it prevents a malicious compiler from inserting code into the compiled program. This is because all compilers would have to be infected with the code, thus, making the attack much more complex. Theseus's ship analogy here on what is considered the same program.
-
Why reproducible builds? What problems does it solve?
-
Security. If the build artifacts are different every time, then there might be something injecting something in the source code or binary.
-
Improving collaboration and trust in software supply chain
- Shows, to some degree, that a build can be re-created in the future (for example, if there needs to be patches or to reproduce a bug), and also if the compiler is sane (i.e., if it doesn't contain malware, although this is debatable.)
-
To show that the source code can match the binaries. This is important because binaries do not have to correspond to their sources (i.e., if you publish a binary and claim to bundle its sources but it contains malicious software, there is no way of knowing.) The other consumers of your package can't verify it for security flaws as easily.
-
Theseus's ship analogy, to what extent is software the same if the output is different? Two pieces of software can run identically if their binaries are not the same, but adopting Kantian philosophy can be helpful because it allows no room for deviation. This means it is difficult for an attacker to sneak in malicious code.
-
increased debuggability
-
can bisect the pipeline easier
-
security (a hacker can't inject something that wasn't there before)
-
reliability (the same build is built on the dev machine as is on the ci)
-
Builds do not have to be 100% identical to be functionally identical. However, having them 100% identical means there is no interpretation or possibility that the code has to do with non-determinism.
-
Also if customers report bugs in the software, you have to be able to reproduce them locally (with the source code) to rebuild the software product at that point in time
-
Reproducibility isn't all about security, it is about re-creating the same application. This is very important because in order to use the application or to test it, you have to have something that is able to be reproduced. Developers will be unable to make sure that their features work as intended if they cannot run the application in the same way as other people on the team, and it will be unclear what version of the application is shipped to customers. This can make diagnosing bugs very difficult, including rollbacks/roll forwards, because a different version of the application is built each time. A bug might not exist in one copy of the application, and it will be impossible to recreate it from scratch because it is not reproducible.
-
Reproducible builds go a bit farther than merely having the build artifacts being generated and run. It is still possible for build artifacts to differ, even if the VMs are stateless and contain the same filesystem/input files. For example, build software may use random ids or timestamp files, causing them to be different. Two applications may produce identical output, pass all of the tests, but still might not be reproducible or deterministic. There might be slight differences in their code, that, when run, might produce the same output but it contains different instructions or different metadata.
-
Even if the file is on a trusted source and might not be compromised (but see Handbrake as a counterexample), it could have a silent version change (or a DNS takeover) and the file will change. This means that the inputs/process is different, potentially causing the build to be non-reproducible.
media.ccc.de - Reproducible Builds
NVD - CVE-2002-0083 (nist.gov)
Case Study: Understanding the Importance of Source and Binary in CI/CD Pipelines
Background
The subject of this case study aims to delve into the intricate relationship between source code and its compiled binary, highlighting the avenues through which bugs and vulnerabilities can be introduced. The study presents real-world examples, one dating back to 2002 in the OpenSSH server, and conducts a demonstration using a kernel mode rootkit.
The OpenSSH Vulnerability
A bug was identified in 2002 in the OpenSSH server. This bug stemmed from a 'fencepost error'—an off-by-one error—where the programmer mistakenly used the "greater than" condition instead of "greater than or equal to." Upon fixing, this seemingly significant vulnerability turned out to be a difference of just a single bit in the binary. The root cause was identified by comparing assembly and compilation outputs of the vulnerable and the fixed versions.
Key Finding:
A single bit can make the difference between having a remotely exploitable bug and not having one. The study emphasizes the importance of getting the conditions right in the source code because even a small error can lead to catastrophic outcomes.
The Kernel Mode Rootkit Demo
To further the argument, a kernel mode rootkit was written to demonstrate the potential risks during the compilation process. The rootkit altered what source code was read during compilation without changing the actual files on the disk. This meant that standard file integrity checks like SHA-1 sum would report the source code as unaltered, while in reality, a compromised version of the code was being compiled.
Key Finding:
This demo emphasized that the trust we put in our compilers and build environments can be misplaced. Even if the source code on disk is correct, malicious actors can intervene during the compilation process to produce compromised binaries.
Implications and Recommendations
-
Critical Code Review: Even a small mistake in the code can lead to severe vulnerabilities; therefore, rigorous code reviews are vital.
-
Binary Analysis: Going beyond source code, a close inspection of the binary could add another layer of security.
-
Integrity Checks: Trusting the build environment is not enough; integrity checks must be more sophisticated and include in-process monitoring.
Conclusion
This case study stresses the need for increased vigilance at both the source and binary levels to minimize the risks of introducing vulnerabilities in a CI/CD pipeline. From small syntactic errors to rootkits affecting the compilation process, the risks are real and varied, and comprehensive security measures are the need of the hour.
Concrete Examples of Non-Determinism in a Sample Program
// example of non-determinism
async Task<Task> DoWork(int id)
{
    await Task.Delay(TimeSpan.FromSeconds(1));
    Console.WriteLine(id);
    return Task.CompletedTask;
}

var tasks = new List<Task>();

for (int i = 0; i < 10; i++)
{
    tasks.Add(DoWork(i));
}

await Task.WhenAll(tasks.ToArray());

// produces different output depending on when you run it
Sleep is only sleeping for a second; however, it is not exactly a second each time. This is probably jitter, which is not really related to non-determinism.
// example of jitter
async Task DoWork(int id)
{
    await Task.Delay(TimeSpan.FromSeconds(Random.Shared.Next(0, 5)));
    Console.WriteLine(id);
    return;
}

for (int i = 0; i < 10; i++)
{
    await DoWork(i);
}
-
How do I make my builds deterministic?
-
First, check if your builds are already deterministic. Run your build process on a few different computers running the same build tools and compare the hashes of the outputs. You can use diffoscope for this.
-
Managing build environments: It's important to ensure that the environment in which builds are run is as consistent as possible across different machines. This can involve using virtual environments, containers, or other tools to isolate builds from the host system.
-
If everything is different, which build is considered the standard?
-
Get everyone's exact build process steps, just collect steps/workflows. You may have to get screenshots in case there is version info or any potential miscommunications
-
Look at each step and question its purpose and why it is required. If it is not required or does not make sense, flag it for investigation. Look into best practices, depending on your application.
-
Combine all workflows.
-
Lock all deps, including transitive dependencies. For example, use a package-lock.json file or yarn.lock for JavaScript projects.
-
Use a new process, and troubleshoot if anyone is not able to reproduce it correctly.
-
Store all deps in a centralized read only location
-
Use reproducible build options for your build tool.
-
Auto-updates: This can be tricky to manage, as it can be difficult to know what version of a dependency is being used, especially if it is being updated automatically.
-
Managing build logs: This can be helpful in troubleshooting issues with reproducibility, by comparing the logs of different builds.
-
Storing and tracking build information: This can be useful for maintaining a historical record of builds, and for troubleshooting issues with reproducibility.
-
Python pipenv package has a pip.lock file or a similarly-named file that allows for repro'able builds. Also nix is popular.
-
Using deterministic packaging tools: Some packaging tools, such as nix or guix, use deterministic build processes that produce the same output for the same input, even across different machines. This can help ensure that builds are reproducible.
-
Take all of those inputs that generate those file(s) or event(s) and then check if those are firing in a deterministic way.
-
Ordering/sorting can help make things deterministic.
-
Be careful not to go too far, only the final outputs themselves need to be deterministic. For example, internal workings of your application, as long as they are read sequentially, don't need to be single threaded. This will slow things down a lot.
-
Double check calls to specific APIs to diagnose issues where calls that are returned do not align. For example, random numbers and date/time. Start logging outputs, and then if those outputs, when re-run, don't align, then log their dependencies, and continue until the source is found. You may want to assign each log an ID, and then sort the logs afterwards. Then, you can determine where the problem lies by cross-checking the logs.
-
It is difficult to eliminate all forms of nondeterminism, and this isn't really related to thread safety, as something could be thread safe but still nondeterministic. Adding elements to a thread-safe collection is thread safe, but reading them back is not.
-
Auto log all return values from all functions? TTD from Microsoft might help if snapshots can be compared.
-
Trying to make things too deterministic (when it is not needed) can slow down the program.
-
To support reproducible and deterministic builds, you have to version everything because the inputs have to be the same. The best way to do this is to have everything pre-installed in a docker image, and then just upgrade it when you want to upgrade a dependency. This does require extra management, however, so there is a tradeoff.
-
How much nondeterminism is needed?
-
Verifying digital signatures only on JAR files media.ccc.de - Reproducible Builds
-
Software BOMs might help with this
-
Builds (should) according to the talk media.ccc.de - Reproducible Builds be reproducible irrespective of a kernel (e.g, BSD, Linux, Ubuntu, etc.) because this would mean an attacker would have to make a backdoor in all of those kernels for a change to be unnoticed
-
DSC powershell for Windows could be useful
-
Higher level concept of reproducibility is quality, as you can imagine an assembly line creating products, if they are all misshapen then quality control cannot accurately assess the quality, and customers might not be happy. There isn't a threshold or understanding of what the product should be thus it cannot be evaluated against quality standards. Creating a prototype vs. an assembly line?
Tools and Strategies for Debugging and Diagnosis
-
Important to know what is and is not relevant to determinism, and which determinism is applicable
-
The rate at which packets arrive when downloading a file doesn't matter, as long as the file is intact. The rate at which the packets arrive may be nondeterministic, but this nondeterminism is irrelevant. However, it may be relevant in another context (i.e., VoIP where the rate of packets matters, but whether they are intact is less important, as long as the receiver can hear it.) Both delays are non-deterministic in those examples, however, the importance of latency is much higher in the latter case. If the packets arrive somewhat nondeterministically in VoIP, then it can be fixed, in TCP, well, they can arrive nondeterministically but then they are re-ordered prior to application delivery. So here there are multiple layers, some which are irrelevant.
-
You have to be aware of all of the layers of nondeterminism, but must use an executive decision-making process to understand which layers are important at which time.
-
Also depends on the extent that two objects are the same, and whether this counts against something being non-deterministic. For example, do the file(s) or resource(s) have to match precisely? The common definition is yes, they must match exactly (so that there is no interpretation for error.)
-
Excluding files that are not part of the final artifact
-
For example, generated files or log files which are not essential for the final build (files that can be removed and the app will still function normally)
-
Going too far in terms of reproducibility
-
Debugging symbols may require that the assembly has a unique uuid, make sure not to stamp on a fake one just to make the build always reproducible (there are better ways)
-
Make sure application still works after doing changes
-
Understand impact of changes and what other things depend on those metadata items
-
Makefiles for example depend on modification dates (I think) to determine if the build should be re-run. Setting the modification dates to the same might interfere with that.
-
Symbol servers might not be able to identify which assembly belongs to which exe
-
When to change the environment vs. changing yourself?
-
If your app can't possibly know what the next step will be, then change the environment. For example, a file compressor nondeterministically adds files to an archive. It would not make sense to make the file compressor detect that it is compressing this app and do something special.
-
If your app requires the environment to change its behavior, then change the app. For example, LC_ALL variable defines the locale. If the app must be in different locales, then the app can't have a fixed LC_ALL variable because it has to be built for different languages.
-
Verifying
-
Run the pipeline more often to spot failure trends if something is truly unrepro'able when running just a few times
-
Version everything and use package managers when possible (or hashes of packages/installers/versions)
-
Use
tar -W(verify after archiving). This is important because corruption could cause irreproducibility. -
disable tar remote files and maybe globs in files because I can rsh into my server by default which is weird
-
Making everyone use the same OS could be better for reproducibility but might not be possible. This means that more effort has to be put into the build system (or vice-versa.)
-
If the builds do look ok, then take more and more samples and compare them
Troubleshooting reproducibility issues
-
When aiming for reproducible builds, it's essential to check for consistency at various stages of the build process, not just the end. This approach aids in pinpointing issues if any arise.
-
Take, for instance, the compilation of a program. Once compiled, you can cross-check the build artifacts to see if they're consistent across multiple builds. However, other steps like encryption or digital signing might introduce inconsistencies. To handle such scenarios:
-
1. For Encryption: After encrypting, decrypt the application and compare it with the original. If they match, it's likely reproducible unless there's an issue with the decryption tool.
-
2. For Signing: Remove the digital signature and then verify the application's consistency.
-
3. For Obfuscation: Use a consistent seed, preferably derived from the application's state before obfuscation. However, this depends on your security strategy and the capabilities of the library you're using.
-
If you receive inconsistent artifacts from a third-party:
-
- Determine the reason. Are they providing updated versions, has their server been compromised, or are they delivering different versions for tracking reasons?
-
- Engage in discussions with the software provider. If they're not cooperative, consider switching to a different supplier.
-
As a workaround, store the build artifacts you obtain and use those for subsequent builds. This ensures that unexpected changes don't occur in between builds.
-
Step 0: teams
-
If you're on a team, then get each team member to build the software 10 times (preferably on different days of the week) and then submit all artifacts to a central repository. Label each one by their name.
-
Use diffoscope to diagnose whose machines are having issues. For example, check if each developer's build is reproducible, or if they are not reproducible cross-section wise. Put artifacts on a central repository exactly as-is (for example, if delivered as a dmg, tar.gz, zip, etc. even if it is an uncompressed folder.) If each developer can reproduce the build, but together they have different builds, then this could signal different build tool versions or frameworks. If each developer can't build reproducibility on their own machine, then this could be both framework issues, or something with the application build process itself. If there's only a handful of developers who cannot match the team, then it might be because of their environment. Try using containers to standardize the deployment and deps. If there are groups of developers whose builds match, then there might be an environmental issue.
-
To track down the issue, make sure each developer's frameworks are exactly the same. You will have to get versions of all tools, frameworks, OSes, patches, etc.
-
You may have to play peekaboo with your archives.
-
If you save the hash of the file after it is downloaded, then you can theoretically find the same file if the file disappears from the internet
-
Step 1: attempt to find the non-reproducible layer(s)
-
Rationale: Digitally signing multiple identical artifacts could give different hashes (I think) so look inside of the container when doing the comparison. The reproducibility issues may occur at any layer(s)
-
onekey-sec/unblob: Extract files from any kind of container formats (github.com)
- sudo docker run -it --rm --pull always -v ~/extract:/data/output -v ~/files:/data/input ghcr.io/onekey-sec/unblob:latest /data/input/test.bin
-
If it's a compressed file, decompress it
-
Recursively compare all files, and repeat if needed
-
Disable any code obfuscators or protectors
-
Keep hashes of all files on the filesystem and compare them together if the build changes (thus checking if they are part of the dependencies)
-
Pictures are made of pixels but they can be the same except for one pixel, compare them using image comparison tools (jpegs are more complicated because one pixel can affect others)
-
Pseudorandom Number Sequence Test Program (fourmilab.ch) for guessing if a file is compressed, encrypted, or both
-
Pick higher-level tools when necessary. For example, comparing two PDFs could mean to convert them to text first, then compare them. Or convert them to an image and compare them.
-
Go to the file layout manual and check if there is overlap with changes in the file with what the diffs show
-
Do a three-way or four-way diff to determine if there is a pattern to the changes
-
If in doubt, try to change things and see if it fixes it or changes other parts of the file
-
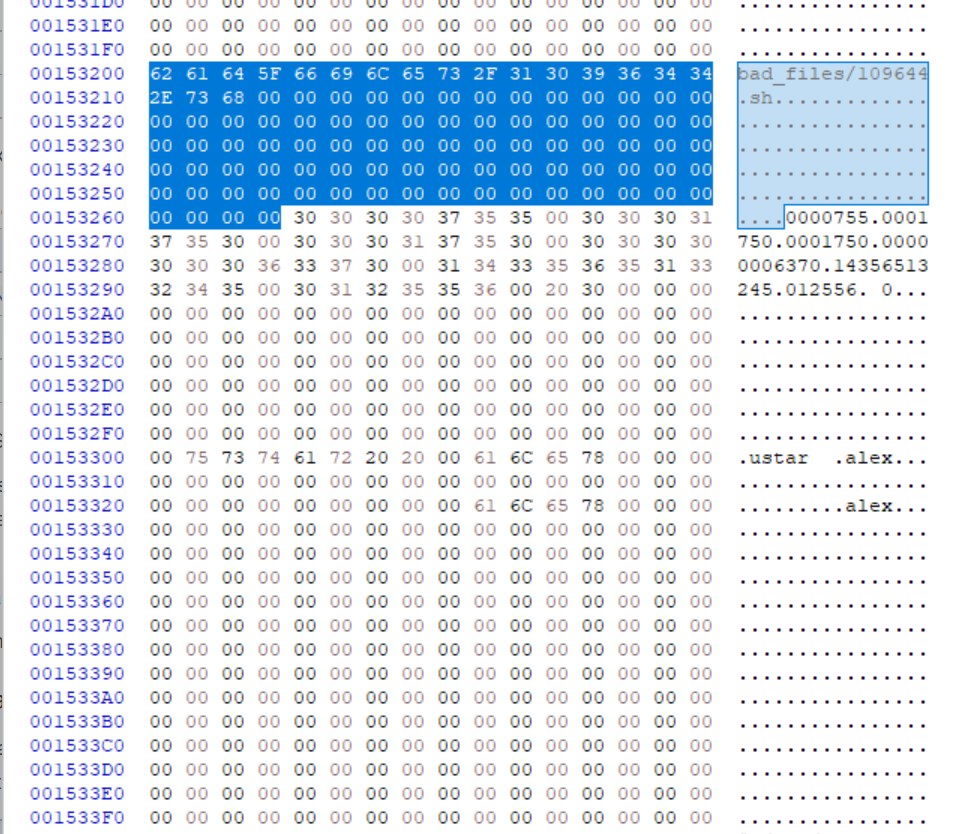
-
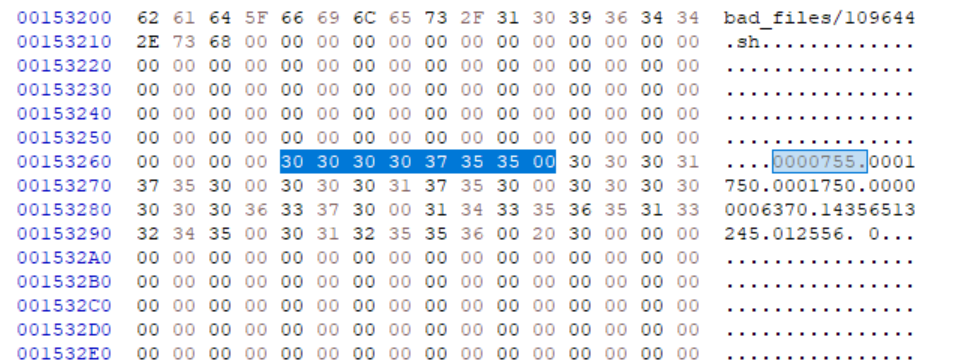
-
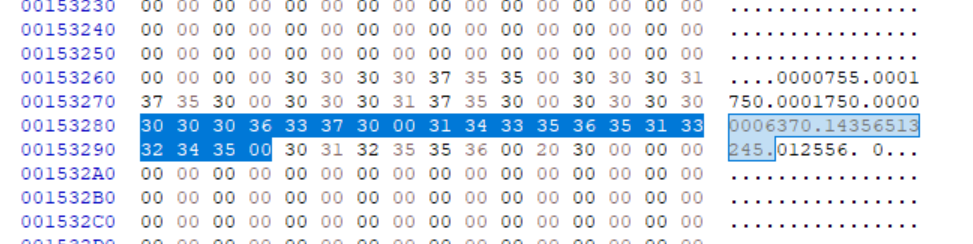
-
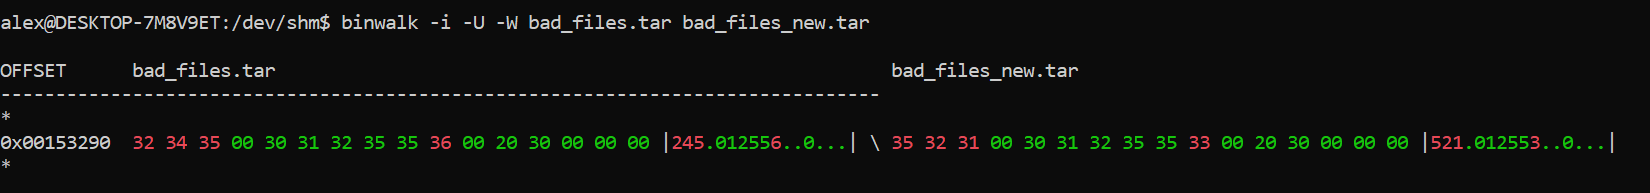
-
This corresponds to the tar (computing) - Wikipedia modification date section in the header (plus header checksum) that is different. This means that the file has a different modification date. Look into why that is the case and if tar has any options to disable modification dates.
.\fq '.. | select(scalars and in_bytes_range(0x123))' test.tar
|00 01 02 03 04 05 06 07 08 09 0a 0b 0c 0d 0e 0f 10 11 12 13 14 15|0123456789abcdef012345|
0x108| 61 6c 65 78 00 00 00 00 00 00 00 00 00 00 00 00 00 00 00 00 00| alex.................|.files[0].uname: "alex"
0x11e|00 00 00 00 00 00 00 00 00 00 00
- fq does have a way to diff binary files, however it says that the tar file I'm using is broken (although it is ok.) I may have to use binwalk to find the offset, then use fq to figure out what is at that offset. fq/usage.md at master · wader/fq · GitHub
- Step 2: adjusting your focus on comparing a layer
-
Focusing too low means looking at unknown binaries that have a bunch of meaningless changes
-
Focusing too far means that there was a change, but it could be anything
-
Using the "file" command to identify what file it should be (or is)
-
Try decompiling a binary into IL code or source code, maybe instructions to reduce diff size and see what changed
-
For example, it could be a GUID or a line of code from a library that caused the entire binary to change
-
Instead of publishing a single file, try publishing a debug or release build that contains all of the libraries as separate files. This will help narrow down which file is different.
-
Filesystem metadata is (usually) the cause
-
Some files might be hiding (e.g., resource forks or invisible files) that are only visible when the file is compressed
-
If the entire file changed, and it isn't possible to go in it deeper, then try to run it multiple times and see if there is a pattern
-
Is the file digitally signed or encrypted? This would cause the entire file to change if even one byte changes.
-
For Docker, docker: extracting a layer from a image - Stack Overflow extract each layer and then do diffoscope on the tar files (assuming that tar files don't need to be composed first). The issue is that the layers themselves are diffs (so I'd need to diff the cumulative sum)
- Step 3: intra-layer comparison tips
-
If the files are identical, but only change when zipped, then the archiver is doing something to the files
-
Try compressing with just store and see if the issue persists (files might be re-ordered.) you can use the hex edit tool to view file contents and see if they are rearranged or if there are any patterns.
- Non-reproducible debugging steps (meta-non-reproducibility)
-
Filesystem ordering (inodes, etc.) can cause files to be ordered differently
-
Locale settings
-
Datetime settings
-
Last modified dates
-
Non-deterministic simulations (e.g., Monte carlo), use a fixed seed instead
-
Adaptive compression algorithms (e.g., zstd --adapt I think)
-
File system fragmentation (when compressing entire filesystem as a blob)
-
It's like a forensic metadata search in a way
-
Appending files to tar files may cause them to become silently overwritten when decompressing, making things weird
-
More ram (or less) can impact the compressor's dictionary size, which could change how files are compressed (better or worse)
-
Save as much system info for each container after each build
-
Middle ground: adding a deterministic flag?
-
Files that are renamed between builds (e.g., webpack dist bundles) might be very similar or the same. Make sure to compare them.
-
https://stackoverflow.com/a/64606251/220935 for deterministic Jest tests
-
strace -f -t -e trace=file ./node_modules/.pnpm/node_modules/.bin/jest --maxConcurrency=1 -w 1 2>&1 | grep -F '/dev/urandom' -B 5 run it on chunks of tests individually and see where randomness is introduced
-
strace while the debugger is active and then pause program execution when /dev/urandom is hit? hmmmm
-
Use jest.seed instead of Math.random for testing (so that it can be fixed through CI to a predetermined random value)
-
diffoscope: in-depth comparison of files, archives, and directories can show where, but the how is important as well
-
Additional troubleshooting tips:
- Use strace to determine which files are being used
strace -xx -yy -e read,openat -o output.log bash -c 'cd .. && ls'
- Extract the
openat(...)file paths from the log
grep -oP 'openat\([A-Z\_]+, "\K([\x0-9a-f]+)' strace_output.log
-
Also need command to programmatically parse read calls (output is in hex) so need to decode it
-
Code obfuscation and/or encryption can cause the artifacts to appear completely different each time. Make sure that the intermediate stages are reproducible before encryption. However, since the encryption layer can't in and of itself be verified, there is a level of trust required at that stage (e.g., The encryption process inserts untrusted code.) Deterministic obfuscation (e.g., a seed?)
-
"Code equivalence verifier" but still in research phase
-
Take hashes of all of those files that are being read and then if they are different then there is potentially issues with library versions
-
Does it use the network? Those files can change by themselves.
-
What creates the file? For example, a database might be created by a SQL script and then data is inserted. Could the data be inserted in a different order?
-
Record hashes of each artifact component individually (in addition to the entire artifact) so that if you lose the artifact, then you will be able to troubleshoot building its constituents if the entire artifact has to be re-built
-
Take a hash of all files at each step in the process, then run your build multiple times on multiple VMs or computers. You can then horizontally compare the hashes and find out which dependency or file changed, and then determine if that file is relevant to your build process. It will help reduce uncertainty when some of the inputs are different and which step is responsible.
-
Real-world examples and case studies
-
xdelta3?
-
GitHub - codilime/veles: Binary data analysis and visualization tool
-
This would be useful if you have no idea where the pattern exist in your file, or if there are certain patterns that exist at certain points in the file (e.g., the top)
-
Take hashes of the intermediate build outputs themselves (e.g., when a program is writing to a file, take the hash of what it is writing and then log the hash.) Then, you can compare the hashes between runs and the ordering of the logging to check if there are threading issues.
-
xdelta3 shows copied binary segments (e.g., files were concatenated non-deterministically)
alex@DESKTOP-7M8V9ET:/mnt/c/users/Alex Yorke/Desktop$ xdelta3 printdelta test1-3-2-4_to_3-4-1-2.delta
VCDIFF version: 0
VCDIFF header size: 41
VCDIFF header indicator: VCD_APPHEADER
VCDIFF secondary compressor: lzma
VCDIFF application header: test3-4-1-2.data//test1-3-2-4.data/
XDELTA filename (output): test3-4-1-2.data
XDELTA filename (source): test1-3-2-4.data
VCDIFF window number: 0
VCDIFF window indicator: VCD_SOURCE VCD_ADLER32
VCDIFF adler32 checksum: 18C50DDD
VCDIFF copy window length: 40000
VCDIFF copy window offset: 0
VCDIFF delta encoding length: 31
VCDIFF target window length: 40000
VCDIFF data section length: 0
VCDIFF inst section length: 12
VCDIFF addr section length: 8
Offset Code Type1 Size1 @Addr1 + Type2 Size2 @Addr2
000000 019 CPY_0 10000 S@10000
010000 035 CPY_1 10000 S@30000
020000 019 CPY_0 10000 S@0
030000 051 CPY_2 10000 S@20000
-
Windows-specific tips
-
Process Monitor
-
Tools > File Summary > By Folder, select your build folder, then start clicking on files to see which process modified them. Then, record names of all processes and filter events by those processes to see what libraries they are reading, registry keys, potentially other installed software, missing files, etc.
-
Clone the entire computer as a VHD and then do build there to see if it is reproducible (this is only if you're out of options or if the build is so complicated that it requires this level of isolation.) Also isolates potential issues with hardware if run on another machine.
-
Environment vars
-
PATH, LD_LIBRARY, etc
-
tar
-
--sort flag, -W, and
-
Different architectures and OSes
-
Difficult problem and doesn't have good solutions yet
-
If you cannot ssh into CI pipeline, then copy entire env to a VM and then do the build there (and check why it is failing), might be difficult with workspaces (but you could try calling binaries directly), at least narrows down the issue a bit more (plus more debugging tools because it's not a container)
-
For external dependencies, try to periodically archive the offline installer if one exists. If there isn't, or the installer downloads external deps, then do https://askubuntu.com/a/857845/23272 (mksqshfs) on the system after it has installed the deps, compress the filesystem and back it up. This will keep everything exactly as-is (you may also want to run a test script prior to the backup to make sure that the deps are all installed and working.)
-
tar depends on ordering, so files with new inodes (e.g., ones sponge'd over top of each other) will be archived in a different order (even though the archives are reported to be the same)
-
diffoscope output can be confusing if files are re-ordered
-
alex@DESKTOP-7M8V9ET:~$ diffoscope --force-details test.tar test2.tar
-
--- test.tar
-
+++ test2.tar
-
├── file list
-
│ @@ -1,2 +1,2 @@
-
│ --rw-r--r-- 0 alex (1000) alex (1000) 2537924 2023-01-11 05:24:43.000000 sample2.data
-
│ -rw-r--r-- 0 alex (1000) alex (1000) 2537924 2023-01-11 05:09:02.000000 sample.data
-
│ +-rw-r--r-- 0 alex (1000) alex (1000) 2537924 2023-01-11 05:24:43.000000 sample2.data
-
strace -D -t -f -y -e open,read,write -P /root/test/4019 tar -cf archive.tar test get call that modified file
<!-- -->
- RepTrace can do it on linux send (ohiolink.edu)
- What should I do if the software/dep that I use doesn't generate reproducible artifacts (and can't be fixed?)

 - Go back to your original goals for generating reproducible artifacts. For example, if it is for security, do you know for certain that the different artifacts could be infected with a virus? Build artifacts using a dedicated internet-isolated VM if concerned about viruses on a cloud provider, take a hash of the artifact, then download and compare. Use an artifact when building and that will become the trusted artifact to use.

 - If it is for going back in time and being able to rebuild the software, can the artifacts or build process be isolated with lots of documentation on how to build them? Store the artifacts really well with versions.

 - Consider isolating the artifact build procedure from the rest of the build, use hermetic from facebook if possible, contact the vendor for deterministic build support.

 - It is not possible to have a fully deterministic build if there are non-deterministic dependencies. Consider switching tool

- Misc tips

 - If you're still having issues, check build logs (and compare them) to see if there are errors or warnings for example

 1. Docker can't help you forever because it depends on CPU, memory, CPU type, kernel, etc. which are not fully isolated from the host. The host can change and mess up those timings.

 2. lsof for linux or sysinternals for windows to check which process was using a file

 3. Try building it on different versions of an OS. This can help produce more artifacts that could be easier to diff (or find similar changes)

### Challenges

- When one tries to prioritize build reproducibility, it's a bit abstract because something that is reproducible does not mean that it is fully reproducible 100% of the time. For example, a threading issue that only appears once every a million builds would be unlikely to appear, even if running the build multiple times. Therefore, you have to assess your risk tolerance and what you are hoping to get out of reproducible builds. To make your builds reproducible, it depends on the project. One KPI to use is to determine how many build artifacts (that you are publishing) are different in-between builds, and how much they are different. This provides a somewhat stochastic indicator on the progress of how to make the build more reproducible. This would be an approximate indicator because the low-hanging fruit to fix the reproducibility issues are likely to be easier, and could fix much of the changes in many of the files. The last bit might be more complex and could require build script changes. Some of the trade-offs are dedicating time and resources into making sure that the build continues to be reproducible. If you want a build that is reproducible from the developers' machines and CI, then they will likely have to have a local copy of CI to build on themselves (e.g., a docker container) and potentially the same OS. This could increase costs and complexity. It also depends on the level of reproducibility required. If the build artifacts change by an-appreciable amount (for example, the modification date is different each time and then this is reflected as a different file after the file is compressed), then one might have a certain sense of confidence that the application is reproducible.

- When we look at the tradeoffs for efficiency and flexibility, one may seek to reduce sources of non-determinism such as threading. This means that if two threads are working together (such as creating files), this means that the files could be created in a different order, thus, causing a chain reaction of issues down the line. A quick approach would be to reduce or eliminate threading to increase reproducibility, which would mean that an application would not receive the advantage of having multiple threads to do work in parallel. (Amdal's law.) It could also make it more difficult to change the build script, because one would have to test it multiple times on multiple different environments to make sure that the build was still reproducible. This would mean that the time to make changes would be slower and developers might be apprehensive that they might break the build's reproducibility.

- Some of the costs when implementing reproducible builds are the act of having to run the build multiple times (to make sure that it is reproducible.) This can cost time and resources. It may have to be run multiple times periodically to make sure that it is reproducible, and some scripts may have to be set up to make sure that the artifacts from multiple builds are the same. To mitigate these costs, make sure that you correctly assess how much risk you're willing to take, and ask your compiler maintainers to support reproducible builds which might help reduce some variability. If you do not need to be ultra confident that your build is reproducible, running it a few times could be useful to gain a somewhat good understanding that the build is reproducible and you don't need to run it hundreds of times.

- Version control is useful for helping with reproducibility because you can go back to a certain point in time and re-create those artifacts.

- The cost of reproducibility

 - Extra maintenance, cost, time, troubleshooting, tooling, version pinning, extra scripts, extra environment changes, docs, training

 - Useful if software is critical, needs to be audited, or has strict security requirements. Or, if you need to test a previous version of some software (rebuild it) to verify a behavior or potential security flaw

### Setting goals

- Set metrics, such as the amount of data diff between files that are different and then optimize from there. This might be highly variable, however. You may want to use another number that is more consistent (such as the number of files.)

 - Unreliable build -\> Inconsistent -\> Non-deterministic -\> repeatable -\> reproducible -\> deterministic -\> guaranteed build

 - For metrics, you want to quickly go through your entire program and turn it into stages. From there, you can verify if each stage has been fixed or doesn't appear to have any reproducibility problems. Some of the stages can be interlinked, so might be difficult to estimate work.

### Dockerfile reproducibility issues

**Commands from your list causing non-reproducibility:**

Based on the analysis, these commands from the provided list inherently break reproducibility because they fetch the latest versions of software/scripts, clone default branches, or use volatile base image tags:

**1. OS Package Management (Fetching Latest):**

- `RUN apt-get update && apt-get install -y ...` (and variants like `apt update`, `apt install -y`, `apt-get install -y -f curl`, `apt-get install -y nginx`)
- `RUN apt-get upgrade -y` (and variants like `dist-upgrade`)
- `RUN yum -y install httpd` (and variants like `yum install -y ...`, `yum groupinstall`, `yum update -y`)
- `RUN apk add --no-cache python3 \` (and variants like `apk add ...`, `apk -U add ...`, `apk update`, `apk upgrade`)
- `RUN dnf -y upgrade` (and variants like `dnf install -y ...`)
- `RUN apt-add-repository ... && apt-get update` (Adds external repos, often implies fetching latest)
- `RUN zypper ... install ...` / `RUN zypper ... update ...` (SUSE package manager)

**2. Fetching External Resources Without Pinning/Checksums:**

- `RUN curl -O https://bootstrap.pypa.io/get-pip.py \`
- `RUN wget -O - https://deb.nodesource.com/setup_6.x | bash` (and other NodeSource setup scripts)
- `RUN curl -sSfL https://raw.githubusercontent.com/golangci/golangci-lint/master/install.sh | sh -s -- -b /go/bin`
- `curl -o- https://raw.githubusercontent.com/creationix/nvm/v0.33.11/install.sh | bash`
- `ADD https://github.com/simple-evcorr/sec/releases/download/2.9.0/sec-2.9.0.tar.gz /app/sec.tar.gz` (`ADD` with URL)
- `RUN curl -sS http://getcomposer.org/installer | php`
- `RUN wget https://cmake.org/files/v3.18/cmake-3.18.2.tar.gz` (Relies on external host stability, though versioned)
- `RUN wget https://storage.googleapis.com/kubernetes-release/release/$(curl -s https://storage.googleapis.com/kubernetes-release/release/stable.txt)/bin/linux/amd64/kubectl` (Fetches `stable.txt` which changes)

**3. Language Package Management Without Lock Files/Pinning:**

- `RUN pip install --upgrade pip && pip install --no-cache-dir -r /requirements/prod.txt` (Upgrades pip, and relies on `requirements.txt` pinning)
- `run pip install django && pip install mysqlclient` (Installs latest)
- `RUN pip install -r /my_application/requirements.txt` (Depends on pinning in the file)
- `RUN npm install --production --silent` (Depends on `package-lock.json` / `yarn.lock` usage)
- `RUN npm i || :` (Same as above)
- `RUN composer install --prefer-dist --optimize-autoloader` (Depends on `composer.lock` usage)
- `RUN composer global require "hirak/prestissimo"` (Installs latest compatible)
- `RUN go get github.com/mitchellh/gox \` (Classic `go get` fetches latest)
- `RUN conda-env create environment.yml` (Depends on pinning in the file)

**4. Cloning Version Control Without Pinning:**

- `RUN git clone https://github.com/CJowo/pcr-guild-django.git` (Clones default branch)
- `RUN git clone https://github.com/algargon99/PROYECTO_IAW_GARCIA_GONZALEZ.git`
- `RUN git clone https://github.com/CORE-UPM/quiz_2019.git`
- `RUN git clone https://github.com/graphite-project/whisper.git /src/whisper`

**5. Using Volatile Base Image Tags:**

- `FROM ubuntu` (Implies `ubuntu:latest`)
- `FROM alpine` (Implies `alpine:latest`)
- `FROM node:latest` (and variants like `node:alpine`, `node:current-slim` if they receive updates)
- `FROM rabbitmq:latest`
- `FROM golang:latest`
- `FROM python:latest`
- `FROM image` (Implies `image:latest`)
- `FROM centos:latest`

**Are there any more?**

Yes, beyond those explicitly in your list, other patterns can cause non-reproducible builds:

1. **Time-Based Commands:** Any `RUN` command whose output depends on the _time_ of the build (e.g., `RUN date > /build_timestamp.txt`, `RUN echo "Built on $(date)" > /etc/motd`).
2. **Randomness:** Commands that generate random data during the build process (e.g., generating cryptographic keys directly in a `RUN` step without a fixed seed).
3. **Build Arguments (`ARG`):** If an `ARG` has a default value that relies on external factors, or if different `--build-arg` values are provided for different builds.
4. **Multi-Stage Builds:** If an earlier stage (`FROM base AS builder`) is non-reproducible, any subsequent stage using `COPY --from=builder` will also be non-reproducible.
5. **Network/DNS Fluctuation:** Very rarely, if a command depends on resolving a hostname and that hostname's IP address changes _and_ the command's behavior differs based on the specific IP contacted.
6. **Build Cache Issues (Advanced):** While BuildKit aims for correctness, complex caching scenarios or bugs could potentially lead to unexpected results, though this is less common than the other factors.
7. **Implicit Dependencies:** Commands that implicitly rely on the state of the host system's kernel or configuration _if_ that affects the build process within the container (less common with modern Docker).

To achieve reproducible builds, you should always aim to:

- Pin base image versions using specific tags or digests (`sha256:...`).
- Pin package versions explicitly in `apt-get install`, `yum install`, etc.
- Use lock files (`package-lock.json`, `composer.lock`, `Pipfile.lock`, `go.mod`/`go.sum`) for language dependencies.
- Verify checksums (`sha256sum`, etc.) after downloading files with `curl`/`wget`.
- Checkout specific commit hashes or tags when using `git clone`.

### Sources

- [On business adoption and use of reproducible builds for open and closed source software (springer.com)](https://link.springer.com/content/pdf/10.1007/s11219-022-09607-z.pdf) sources in introduction are very good

- How does portability fit in with reproducibility?

- [Towards Build Verifiability for Java-based Systems (arxiv.org)](https://arxiv.org/pdf/2202.05906.pdf) page 7 sources of non-determinism

- [framingsbom_20191112.pdf (ntia.gov)](https://ntia.gov/files/ntia/publications/framingsbom_20191112.pdf) general info on sboms

- [Identifying Bugs in Make and JVM-Oriented Builds (arxiv.org)](https://arxiv.org/pdf/2005.06881.pdf) convert BuildFS into pseudo-code that other people can use

- [truecrypt-acsac14.pdf (concordia.ca)](https://users.encs.concordia.ca/~mmannan/publications/truecrypt-acsac14.pdf) "explainable build process"

- [truecrypt-acsac14.pdf (concordia.ca)](https://users.encs.concordia.ca/~mmannan/publications/truecrypt-acsac14.pdf) section 3.3 useful

- [COFF - OSDev Wiki](https://wiki.osdev.org/COFF) to find out what is inside exe file headers,

- This sort of overlaps with testing (non-determinism) because non-deterministic tests make it difficult to debug whether the application is actually working.

- Differences between Idempotency, impure deterministic, and pure deterministic

- [eellak/build-recorder (github.com)](https://github.com/eellak/build-recorder)

- [GitHub - VIDA-NYU/reprozip: ReproZip is a tool that simplifies the process of creating reproducible experiments from command-line executions, a frequently-used common denominator in computational science.](https://github.com/VIDA-NYU/reprozip)

- [GitHub - polydawn/repeatr: Repeatr: Reproducible, hermetic Computation. Provision containers from Content-Addressable snapshots; run using familiar containers (e.g. runc); store outputs in Content-Addressable form too! JSON API; connect your own pipelines! (Or, use github.com/polydawn/stellar for pipelines!)](https://github.com/polydawn/repeatr)

- [GitHub - rerun/rerun: Core rerun. See also](https://github.com/rerun/rerun) [http://github.com/rerun-modules](http://github.com/rerun-modules) ??

- https://hal.science/hal-03196519/file/SW-2020-12-0293.R1_Zacchiroli.pdf

- 10.1145/3373376.3378519 DetTrace

- 10.1109/ISSREW51248.2020.00044

- [https://journals.plos.org/ploscompbiol/article/file?id=10.1371/journal.pcbi.1008316&type=printable](https://journals.plos.org/ploscompbiol/article/file?id=10.1371/journal.pcbi.1008316&type=printable)

- 10.1109/MS.2018.111095025

- [https://www.researchgate.net/profile/Duc-Ly-Vu/publication/359878507_Towards_Understanding_and_Securing_the_OSS_Supply_Chain/links/6254748ecf60536e2354f615/Towards-Understanding-and-Securing-the-OSS-Supply-Chain.pdf](https://www.researchgate.net/profile/Duc-Ly-Vu/publication/359878507_Towards_Understanding_and_Securing_the_OSS_Supply_Chain/links/6254748ecf60536e2354f615/Towards-Understanding-and-Securing-the-OSS-Supply-Chain.pdf)

- [https://www.digidow.eu/publications/2020-poell-bachelorthesis/Poell_2020_BachelorThesis_SOAP.pdf](https://www.digidow.eu/publications/2020-poell-bachelorthesis/Poell_2020_BachelorThesis_SOAP.pdf)

- [https://swc.rwth-aachen.de/docs/bachelor-master-theses/2022-004_BT_Strangfeld/2022-004%20BT%20Strangfeld%20-%20Thesis%20Report.pdf](https://swc.rwth-aachen.de/docs/bachelor-master-theses/2022-004_BT_Strangfeld/2022-004%20BT%20Strangfeld%20-%20Thesis%20Report.pdf) chapter 3

- [https://link.springer.com/content/pdf/10.1007/s10664-022-10117-6.pdf](https://link.springer.com/content/pdf/10.1007/s10664-022-10117-6.pdf) 7.4 mitigation measures

- [https://people.freebsd.org/\~emaste/AsiaBSDCon-2017-Reproducible-Builds-FreeBSD.pdf](https://people.freebsd.org/~emaste/AsiaBSDCon-2017-Reproducible-Builds-FreeBSD.pdf)

- 10.1145/3460319.3464797

- [https://link.springer.com/article/10.1007/s11219-022-09607-z](https://link.springer.com/article/10.1007/s11219-022-09607-z)

- [DIRENV-STDLIB 1 "2019" direnv "User Manuals" \| direnv](https://direnv.net/man/direnv-stdlib.1.html#codeuse-node-ltversiongtcode)

- [json-stable-stringify - npm (npmjs.com)](https://www.npmjs.com/package/json-stable-stringify)

---

## The Trust Gap in Software Builds

Free and open-source software promises transparency, but there is a gap between the source code and the binary that ships to users. Users must trust that the developer's build environment was uncompromised and that the resulting binary actually corresponds to the published source. Reproducible builds close this gap by making it possible for anyone to compile the same source and get a bit-for-bit identical output.

This talk ([31c3: Reproducible Builds — Closing the Trust Gap](https://1drv.ms/u/s!AOnf7tByrSaDlRE)) from Mike (Tor Project) and Seth (EFF) covers the core concepts:

- **Why developers are targets:** Build servers and developer machines are high-value attack surfaces. A compromised build server can inject malicious code into software used by millions, with no visible change to the source repository.
- **Reproducible builds as a mitigation:** If the same source always produces the same binary, independent parties can verify the build and detect tampering.
- **Real implementations:** Tor Browser uses the Gideon system; Debian achieves reproducibility across a significant portion of its package archive; F-Droid runs a verification server for Android packages.
- **The trusting trust problem:** Reproducible builds, combined with diverse double-compilation, help address the classic attack where a backdoor is injected into a compiler and propagates through all software it compiles.
- **Remaining challenges:** Build environment variations (timestamps, filesystem ordering, locale), ensuring update distribution integrity.

### Further Resources

- [The Unreproducible Package](https://github.com/bmwiedemann/theunreproduciblepackage/tree/master) — a curated collection of ways builds can fail to be reproducible, useful for testing your own toolchain.
- [GUAC](https://docs.guac.sh/) — Graph for Understanding Artifact Composition; enables automated analysis of software supply chain graphs.
- [FOSDEM 2024: Reproducible Builds — The First Ten Years](https://ftp2.osuosl.org/pub/fosdem/2024/k1105/fosdem-2024-3353-reproducible-builds-the-first-ten-years.mp4) — retrospective on progress across the ecosystem.
- [FOSDEM 2024: Sharing and Reusing SBOMs with the OSSelot Curation Database](https://ftp2.osuosl.org/pub/fosdem/2024/k4401/fosdem-2024-3074-sharing-and-reusing-sboms-with-the-osselot-curation-database.mp4)
- [FOSDEM 2024: Getting Lulled into a False Sense of Security by SBOM and VEX](https://ftp2.osuosl.org/pub/fosdem/2024/k4401/fosdem-2024-3230-getting-lulled-into-a-false-sense-of-security-by-sbom-and-vex.mp4) — important nuance on SBOM limitations.
- [FOSDEM 2024: Phantom Dependencies in Python](https://ftp2.osuosl.org/pub/fosdem/2024/k4401/fosdem-2024-3146-phantom-dependencies-in-python-and-what-to-do-about-them-.mp4)

## Generating an SBOM in GitHub Actions

A Software Bill of Materials (SBOM) is a machine-readable inventory of all components in your software. GitHub can generate one automatically for your repository, or you can produce one as part of your CI pipeline.

### Option 1: GitHub's built-in dependency graph export

GitHub automatically generates a dependency graph for supported ecosystems (npm, pip, Maven, Cargo, etc.). Export it as an SBOM in SPDX format:

```yaml
- name: Export GitHub SBOM
  run: |
    gh api /repos/${{ github.repository }}/dependency-graph/sbom > sbom.spdx.json
  env:
    GH_TOKEN: ${{ secrets.GITHUB_TOKEN }}

- name: Upload SBOM as artifact
  uses: actions/upload-artifact@v4
  with:
    name: sbom
    path: sbom.spdx.json
Option 2: Syft (for deeper analysis)
Syft generates SBOMs from container images, directories, or lock files and supports CycloneDX, SPDX, and other formats:
- name: Install Syft
  uses: anchore/sbom-action/download-syft@v0

- name: Generate SBOM with Syft
  uses: anchore/sbom-action@v0
  with:
    path: .
    format: spdx-json
    output-file: sbom.spdx.json

- name: Upload SBOM
  uses: actions/upload-artifact@v4
  with:
    name: sbom
    path: sbom.spdx.json
What to do with the SBOM
- Attach it to GitHub Releases so downstream users can audit what went into a release.
- Feed it into a vulnerability scanner (e.g., Grype, OSV Scanner) to find known CVEs in your dependency tree.
- Store it as a compliance artifact alongside your release artifacts.
CI/CD Security and Governance
CI/CD Security Key Points
Security
Key Points from Defending Continuous Integration/Continuous Delivery (CI/CD) Environments
Focus: Recommendations and best practices for securing CI/CD pipelines within DevSecOps environments, regardless of the specific tools used.
Context: CI/CD pipelines are increasingly targeted by malicious actors due to their role in rapidly building and deploying software. Compromise can lead to:
- Injection of malicious code
- Intellectual property theft
- Denial of service attacks
Threat Landscape:
- Insecure Code: Bugs in first or third-party code can create exploitable vulnerabilities.
- Poisoned Pipeline Execution: Injecting malicious code into the build process to compromise later stages.
- Insufficient Access Control: Unauthorized access enables code manipulation and other attacks.
- Insecure Configuration: Misconfigurations in infrastructure, network, or applications create vulnerabilities.
- Insecure Third-Party Services: Vulnerabilities in externally developed services can compromise the pipeline.
- Exposed Secrets: Compromise of keys, passwords, and other credentials grants access to sensitive resources.
Recommendations:
-
Authentication and Access Control:
-
Strong cryptography (CNSA Suite for NSS, NIST for others)
-
Minimize long-term credentials, utilize temporary and ephemeral credentials
-
Implement code signing and verification throughout the pipeline
-
Two-person rule for all code updates
-
Least privilege access control, separation of duties
-
Secure user accounts, regularly audit admin accounts
-
Secrets Management:
-
Never expose secrets in plaintext
-
Utilize dedicated secrets management solutions within CI/CD tools
-
Network Security:
-
Robust network segmentation and traffic filtering
-
Development Environment Hardening:
-
Keep software and operating systems updated
-
Update CI/CD tools regularly
-
Remove unnecessary applications
-
Implement endpoint detection and response (EDR) tools
-
Development Process Security:
-
Integrate security scanning early in the process (SAST, DAST, registry scanning)
-
Use only trusted libraries, tools, and artifacts
-
Analyze committed code for vulnerabilities
-
Remove temporary resources after use
-
Maintain detailed audit logs
-
Implement SBOM and SCA to track components and vulnerabilities
-
Resiliency:
-
Design for high availability and disaster recovery
-
Ensure scalability for emergency patch updates
Overall Approach:
- Zero trust approach, assuming no element is fully trusted.
- Leverage MITRE ATT&CK and D3FEND frameworks for threat modeling and mitigation strategies.
Outcomes:
- Reduce attack surface and exploitation vectors.
- Create a challenging environment for malicious actors.
- Improve cybersecurity posture for a wide range of organizations.
Call to Action:
Implement the recommended mitigations to secure CI/CD environments and strengthen overall software supply chain security.
CSI_DEFENDING_CI_CD_ENVIRONMENTS.PDF (defense.gov)
Implementing Security Measures in GitHub Actions Enterprise (Cloud-hosted)
Implementing Security Measures in GitHub Actions Enterprise (Cloud-hosted) -- Practical Guide
This guide provides detailed, practical steps for implementing the security recommendations using GitHub Actions Enterprise.
Authentication and access control
-
Strong cryptography: GitHub Actions (and GitHub Enterprise Cloud) uses industry-standard cryptography for transport and storage. Your main job is to keep your org/repo/runners and dependencies up to date.
-
Minimize long-term credentials:
- Use GitHub’s secrets store for cases where you must use long-lived credentials.
- Prefer short-lived credentials via OpenID Connect (OIDC) for cloud deployments.
Store secrets in GitHub and use them in workflows
Go to your repository Settings → Secrets and variables → Actions, then create a new secret (for example DOCKER_HUB_TOKEN).
jobs:
  my_job:
    runs-on: ubuntu-latest
    steps:
      - name: Login to Docker Hub
        run: docker login -u ${{ secrets.DOCKER_HUB_TOKEN }}
Use temporary OpenID Connect (OIDC) tokens
Enable id-token: write permissions and use a cloud provider role trust.
permissions:
  id-token: write
  contents: read
AWS (example)
- Create an IAM role trusted for GitHub OIDC.
- Grant only the permissions needed (least privilege).
- Configure credentials in your workflow using the role ARN:
jobs:
  deploy:
    runs-on: ubuntu-latest
    environment: production
    steps:
      - uses: aws-actions/configure-aws-credentials@v1
        with:
          role-to-assume: arn:aws:iam::123456789012:role/GitHubActionsDeployRole
          role-session-name: GitHubActionsSession
      - name: Deploy to S3
        run: aws s3 cp my-app.zip s3://my-bucket/
Code signing and verification
If you sign build artifacts, verify signatures before deployment.
jobs:
  build:
    runs-on: ubuntu-latest
    steps:
      - uses: actions/checkout@v3
      - name: Build and sign the artifact
        run: |
          make build
          cosign sign my-app.zip
jobs:
  deploy:
    runs-on: ubuntu-latest
    steps:
      - uses: actions/download-artifact@v3
        with:
          name: my-app
      - name: Verify the signature
        run: cosign verify my-app.zip
      - name: Deploy the artifact
        run: |
          # Deploy your application...
Two-person rule and branch protection
In repository settings, add branch protection rules for your main/release branches:
- Require pull requests.
- Require 2 (or more) approving reviews.
- Consider dismissing stale approvals on new commits.
- Consider requiring linear history and preventing force pushes.
Environment protection
Use GitHub Environments (for example staging, production) with required reviewers and branch restrictions to gate deployments.
Audit logging
Use the organization audit log to monitor:
- Logins and token use
- Secret access changes
- Repository permission changes
- Workflow/run configuration changes
Secret Management
Secret management
This guide provides strategies for storing, accessing, and managing secrets within your GitHub Actions workflows.
Storing secrets in GitHub
- Navigate to your repository Settings → Secrets and variables → Actions.
- Click New repository secret.
- Provide a name and value for your secret (for example
DOCKER_USERNAME). - Click Add secret.
Accessing secrets in workflows
Use the ${{ secrets.SECRET_NAME }} syntax in workflow files.
Challenges of GitHub-stored secrets
- Local testing: relying directly on GitHub secrets can make local testing harder. Prefer parameterizing scripts so you can swap in local environment variables.
- Key rotation: GitHub secrets don’t have expiration dates; rotate tokens/keys intentionally.
Strategies for improved secret management
- Parameterization: pass secrets via environment variables or arguments to scripts so the same scripts run locally and in CI.
- External secrets managers (example: Azure Key Vault):
- Fetch secrets on demand using workload identity / service principals.
- Prefer short-lived tokens; centralize auditing.
- Minimize secret scope: expose secrets only to steps that need them.
- Least privilege: keep tokens scoped to the minimum permissions needed.
Examples
- name: Deploy
  run: surge ./build myproject.surge.sh --token ${{ secrets.SURGE_TOKEN }}
- name: Publish package
  run: twine upload dist/*
  env:
    TWINE_USERNAME: __token__
    TWINE_PASSWORD: ${{ secrets.PYPI_API_TOKEN }}
- name: Create GitHub release
  uses: actions/create-release@v1
  env:
    GITHUB_TOKEN: ${{ secrets.GITHUB_TOKEN }}
- run: echo "AWS_BUCKET=mybucket" >> $GITHUB_ENV
- name: Login to DockerHub
  run: echo ${{ secrets.DOCKER_PASSWORD }} | docker login -u ${{ secrets.DOCKER_USERNAME }} --password-stdin
- name: Upload coverage to Codecov
  uses: codecov/codecov-action@v1
  with:
    token: ${{ secrets.CODECOV_TOKEN }}
Security and Docker Workflow Notes
Security
Gradle Wrapper Validation, Docker workflow security scanning, multi-arch builds, Docker Hub interactions, tagging logic, and useful patterns that can be adapted to other workflows.
Gradle Wrapper Validation helps ensure the Gradle wrapper files (gradlew, gradlew.bat, gradle-wrapper.jar) haven’t been tampered with. It validates checksums/signatures early in CI so compromised wrapper code doesn’t run.
Example step:
- name: Validate the Gradle wrapper
  uses: gradle/wrapper-validation-action@v1
Useful workflow patterns from complex Docker pipelines:
- Path filtering: run jobs only when relevant Dockerfiles change (useful for monorepos).
- Multi-architecture builds: Buildx + QEMU for
amd64,arm64, etc. - Vulnerability scanning: scan built images and upload results (SARIF) to code scanning.
- Automated registry publishing: authenticate with secrets/OIDC, push images, update descriptions.
- Cleanup: remove credentials after pushes.
- Tagging logic: consistent tags based on branches, tags, and commit SHAs for traceability.
Security and Governance Tips
Don't use curl | bash; code owners and branch protection; artifact retention windows; diagnostic logging; 2FA; least privilege; links to analyzers and SSDF.
-
Don’t use
curl | bash. You’re executing remote code that can change, redirect, or be selectively served. -
Use CODEOWNERS and branch protection:
-
Set artifact retention intentionally:
- Release artifacts: ~30–90 days (or per compliance needs)
- PR/dev artifacts: ~3–7 days
-
Turn on diagnostic logging for key infrastructure (for example cloud storage accounts).
-
Require 2FA for everything.
-
Enforce least privilege:
-
Reproducible builds: See the Reproducible Builds and SBOMs chapter and the Security and Reproducibility chapter for in-depth coverage.
-
Anti-malware scanning for build artifacts:
Preventing PR Code from Overriding CI Scripts
In large open-source projects that accept external pull requests, a malicious or erroneous PR could modify the CI scripts that run during the build. If CI runs the PR's version of those scripts, it may execute untrusted code with access to secrets and the runner environment.
The Apache Airflow project addresses this with a two-checkout pattern:
- Check out trusted main scripts into a separate directory:
- name: "Checkout main branch to 'main-airflow' to use trusted scripts"
  uses: actions/checkout@v3
  with:
    path: "main-airflow"
- Overwrite the CI script directory with the main-branch version before running anything:
- name: "Override scripts/ci with the main branch version"
  run: |
    rm -rf "scripts/ci"
    mv "main-airflow/scripts/ci" "scripts"
This ensures that no matter what a PR changes inside scripts/ci, those changes are discarded before execution. Apply this pattern to any directory that contains scripts invoked by the CI pipeline but should remain under maintainer control.
- Useful analyzers / scanners:
Chapter X: Debugging GitHub Actions Workflows
Automated workflows are the heart of Continuous Integration and Continuous Deployment (CI/CD). They build, test, and deploy our code, saving us countless hours. However, like any code, these workflows can fail. When a GitHub Actions workflow turns red, knowing how to efficiently diagnose and fix the problem is a critical skill. Debugging CI/CD pipelines presents unique challenges: the environment is remote, often ephemeral, and interacting with it directly can be difficult.
This chapter equips you with the strategies, tools, and techniques necessary to effectively debug your GitHub Actions workflows. We'll cover everything from reading logs and linting your workflow files to advanced techniques like local execution and handling tricky shell script issues. By the end, you'll be better prepared to tackle those inevitable workflow failures and keep your CI/CD pipelines running smoothly.
Common Challenges in GitHub Actions Workflows
Before diving into solutions, let's acknowledge the common hurdles developers face when workflows fail. Understanding these typical problem areas can help you narrow down your search when debugging:
- Configuration & Syntax Errors: YAML, the language used for GitHub Actions workflows, is strict about indentation and syntax. Simple typos, incorrect action inputs, invalid paths, or misplaced colons can easily break a workflow.
- Dependency & Versioning Issues: Workflows often rely on external actions, tools, or packages. Using outdated versions, facing conflicts between dependencies, or incorrectly specifying versions can lead to failures. This includes issues with package managers like npm, pip, Maven, etc.
- Environment & Runner Problems: Workflows run on virtual machines called runners (e.g.,
ubuntu-latest,windows-latest). Issues can arise from assuming tools or path structures specific to one OS when running on another, hitting resource limits (memory, disk space), or encountering temporary runner service problems. - Scripting Errors: Many workflows execute custom shell scripts (Bash, PowerShell). Errors within these scripts, such as syntax mistakes, incorrect commands, permission issues, or unexpected behavior due to environment differences, are frequent culprits.
- Authentication & Permissions: Workflows often need to interact with protected resources (e.g., cloning private repositories, pushing to container registries, deploying to cloud providers). Incorrectly configured secrets or tokens (
GITHUB_TOKEN, personal access tokens, cloud credentials) lead to permission denied errors. - Workflow Triggers & Conditions: Sometimes the workflow doesn't run when expected, or runs unexpectedly. This can be due to incorrect event triggers (
on: [push],on: [pull_request]) or faulty conditional logic (if: ...) controlling job or step execution. - Network & External Service Issues: Workflows might fail if they can't reach external services (package repositories, APIs, deployment targets) due to network timeouts, DNS problems, or outages in those services.
Recognizing these patterns is the first step towards efficient troubleshooting.
Essential Tools & Resources
Several tools can help you prevent and diagnose issues before and during workflow execution:
- GitHub Actions Extension for VS Code:
- Purpose: Provides invaluable assistance directly within your editor when writing workflow
.yamlfiles. - Features: Offers syntax highlighting, intelligent code completion for action inputs/outputs, and real-time validation, catching many common syntax errors as you type.
- Link: Search for "GitHub Actions" in the VS Code Extensions marketplace.
actionlint:
- Purpose: A static checker specifically designed for GitHub Actions workflow files. It goes beyond basic YAML validation.
- Features: Detects errors related to workflow syntax, action references, expression syntax within
${{...}}, runner labels, and more. It can be run locally or integrated into pre-commit hooks or CI itself. - Link: https://github.com/rhysd/actionlint
shellcheck:
- Purpose: A powerful static analysis tool for shell scripts (primarily Bash, sh, dash). It identifies common pitfalls, syntax errors, and potentially dangerous constructs in your scripts.
- Features: Catches quoting issues, command misuse, logic errors, and provides clear explanations and suggestions for fixes. Essential if your workflows involve non-trivial shell scripting.
- Link: https://www.shellcheck.net/ or installable via package managers (
apt,brew, etc.).
- YAML Linters:
- Purpose: Validate the basic syntax and formatting of your YAML files.
- Tools:
- Online Validators: Quick checks (e.g., https://www.yamllint.com/).
prettier: While primarily a code formatter, it can enforce consistent YAML formatting, reducing syntax errors caused by inconsistent indentation or spacing.- Dedicated YAML linters often available via package managers.
- Essential Reading:
- Debugging GitHub Actions workflows effectively: (Blog Post) https://harshcasper.com/debugging-github-actions-workflows-effectively/ - Offers practical tips and perspectives.
- Enabling debug logging: (Official Docs) https://docs.github.com/en/actions/monitoring-and-troubleshooting-workflows/enabling-debug-logging - A fundamental debugging technique covered later.
- BashGuide: (Wiki) https://mywiki.wooledge.org/BashGuide - A comprehensive resource for understanding Bash scripting better, crucial for debugging shell script steps.
Using these tools proactively during development can significantly reduce the number of errors that make it into your main branch and CI system.
Core Debugging Techniques
When a workflow fails, start with these fundamental techniques:
1. Reading the Workflow Logs
This is always the first step. GitHub Actions provides detailed logs for each workflow run.
- Accessing Logs: Go to the "Actions" tab in your repository, find the failed run, and click on the job that failed. You'll see a breakdown of each step. Expand the failing step to see its output.
- Identifying Errors: Look for explicit error messages (often prefixed with
Error:or containing keywords likefailed,exception,exit code). Pay attention to the lines immediately preceding the error, as they often provide context. - Annotations: GitHub often automatically highlights errors or warnings directly in the code view within the log interface, making them easier to spot.
2. Enabling Verbose Debug Logging
Sometimes the standard logs aren't detailed enough. GitHub Actions provides two ways to enable more verbose logging:
- Runner Debug Logging: Provides additional logs about the runner's activities, such as setting up the environment, downloading actions, and cleaning up.
- How to Enable: Re-run the failed job. Before clicking the "Re-run jobs" button, check the "Enable debug logging" checkbox.
- Step Debug Logging: Provides highly detailed, often verbose, logs generated by the actions themselves and the runner's interaction with them. This often includes internal variable states, API calls, and command execution details.
- How to Enable: Set the secret
ACTIONS_STEP_DEBUGtotruein your repository or organization settings (Settings -> Secrets and variables -> Actions -> New repository secret). Important: This logs potentially sensitive information, so use it temporarily for debugging and remove or set it tofalseafterward.
Debug logging can generate a lot of output, but it often contains the exact clue needed to solve the problem. Search the debug logs for error messages or relevant keywords.
3. Local Static Analysis (Linting)
Catch errors before running the workflow:
- Lint Workflow Files: Use
actionlintor the VS Code extension to validate your.github/workflows/*.yamlfiles. This catches syntax errors, incorrect action references, and malformed expressions.
# Example using actionlint
actionlint .github/workflows/ci.yaml
- Check Shell Script Syntax: For any non-trivial shell scripts (
.sh) used inrunsteps, usebash -nto perform a syntax check without executing the script. This catches basic errors like typos or missing brackets.
```bash
 bash -n path/to/your_script.sh
_Note:_ `bash -n` only checks syntax. A script can have perfect syntax but still fail due to logic errors or incorrect commands.
- **Lint Shell Scripts:** Use `shellcheck` for deeper analysis of your shell scripts. It finds a much wider range of potential problems than `bash -n`.
```bash
shellcheck path/to/your_script.sh
Integrating these linters into your local development workflow (e.g., via Git pre-commit hooks) is highly recommended.
4. Handling YAML Formatting and Invisible Characters
YAML is sensitive to whitespace and invisible characters can wreak havoc.
- Consistent Formatting: Use
prettieror a similar tool configured for YAML to ensure consistent indentation and spacing. - Invisible Characters: Tabs mixed with spaces, or non-standard whitespace characters (sometimes copied from web pages or documents) can cause cryptic parsing errors. Use a text editor with a "show invisibles" or "show whitespace characters" option to identify and remove them. Ensure your files are saved with standard UTF-8 encoding.
5. Debugging "Exit Code Non-Zero" Errors
One of the most common reasons a workflow step fails is because a command within that step exited with a non-zero status code. In Unix-like systems (including Linux and macOS runners), a zero exit code traditionally signifies success, while any non-zero code indicates an error.
When you encounter this:
- Check the Logs: As always, the workflow logs are your primary source. Scroll up from the "Process completed with exit code X" message. The lines immediately preceding it usually contain the specific error message generated by the failing command (e.g., "file not found," "permission denied," "command not found," "test suite failed").
- Enable Debug Logging: If the standard logs aren't clear, enable Runner and Step Debug Logging (
ACTIONS_STEP_DEBUG: truesecret) as described earlier. This often reveals the exact command that failed and any underlying issues (like incorrect variable values being passed). - Understand the Failing Command: Identify the specific command that produced the non-zero exit code. Is it a standard tool (
npm,pip,docker,pytest), or a custom script? Consult the documentation for that command or script to understand what different exit codes might mean. - Echo Important Variables: If you suspect a command is failing because of incorrect input (like a file path, API key, or configuration value), temporarily add
echostatements in yourrunstep before the failing command to print the values of relevant variables.
- name: Deploy Application
run: |
```bash
     echo "Deploying to server: ${{ secrets.DEPLOY_SERVER }}"
     echo "Using source directory: ${{ env.SOURCE_DIR }}"
The potentially failing command
scp -r ${{ env.SOURCE_DIR }}/* user@${{ secrets.DEPLOY_SERVER }}:/var/www/html
Add more echo statements as needed
- **Use `set -e` in Scripts:** When writing multi-line shell scripts in a `run` step, include `set -e` at the beginning. This option causes the script to exit immediately if any command fails (returns a non-zero exit code). Without it, the script might continue running after an error, potentially masking the original problem or causing cascading failures. It helps pinpoint the _first_ command that failed.
```yaml
- name: Build and Test
run: |
set -e # Exit immediately if a command fails
```bash
     echo "Running build..."
     npm run build
     echo "Running tests..."
     npm test
     echo "Build and Test successful!"
_(See the section on "Advanced Bash Script Debugging" for more `set` options like `-o pipefail`)_.
- **Local Replication:** If the error is specific to a complex command or script interaction, try to replicate the environment and run the command locally (covered next).

**6. Advanced Bash Script Debugging**

Many workflows rely on shell scripts (`bash`, `sh`) within `run` steps. Debugging these requires specific techniques beyond basic syntax checking:

- **Trace Execution (`set -x`):** Add `set -x` at the beginning of your script block (or run the script file using `bash -x your_script.sh`). This tells Bash to print each command to standard error _before_ it is executed, after variable expansion and other substitutions. This is invaluable for seeing exactly what commands are being run and with what arguments.
```yaml
- name: Complex Script Step
run: |
set -x # Print each command before execution
export TARGET_DIR="/data/${{ github.run_id }}"
```bash
     mkdir -p $TARGET_DIR
if [ -f "source/config.txt" ]; then
cp source/config.txt $TARGET_DIR/
fi
echo "Setup complete in $TARGET_DIR"
- **Strict Error Handling (`set -eou pipefail`):** This is a highly recommended combination for safer scripts:
- `set -e`: Exit immediately if a command exits with a non-zero status.
- `set -o pipefail`: Causes a pipeline (e.g., `command1 | command2`) to return a failure status if _any_ command in the pipeline fails, not just the last one.
- `set -u`: Treats unset variables and parameters (other than special parameters like `@` or `*`) as an error when performing substitution. This helps catch typos in variable names.
```yaml
- name: Safer Script Execution
shell: bash # Ensure bash is used
run: |
set -eoux pipefail # Enable all safety options + tracing
# Your script commands here...
- Use
trapfor Cleanup: If your script creates temporary files or needs to perform cleanup actions even if it fails, use thetrapcommand.trap 'command' EXITexecutescommandwhen the script exits, regardless of whether it was successful or failed.
- name: Script with Cleanup
run: |
set -e
TEMP_FILE=$(mktemp)
trap 'echo "Cleaning up $TEMP_FILE"; rm -f "$TEMP_FILE"' EXIT # Register cleanup

```bash
     echo "Writing data to temp file..."
     echo "Hello World" > "$TEMP_FILE"
Simulate a failure
      echo "Intentionally failing..."
      ls /non/existent/path
echo "This line will not be reached"
- **Redirect Long Logs:** If a script generates a lot of output, making it hard to read in the workflow logs, redirect its output to a file. You can then use the `actions/upload-artifact` action to save this log file for later inspection.
```yaml
- name: Run Verbose Process
run: |
./my_complex_script.sh > script_output.log 2>&1
# The 2>&1 redirects standard error to standard output, capturing both in the file
- name: Upload Script Log
uses: actions/upload-artifact@v3
with:
name: script-log
path: script_output.log
- Validate User Input (if applicable): If your script interacts with user input (less common in CI but possible), always validate it to prevent errors or security issues.
# Example within a script
read -p "Enter commit message: " message
if [ -z "$message" ]; then
```bash
   echo "Error: Commit message cannot be empty." >&2 # Print to stderr
exit 1 fi
- **Use `shellcheck`:** Regularly run `shellcheck` on your scripts. It catches a vast array of common errors and bad practices that `bash -n` misses.

**7. Local Execution and Replication**

Sometimes, the quickest way to debug is to run the problematic steps or the entire workflow on your local machine or a similar environment you control.

- **Limitations:** You cannot _perfectly_ replicate the GitHub Actions runner environment locally without significant effort. Runners have specific pre-installed software, environment variables (`GITHUB_TOKEN`, context variables like `github.sha`), and network configurations. Direct local execution of the entire workflow `.yaml` file is not natively supported by GitHub.
- **Strategies:**
- **Run Individual Commands/Scripts:** Identify the failing command or script in your workflow step. Copy it and try running it directly in your local terminal (or within a Docker container based on a similar OS image like `ubuntu:latest`). You might need to manually set environment variables or create dummy files that the script expects.
- **Use Docker:** If your workflow heavily relies on a specific environment, define it in a `Dockerfile` that mimics the runner environment (installing necessary tools like Node.js, Python, Docker CLI, etc.). You can then run your build or test commands inside a container built from this Dockerfile. This provides better isolation and consistency.
- **Tools like `act`:** Third-party tools like `act` ([https://github.com/nektos/act](https://github.com/nektos/act)) attempt to run your GitHub Actions workflows locally using Docker. They parse your workflow files and execute the steps in containers.
- **Caveats:** `act` is useful but not a perfect replica. It might not support all features, actions (especially complex ones or those interacting heavily with the GitHub API), or environment nuances. Use it as a debugging aid, but always validate fixes in the actual GitHub Actions environment.
- **SSH Access to Runners (Self-Hosted or Debug Action):**
- **Self-Hosted Runners:** If you are using self-hosted runners (running the runner agent on your own hardware or cloud VMs), you can directly SSH into the runner machine while the job is running for live debugging.
- **Debug Actions:** Actions like `mxschmitt/action-tmate` can be temporarily added to your workflow. When triggered, they pause the workflow and provide an SSH connection string that allows you to connect directly into the _actual_ GitHub-hosted runner environment for that specific job run. This is powerful for complex issues but should be used cautiously, especially with sensitive code or secrets.

Local replication helps isolate whether the problem is in your code/script logic itself or specific to the GitHub Actions environment.

Okay, let's add the practical, buggy examples to help solidify the debugging concepts, followed by a summary of common pitfalls.

---

### **Debugging by Example: Common Workflow Pitfalls**

Let's look at some common scenarios where workflows might fail, along with how to identify and fix the bugs. These examples intentionally contain errors you might encounter in real-world situations.

**Example 1: Incorrect Runner Version and Missing Dependencies**

- **Scenario:** A Python project needs to install dependencies and run tests using `pytest`. The initial workflow uses an older runner version and assumes tools are present.

- **Buggy Workflow:**

```yaml
# .github/workflows/ci.yaml
name: CI

on: [push]

jobs:
build:
# Problem 1: Using an old, potentially unsupported, runner version
runs-on: ubuntu-18.04
steps:
- uses: actions/checkout@v3 # Use a more recent checkout version

- name: Set up Python 3.9 # Specify desired version
uses: actions/setup-python@v4
with:
python-version: "3.9"

- name: Install dependencies
# Problem 2: Assumes 'pip' is up-to-date and 'requirements.txt' exists
# Problem 3: Doesn't explicitly install pytest if not in requirements
run: pip install -r requirements.txt

- name: Run tests
# Problem 4: Fails if pytest wasn't installed
run: pytest
- Identifying the Bugs:
- Runner Version: The logs might show warnings about
ubuntu-18.04being deprecated or unavailable, or builds might fail due to incompatible pre-installed software. - Dependency Installation: The "Install dependencies" step might fail if
requirements.txtis missing or ifpipitself needs an upgrade to handle newer package features. - Missing Test Runner: The "Run tests" step will fail with a "command not found: pytest" error if
pytestwasn't listed inrequirements.txtand wasn't installed separately.
-
Solution:
-
Update the runner to a maintained version (e.g.,
ubuntu-latestor a specific supported version likeubuntu-22.04). -
Add a step to upgrade
pipbefore installing requirements. -
Ensure
requirements.txtexists and includes all necessary packages, includingpytest. Alternatively, installpytestexplicitly. -
Corrected Workflow:
# .github/workflows/ci.yaml
name: CI

on: [push]

jobs:
build:
# Solution 1: Use a current, supported runner
runs-on: ubuntu-latest # Or ubuntu-22.04
steps:
- uses: actions/checkout@v3

- name: Set up Python 3.9
uses: actions/setup-python@v4
with:
python-version: "3.9"

- name: Upgrade pip
# Solution 2: Ensure pip is up-to-date
run: python -m pip install --upgrade pip

- name: Install dependencies
# Assumes requirements.txt exists and lists pytest
run: pip install -r requirements.txt
# OR, if pytest is only for testing:
# run: |
# pip install -r requirements.txt
# pip install pytest # Install pytest explicitly

- name: Run tests
run: pytest
Example 2: OS-Specific Path Issues
-
Scenario: A Node.js project uses npm scripts for building, but one script relies on Unix-style paths. The workflow is initially set to run on Windows.
-
Buggy Workflow:
# .github/workflows/build.yaml
name: Node.js CI

on: push

jobs:
build:
# Problem: Running on Windows, but build script might use Unix paths (e.g., './scripts/build.sh')
runs-on: windows-latest
steps:
- uses: actions/checkout@v3

- name: Setup Node.js
uses: actions/setup-node@v3
with:
node-version: "18" # Use a current LTS version

- name: Install dependencies
run: npm ci # Use 'ci' for faster, reliable installs in CI

- name: Build
# Problem: npm run build might execute a script assuming Linux/macOS paths or tools
run: npm run build
env:
CI: true
-
Identifying the Bug: The "Build" step fails. Log inspection reveals errors originating from the
npm run buildcommand, potentially showing "command not found" for Unix commands (likecp,rm,sh) or path errors likeCannot find path 'C:\path\to\unix\style\path'. -
Solution:
- Change Runner OS: If the build process inherently requires a Unix-like environment, change
runs-ontoubuntu-latest. - Make Scripts Platform-Independent: Modify the build scripts (in
package.jsonor separate script files) to use Node.js APIs (likefs,path) or cross-platform tools (likerimraffor deletion,cross-envfor setting environment variables) that work on both Windows and Unix.
- Corrected Workflow (Option 1 - Change OS):
# .github/workflows/build.yaml
name: Node.js CI

on: push

jobs:
build:
# Solution: Run on a Linux environment
runs-on: ubuntu-latest
steps:
- uses: actions/checkout@v3
- name: Setup Node.js
uses: actions/setup-node@v3
with:
node-version: "18"
- name: Install dependencies
run: npm ci
- name: Build
run: npm run build
env:
CI: true
Example 3: Incorrect Environment Variables or Secrets
-
Scenario: A workflow attempts to log in to Docker Hub and push an image, but uses an incorrect secret name or Docker image tag format.
-
Buggy Workflow:
# .github/workflows/deploy.yaml
name: Docker Build and Push

on:
push:
branches: [main] # Only run on pushes to main

jobs:
deploy:
runs-on: ubuntu-latest
steps:
- uses: actions/checkout@v3

- name: Set up Docker Buildx
uses: docker/setup-buildx-action@v2

- name: Log in to Docker Hub
uses: docker/login-action@v2
with:
username: ${{ secrets.DOCKER_USERNAME }}
# Problem 1: Potential typo in secret name (e.g., DOCKER_PASSWORD vs DOCKER_PAT)
password: ${{ secrets.DOCKER_PASSWORD }}

- name: Build and Push Docker Image
run: |
# Problem 2: Image tag might be missing org name or use wrong variable
docker build -t my-app:${{ github.sha }} .
```bash
           docker push my-app:${{ github.sha }}
- **Identifying the Bugs:**

1. **Login Failure:** The "Log in to Docker Hub" step fails, often with an authentication error. Check that the secrets `DOCKER_USERNAME` and `DOCKER_PASSWORD` (or `DOCKER_PAT` if using a Personal Access Token) exist in the repository/organization settings (Settings -> Secrets and variables -> Actions) and are spelled correctly in the workflow. Also verify the credentials themselves are valid.
2. **Push Failure:** The "Build and Push" step might succeed in building but fail during the `docker push`. The error message might indicate "repository not found" or "permission denied." This often happens if the image tag doesn't include the Docker Hub username/organization prefix (e.g., `myorg/my-app` instead of just `my-app`).

- **Solution:**

- Verify secret names and values.
- Correct the Docker image tag format to include the necessary prefix (usually your Docker Hub username or organization name). Use standard actions like `docker/build-push-action` for robustness.

- **Corrected Workflow (using recommended Docker actions):**

```yaml
# .github/workflows/deploy.yaml
name: Docker Build and Push

on:
push:
branches: [main]

jobs:
deploy:
runs-on: ubuntu-latest
steps:
- uses: actions/checkout@v3

- name: Set up Docker Buildx
uses: docker/setup-buildx-action@v2

- name: Log in to Docker Hub
uses: docker/login-action@v2
with:
username: ${{ secrets.DOCKER_USERNAME }} # Solution 1: Verified secret name
password: ${{ secrets.DOCKER_HUB_TOKEN }} # Example: Using a PAT stored in this secret

- name: Build and push Docker image
uses: docker/build-push-action@v4
with:
context: .
push: true
# Solution 2: Correct tag format (replace 'your-dockerhub-username')
tags: your-dockerhub-username/my-app:${{ github.sha }}, your-dockerhub-username/my-app:latest
These examples illustrate how applying the debugging techniques (checking logs, verifying configuration, understanding the environment) helps resolve common workflow failures.
Summary: Frequently Encountered Issues Recap
Based on common experiences and the issues highlighted in the notes, here's a condensed recap of frequent problem areas:
- Configuration & Syntax:
- Incorrect YAML syntax (indentation, colons, quotes).
- Invalid paths to files or directories.
- Typos in action names, inputs, variable names, or secret names.
- Misconfigured workflow triggers (
on: ...) or conditions (if: ...).
- Dependencies & Versioning:
- Missing steps to install necessary tools or dependencies (e.g., Node.js, Python,
aptpackages). - Using incorrect or incompatible versions of tools, packages, or base Docker images.
- Not pinning dependencies (leading to unexpected failures when dependencies update).
- Issues with package manager commands or lock files.
- Environment & OS:
- Scripts failing due to OS differences (paths, available commands, line endings).
- Using deprecated or unsupported runner OS versions (
runs-on:). - Hitting runner resource limits (disk space, memory, CPU).
- Authentication & Permissions:
- Incorrect or missing secrets/tokens (
GITHUB_TOKENpermissions, PATs, cloud credentials). - Insufficient permissions granted to the
GITHUB_TOKENfor the required operations.
- Shell Scripting:
- Syntax errors (
bash -n). - Logic errors or unexpected behavior (
set -x,shellcheck). - Problems with line endings (CRLF vs LF).
- Unsafe handling of variables or errors (lack of
set -eou pipefail). - Invisible UTF-8 characters causing parsing errors.
Being aware of these common failure points helps you form hypotheses more quickly when a workflow fails. "Is it a typo in the secret name? Is the script failing because it's running on Windows? Did I forget to install that build tool?"
Best Practices and Proactive Measures
Debugging is essential, but preventing issues in the first place saves time and frustration. Adopting best practices can significantly improve the reliability and efficiency of your GitHub Actions workflows.
1. Workflow Design and Maintenance:
- Lint Your Workflows: Regularly use tools like
actionlintand YAML linters to catch syntax and structural errors in your.github/workflows/*.yamlfiles before committing them. Integrate this into pre-commit hooks. - Stay Updated: Periodically review and update the versions of actions (
uses: actions/checkout@vX), tools (setup-node,setup-python), and base Docker images used in your workflows. Use tools like Dependabot to help automate proposte updates for actions. - Use Specific Versions: Avoid using floating tags like
@latestfor actions or:latestfor Docker images in critical workflows. Pin to specific versions (e.g.,@v3,:ubuntu-22.04) for reproducibility. While@maincan be useful for rapidly evolving internal actions, use specific SHA commits or tags for external ones. - Keep Workflows Focused: Aim for jobs that perform a specific logical task (build, test, deploy). Avoid overly complex jobs that do too many unrelated things, as they become harder to debug.
- Consider Reusable Workflows & Templates: If you have similar CI/CD logic across multiple repositories, leverage GitHub's reusable workflows or create organizational templates to reduce duplication and centralize maintenance.
- Document Your Workflows: Add comments within the YAML file or maintain separate documentation explaining complex steps, environment variable requirements, or the overall purpose of the workflow.
2. Monitoring and Optimization:
- Monitor Pipeline Run Times:
- Be aware of how long your workflows typically take. GitHub Actions has usage limits (time and concurrent jobs) depending on your plan. Unusually long run times can indicate inefficiencies or hangs.
- Set reasonable maximum timeouts for jobs (
jobs.<job_id>.timeout-minutes). Choose a value that's longer than the typical run time but short enough to prevent runaway jobs from consuming excessive resources (e.g., 60 minutes, or potentially 2-6 hours for very long end-to-end processes, but rarely longer unless absolutely necessary). Don't set it too short, as external services or temporary load can cause variations. - Consider setting up alerts (e.g., through GitHub status checks or external monitoring) if a workflow consistently takes much longer than expected.
- Optimize for Speed ("Fail Fast"):
- Structure your workflow so that faster, independent checks (like linting or unit tests) run before longer, more resource-intensive steps (like integration tests or deployments). This provides quicker feedback to developers if basic checks fail.
- Use caching mechanisms (e.g.,
actions/cache) effectively for dependencies (npm packages, Maven artifacts, pip packages) and build outputs to speed up subsequent runs. - Run jobs in parallel where possible if they don't depend on each other.
- Selective Pipeline Runs:
- Prevent unnecessary workflow runs to save time and resources. Use path filtering in your triggers (
on.<push|pull_request>.paths) to only run workflows when relevant code changes. For example, don't run backend tests if only the documentation (.mdfiles) was changed.
on:
push:
branches: [main]
paths:
- "src/**" # Run if code in src changes
- ".github/workflows/ci.yaml" # Run if workflow itself changes
- "package.json" # Run if dependencies change
- "!docs/**" # Don't run if only docs change
- Enhance Log Readability: Avoid excessive debug output in standard runs. Use
echostatements strategically to log key information, but ensure logs remain concise and easy to scan for errors. Redirect verbose output from specific tools to artifact files if needed for deep dives. - Heed Warnings: Pay attention to warnings emitted during workflow runs (often highlighted in yellow). These often indicate deprecated features, potential configuration issues, or upcoming breaking changes that should be addressed proactively.
3. Robust Shell Scripting in Workflows
Since many workflows rely heavily on run steps executing shell commands (usually Bash on Linux/macOS runners), ensuring script robustness is crucial.
-
Choose the Right Shebang: When writing separate script files (
.sh) executed by your workflow, start them with#!/usr/bin/env bash. This is generally preferred over#!/bin/bashbecause it finds thebashexecutable in the user'sPATH, making the script more portable and likely to use the intended Bash version available in the runner environment. -
Strict Error Handling: Always start your
runblocks or script files withset -eou pipefail(or at leastset -e). -
set -e: Exit immediately on error. -
set -u: Fail on unset variables. -
set -o pipefail: Ensure pipeline failures are detected. -
(Optionally add
set -xduring debugging to trace execution). -
Syntax Validation and Linting:
-
Syntax Check: Use
bash -n your_script.shfor a quick parse check. This catches basic syntax errors but not logical ones. Integrate this as an early step in your CI if possible. -
Linting: Use
shellcheck your_script.shextensively. It's the best tool for finding common pitfalls, quoting issues, command misuse, and potential bugs thatbash -nmisses. Run it locally before pushing and consider adding it as a CI step. -
Handle Line Endings Correctly: This is a classic cross-platform headache.
-
The Problem: Bash scripts require Unix-style Line Feed (LF) line endings. Windows typically uses Carriage Return + Line Feed (CRLF). Git might automatically convert line endings based on your configuration or platform, potentially leading to scripts failing on Linux runners with errors like
'\r': command not found. This can happen even if you didn't change the script file, but someone else on a different OS did, or if Git's settings are inconsistent. -
The Solutions:
-
Editor Configuration (
.editorconfig): Use an.editorconfigfile in your repository to instruct editors to use LF for shell scripts.
# .editorconfig
[*]
end_of_line = lf
insert_final_newline = true
trim_trailing_whitespace = true

[*.{sh,bash}]
end_of_line = lf
- Git Configuration (
.gitattributes): Control how Git handles line endings during checkout and commit. This is the most reliable way to enforce consistency across the team.
# .gitattributes
* text=auto eol=lf # Set LF for all text files by default
*.sh text eol=lf # Ensure *.sh files always have LF
*.bat text eol=crlf # Ensure Windows batch files have CRLF
# Add other file types as needed
After adding or modifying .gitattributes, team members may need to run git add --renormalize . to update the files in their working directory according to the new rules.
-
CI Check (Less Ideal): Tools like
dos2unixcan convert line endings within the CI environment, but it's better to fix the files in the repository using the methods above rather than patching them only during the CI run. -
Beware of UTF-8 "Invisibles": Certain non-standard or invisible UTF-8 characters (like Zero-Width Spaces or different types of hyphens copied from rich text editors) can sometimes cause unexpected parsing errors in scripts or configuration files. Use an editor that can show these characters or linters that might detect them. Ensure files are saved with standard UTF-8 encoding.
4. Local Development Workflow Enhancements (Example: Git Hooks)
You can automate common tasks locally to catch issues even before pushing. For instance, automatically running npm install after pulling changes that modify package.json:
- Concept: Use Git hooks, which are scripts that Git executes before or after events like
commit,push,merge, orcheckout. - Example (
post-merge/post-checkout):
- Navigate to your project's
.git/hooksdirectory. - Create two files:
post-mergeandpost-checkout. - Add the following script content to both files:
#!/bin/sh

# Check if package.json or package-lock.json changed between HEAD and the previous state (ORIG_HEAD for merge/checkout)
if git diff-tree -r --name-only --no-commit-id ORIG_HEAD HEAD | grep -qE '^(package\.json|package-lock\.json)$'; then
```bash
       echo "Detected changes in package.json/package-lock.json. Running npm install..."
       npm install
fi
Add similar checks for other dependency files if needed (e.g., requirements.txt -> pip install)
exit 0 # Exit gracefully
4. Make the hooks executable: `chmod +x post-merge post-checkout`.

- **Distribution:** Git hooks are local by default. For team-wide adoption, use tools like [Husky](https://typicode.github.io/husky/) (for Node.js projects) or similar frameworks that manage hooks via project configuration files committed to the repository.

By implementing these best practices and leveraging automation locally and in CI, you can build more resilient, efficient, and easier-to-debug GitHub Actions workflows.

### **Conclusion: Building Resilient Workflows**

Debugging CI/CD pipelines, particularly in a remote environment like GitHub Actions, requires a systematic approach and familiarity with the right tools and techniques. As we've seen, issues can stem from simple syntax errors in your YAML files, complex dependency conflicts, subtle shell script bugs, or problems within the runner environment itself.

The key to mastering workflow debugging lies in a combination of **proactive prevention** and **efficient reaction**. Prevention involves writing clean, well-structured workflow files, using linters (`actionlint`, `shellcheck`, YAML linters), managing dependencies carefully with lock files and version pinning, handling shell script intricacies like line endings and error checking (`set -eou pipefail`), and adopting best practices like path filtering and caching.

When failures inevitably occur, efficient reaction means knowing how to interpret workflow logs effectively, leveraging verbose debug logging (`ACTIONS_STEP_DEBUG`) when necessary, understanding common error patterns like non-zero exit codes, and employing strategies like local replication (using Docker or tools like `act`) or temporary SSH access to diagnose tricky issues.

By applying the methods discussed in this chapter – from basic log reading and linting to advanced Bash debugging and local execution – you can significantly reduce the time spent troubleshooting failed runs. Remember that robust, reliable workflows are not just about getting the code to pass; they are about building confidence in your automation, enabling faster feedback loops, and ultimately contributing to a smoother, more efficient CI/CD process. Treat your workflow code with the same care as your application code, and you'll build a more resilient and productive development pipeline.

NEW

## **CI/CD script with complex quoting for Kubernetes deployment**

Imagine you're deploying a web application to Kubernetes using GitHub Actions. You need to pass a complex command as an argument to kubectl to configure a ConfigMap for your application. This command includes single quotes that need to be escaped within a single-quoted string.

**Complex bash script in GitHub Actions:**

name: Deploy to Kubernetes

on:

push:

branches:

- main

jobs:

deploy:

runs-on: ubuntu-latest

steps:

- name: Checkout Code

uses: actions/checkout@v3

- name: Configure ConfigMap

run: \|

```bash
kubectl create configmap my-app-config --from-literal=MY_COMMAND=''"'"'ps -ef \| grep nginx'"'"'
kubectl apply -f deployment.yaml
The challenge lies in the kubectl create configmap command:
-
We're using --from-literal to set the MY_COMMAND key in the ConfigMap.
-
The value of this key needs to be a shell command: ps -ef | grep nginx
-
This command needs to be enclosed in single quotes for the ConfigMap to interpret it correctly.
This leads to the same convoluted escaping we saw in the previous example: '"'"'ps -ef | grep nginx'"'"'
This script is hard to read and prone to errors. Anyone trying to understand or modify this workflow would have a difficult time deciphering the quoting.
Practical Git Commands for CI/CD
Here are practical examples of common git commands used in CI/CD pipelines, specifically within a GitHub Actions context:
1. Cloning a Repository:
- name: Checkout Code
uses: actions/checkout@v3
with:
repository: your-org/your-repo
ref: your-branch
This step uses the official actions/checkout action to clone the specified repository and branch.Do you want to do this? For example if you want to do some commits that have to be on the pipeline? For example there might be some bots, for example linting bots or chore bots that.Add version numbers are kind of things like that and you want to differentiate it between a actual user and some like clean up.Our utility.To make it clear for your commit history.
2. Setting up User Information:
- name: Configure Git User
run: |
git config user.name "GitHub Actions Bot"
git config user.email "actions@github.com"
These commands set the user name and email for git commits made during the workflow.
3. Adding a File:
- name: Add Updated File
run: git add path/to/your/file.txt
This adds the specified file to the staging area, preparing it for the commit.You may want to do this in your GitHub Actions because there are some situations where you need to add certain configuration files or.Things when you do the build and this one could be done via the pipeline.
4. Committing Changes:
- name: Commit Changes
run: git commit -m "Automated update: [Description of changes]"
This commits the staged changes with a descriptive commit message.
5. Pushing to Branch (e.g., for a PR):
- name: Push Changes
run: git push origin your-branch
This pushes the committed changes back to the specified branch on the origin remote (usually GitHub).
6. Creating and Pushing Tags:
- name: Create Tag
run: git tag -a v1.2.3 -m "Release v1.2.3"
- name: Push Tag
run: git push origin v1.2.3
These commands create an annotated tag with a message and then push it to the origin remote.This is primarily used for when you want to create releases in a.Single branch workflows that be like trunk based development. So for example you can have a pipeline that is release pipeline and then when you run this on the main branch for example then it would tag the commit and then push that tag to the main branch for example.
Complete Example in GitHub Actions:
name: Update and Tag
on:
push:
branches:
- main
jobs:
update-and-tag:
runs-on: ubuntu-latest
steps:
- name: Checkout Code
uses: actions/checkout@v3
- name: Configure Git User
run: |
git config user.name "GitHub Actions Bot"
git config user.email "actions@github.com"
# ... Your CI/CD steps to modify files ...
- name: Add Updated File
run: git add path/to/your/file.txt
- name: Commit Changes
run: git commit -m "Automated update: [Description of changes]"
- name: Push Changes
run: git push origin main
- name: Create Tag
run: git tag -a v1.2.3 -m "Release v1.2.3"
- name: Push Tag
run: git push origin v1.2.3
This example demonstrates a typical workflow where the code is checked out, modifications are made, changes are committed and pushed back to the main branch, and finally, a new tag is created and pushed to the repository. Remember to adapt these commands to your specific CI/CD needs and repository structure.
Practical Examples of Common Linux Commands
Here are some practical examples demonstrating the usage of common Linux commands:
1. find
Finding files with specific criteria:
- Find all files in the current directory and its subdirectories named "config.txt":
find . -name "config.txt"
- Find all files in the current directory and its subdirectories modified in the last 24 hours:
find . -mtime -1
- Find all files in the current directory and its subdirectories with the "txt" extension:
find . -name "\*.txt"
Using find with -exec to execute commands:
- Delete all files in the current directory and its subdirectories older than 30 days:
find . -mtime +30 -exec rm {} \;
- Rename all files in the current directory and its subdirectories ending with ".bak" to ".txt":
find . -name "\*.bak" -exec mv {} `echo {} \| sed 's/\.bak$/.txt/'` \;
Using find with -0 for piping:
- Find all .txt files in the current directory and its subdirectories, then print their file sizes:
find . -name "\*.txt" -print0 \| xargs -0 du -h
2. tar
Creating an archive:
- Archive all files in the current directory into a file named "my_archive.tar":
tar -cf my_archive.tar \*
- Archive all files in the "documents" directory into a file named "documents.tar", showing progress:
tar -cvf documents.tar documents/\*
- Create a compressed archive of all files in the "pictures" directory:
tar -czvf pictures.tar.gz pictures/
Extracting an archive:
- Extract the contents of "my_archive.tar" to the current directory:
tar -xf my_archive.tar
- Extract the contents of "documents.tar.gz" to the "extracted" directory:
tar -xzvf documents.tar.gz -C extracted
Directory Structure of tar Archives:
If you cd into a directory and then use tar -cf archive.tar * to create an archive, the resulting archive will have a structure that reflects the relative paths of the files within the directory. For example, if your directory structure is:
directory/
-
file1.txt
-
subdirectory/
-
file2.txt
content_copyUse code with caution.
The archive.tar will have a similar structure when extracted:
extracted/
-
file1.txt
-
subdirectory/
-
file2.txt
content_copyUse code with caution.
3. zip
Creating an archive:
- Zip all files in the current directory into "my_archive.zip":
zip -r my_archive.zip \*
- Zip the contents of the "documents" directory into "documents.zip":
zip -r documents.zip documents/
Extracting an archive:
- Extract the contents of "my_archive.zip" to the current directory:
unzip my_archive.zip
- Extract the contents of "documents.zip" to the "extracted" directory:
unzip -d extracted documents.zip
4. for
Looping through files:
- Print the names of all files in the current directory:
for file in *; do
echo "$file"
done
- Create a backup of all .txt files in the current directory:
for file in *.txt; do
cp "$file" "$file.bak"
done
Looping through numbers:
- Print numbers from 1 to 10:
for i in {1..10}; do
echo "$i"
done
- Execute a command 5 times with a 2-second delay between each execution:
for i in {1..5}; do
echo "Executing command..."
sleep 2
done
5. touch
- Create a new empty file named "new_file.txt":
touch new_file.txt
`
- Update the modification time of "important_file.txt" to the current time:
touch important_file.txt
6. EOF
Multiline strings in shell scripts:
#!/bin/bash
message="This is a multiline
string with variables: $HOME"
echo "$message"
cat << EOF
This is another multiline
string.
EOF
7. pwd
- Print the current working directory:This is useful when you want to debug where you're currently at. If you're writing some commands and they look like they're not working, for example.
pwd
8. sleep
- Wait for 5 seconds:
sleep 5
- Wait for 10 minutes:
sleep 10m
- Wait for 2.5 hours:
sleep 2.5h
9. apt-get
- Update the package list:
apt-get update
- Install the "vim" package without prompting:
apt-get -y install vim
- Install multiple packages:
apt-get -y install vim curl git
10. ln
- Create a symbolic link named "my_link" pointing to the file "important_file.txt":
ln -s important_file.txt my_link
11. df
- Show free disk space for all mounted filesystems:It's useful if your runner is running out of space and you want to do some debugging, for example.
df -h
- Show free disk space for the "/home" filesystem:
df -h /home
12. unzip
- Unzip the contents of "my_archive.zip" to the current directory:
unzip my_archive.zip
- Unzip the contents of "documents.zip" to the "extracted" directory:
unzip -d extracted documents.zip
13. grep
- Find lines containing the word "error" in the file "log.txt":
grep "error" log.txt
- Find lines containing the pattern "error[0-9]+" (error followed by one or more digits) in the file "log.txt":
grep "error[0-9]+" log.txt
- Find lines in all files in the current directory that contain the word "warning":
grep "warning" \*
Practical Examples for Additional Linux Commands:
1. env
- Display all environment variables:This will also show any keys as well. There are only echoing out certain variables if necessary.
env
- Check the value of a specific environment variable:This will show any keys as well.
env | grep HOME
2. exit
- Exit a script with a specific exit code:Thing other than 0 is considered a failure exit code, so be careful.
#!/bin/bash
if [ ! -d "/path/to/directory" ]; then
echo "Directory not found!"
exit 1
fi
# ... rest of your script ...
- Exit a script with a success code:
#!/bin/bash
# ... your script logic ...
exit 0
3. choco
- Install the "7-zip" package:
choco install 7zip
- Install multiple packages:
choco install 7zip notepadplusplus
- Update the package list:
choco update -y all
4. while
- Loop until a file exists:
#!/bin/bash
while [ ! -f "my_file.txt" ]; do
echo "Waiting for my_file.txt..."
sleep 1
done
echo "File found!"
- Loop until a specific condition is met:
#!/bin/bash
counter=0
while [ $counter -lt 10 ]; do
echo "Counter: $counter"
counter=$((counter + 1))
done
5. dir
- List files in the current directory:
dir
- List files in a specific directory:
dir /path/to/directory
- List hidden files:
dir /a
6. diff
- Compare two files and display differences:
diff file1.txt file2.txt
- Highlight differences using color:
diff --color file1.txt file2.txt
- Compare two directories recursively:
diff -r dir1 dir2
7. apt
- Update the package list:
apt update
- Install a package:
apt install vim
- Upgrade all installed packages:
apt upgrade
- Remove a package:
apt remove vim
Tips on working with JSON
I would be tempted to use Python if you are doing advanced string manipulation/JSON.
Common commands. Lots are for managing GitHub releases/tags/GitHub API and extracting release ids and such. jq -r very popular (raw output, that is, no quotes.) jq -c also popular (print on one line.) jq --arg should be used more frequently; variable injection manually is very weird as to what people are doing. Using -c with -r is redundant. You can also avoid piping jq to jq via jq '.icons | keys | .[]' manifest.json. Lots of unnecessary uses of cat and echo; jq can pass in a filename as its second argument.
Creating a cookbook about using jq in CI/CD GitHub Actions based on the provided commands can be a valuable resource for developers. Here are key topics and tips you should consider including in your cookbook:
1. Introduction to jq and Its Relevance in CI/CD Pipelines: Explain what jq is and why it's particularly useful in CI/CD contexts, especially with GitHub Actions. Highlight its ability to parse, filter, and transform JSON data.
2. Basic jq Syntax and Operations: Start with basic jq syntax and operations, as many users may be new to jq. Examples from your commands include extracting values (jq '.NumberOfPass'), raw string output (jq -r), and array operations (jq '.\[\]').
3. Parsing GitHub API Responses: Many of your commands involve parsing GitHub API responses. Include examples on how to extract specific data like repository names, pull request numbers, and tag names (e.g., jq \--raw-output '.repository.name' \$GITHUB_EVENT_PATH).
4. Manipulating and Writing JSON Data: Show how jq can be used to modify JSON files, which is crucial in dynamic CI/CD environments. This includes setting new values, deleting keys, and merging JSON objects (e.g., jq '.version = \$version' package.json \> "\$tmp").
5. Complex Filters and Queries: Cover more complex jq queries for advanced use cases, such as filtering, mapping, and reducing JSON data. For example, extracting data based on certain conditions or iterating over arrays.
6. Integrating jq with Shell Commands: Many commands show jq being used in conjunction with shell commands (curl, echo, sed, etc.). Offer guidance on how to effectively combine these tools within GitHub Actions workflows.
7. Error Handling and Debugging: Include tips on handling errors in jq commands and how to debug common issues. For instance, dealing with missing or unexpected data.
8. Use Cases Specific to GitHub Actions: Provide specific examples of jq use cases in GitHub Actions, like setting environment variables, extracting data from GitHub event payloads, and working with outputs from other actions.
9. Security and Best Practices: Discuss best practices for using jq securely in CI/CD pipelines, especially when handling sensitive data, and how to avoid common pitfalls.
10. Advanced Topics: Optionally, cover more advanced topics like writing custom functions in jq or optimizing performance for large JSON datasets.
Remember to include plenty of examples and perhaps even a troubleshooting section. This cookbook can be a practical guide for developers looking to harness the power of jq in automating and enhancing their CI/CD pipelines with GitHub Actions.
Jq is a command-line JSON parser. It is very powerful and can even parse messy JSON. However, it has a few useful features to ensure output correctness and safety. As with all commands, it has some behaviors on failure which may or may not be desirable.
Knowing about the pitfalls and workarounds allow you to use jq more robustly and avoid changing it with other commands which can cause parsing issues later on that are difficult to debug.
Use jq -r if you don't want quotes; don't use tr -d
Say you have a value in a JSON string that has quotes but you want to remove the quotes. You could do:
echo "{"x":"3"}" | jq .x | tr -d '"' which returns 3.
The issue is that you're assuming that the JSON will have no quoted values. For example, this returns the wrong value:
echo "{"x": "\\"Three\\"" }" | jq .x | tr -d '"' returns \Three\ instead of just the word "Three" (with quotes.) This was probably not intended.
If you use -r:
echo "{"x": ""Three"" }" \| jq -r .x
The output is "Three" (with quotes) which probably was intended.
If the JSON isn't valid, jq will stop parsing and will print incomplete output
Be careful when parsing documents that could be invalid JSON because jq will print the first part that parsed correctly. If you're piping it, it may appear that it was parsed in its entirety. Always check status codes to ensure that the entire JSON block was parsed.
For example, I have a JSON document with one syntactically invalid entry but several entries before it are valid.
I run jq .[].friends test and get:
...
[
{
"id": 0,
"name": "Rosario Melendez"
},
{
"id": 1,
"name": "Melendez Brennan"
},
{
"id": 2,
"name": "Vincent Spence"
}
]
parse error: Expected separator between values at line 448, column 7
I get output, but that output is incomplete. Ensure you check the status code from jq (in this case it was 4.) If I stored it in a variable, I would get a string but that string would be invalid because the parsing error didn't parse the entire file. If I just checked if the variable's length wasn't zero, then I wouldn't be getting the right output.
Just use set -e...right? Right?
You may think that set -e will help. It can, if the output isn't piped. If it is piped, then the receiving program could line-buffer the input and start processing it when it could be invalid or incomplete.
It's easy to test this. Simply run:
#!/bin/bash
set -e
true | jq invalid | echo test
echo "I am still running"
The output is "test" followed by "I am still running" (although some errors), even though the command jq invalid failed (because the file doesn't exist.) The script still continued to run even though one of the lines returned a failure code. Also, the exit code from the script is 0, indicating success even though it was unsuccessful.
Considerations
Use jq's empty filter to validate the file before parsing, or check the error code after parsing the JSON.
Be careful with jq -r and newlines
Let's go back to an example file. You run cat test | jq -c .[].friends and get the following output:
[{"id":0,"name":"Cherie\nFrederick"},{"id":1,"name":"Mcclure Howell"},{"id":2,"name":"Skinner Leon"}]
[{"id":0,"name":"Dana Stout"},{"id":1,"name":"Stacy Irwin"},{"id":2,"name":"Everett Paul"}]
[{"id":0,"name":"Billie Douglas"},{"id":1,"name":"Ebony Acosta"},{"id":2,"name":"Hunt Strickland"}]
[{"id":0,"name":"Mcclain Roberts"},{"id":1,"name":"Frankie Wynn"},{"id":2,"name":"Mckay Sanders"}]
[{"id":0,"name":"Rosario Melendez"},{"id":1,"name":"Melendez Brennan"},{"id":2,"name":"Vincent Spence"}]
Each friend is on a line by themselves. This means I can loop over the lines and parse each JSON line individually, right? Well, in this example yes. If the names contain newlines, though, then you'll have broken JSON:
cat test \| jq -c .[].friends \| jq -r .[].name
Cherie
Frederick
Mcclure Howell
Skinner Leon
Dana Stout
...
Here, Cherie and Frederick are on two seperate lines. If you were to parse them, then the names wouldn't match.
Considerations
Use jq -0 instead of -r to delimit using null characters.
Don't quote the output yourself, use -R
Wrapping the output in double quotes doesn't guarantee that the characters will be escaped correctly if the input contains double quotes.
Use -a for escaping unicode characters
Depending on the JSON parser or other parsers in the pipeline, it might not expect non-ASCII chars.
If you are logging to a file and the logger doesn't expect UTF-8 output (and parses it as ASCII), then some characters could become corrupted.
For example,
echo "Á" \| jq -R yields "Á" (with quotes.)
The -a switch changes this behavior and replaces them with escape sequences:
echo "Á" \| jq -a -R yields "\u00c1" (with quotes.)
Considerations
Use -a when you need unicode safety.
Use @filters instead of $(...) when concatenating strings
Running this command produces the right output,
echo "{"page": 3}" | echo "https://example.com/search?id=$(jq .page)" (outputs https://example.com/search?id=3).
But it gets dangerous if the number turns into text that contains non-URI safe characters:
echo "{"page": "[3-2]"}" | echo "https://example.com/search?id=$(jq .page)" which returns https://example.com/search?id="[3-2]" . If you were to pipe this URL into curl, curl interprets the square brackets as a URL range. Curl fails to download that URL with the error, "curl: (3) [globbing] bad range in column 26".
However, running:
echo "{"page": "[3-2]"}" | jq '@uri "https://www.google.com/search?q=\(.page)"' which returns "https://www.google.com/search?q=%5B3-2%5D". This is URL safe.
Considerations
Use jq's filters when concatenating inputs from multiple sources. Look into the @sh filter for creating shell compatible output to ensure command interoperability.
These commands are using the GitHub API to perform a variety of tasks related to repository management, such as checking for tags, retrieving release information, obtaining commit details, and more. Below is an overview of their functionalities:
1. Checking if a Tag Exists: Multiple commands are designed to check if a specific tag exists in a repository. This is commonly used in CI/CD pipelines to determine if a new release or deployment should be triggered.
2. Fetching Release Information: Several commands retrieve information about the latest releases of different repositories, such as the latest release tag, release ID, asset IDs, etc. This is useful for automation scripts that deploy or update software based on the latest release.
3. Obtaining Commit Details: Some commands fetch details about specific commits, like the commit date, the commit message, and the commit's SHA. This can be used for tracking changes or automating workflows based on commit history.
4. Pull Request and Issue Management: A few commands involve extracting information about pull requests and issues (like PR numbers or issue labels). This is essential for automating workflows around issue tracking and PR management.
5. Extracting Repository Data: Commands are used to extract various repository data, such as the number of stars, repository description, default branch, and contributor details. Such information is often used in metrics dashboards or repository documentation.
6. Download URLs for Assets: Many commands are designed to extract download URLs for specific assets from releases. This is commonly used in scripts to automatically download the latest version of a software package or tool.
7. Workflow Management: Some commands focus on retrieving information about GitHub Actions workflows, like workflow IDs, run conclusions, and statuses. This aids in managing and tracking CI/CD processes.
8. Setting Environment Variables: Several commands set environment variables based on data fetched from the GitHub API, such as release tags, version numbers, or asset IDs. This is a common practice in CI/CD pipelines to pass dynamic data between steps.
Overall, these commands represent a diverse set of automated tasks related to software development and deployment, leveraging GitHub as a central platform for source code management and CI/CD processes.
[After this, here are the next sections (not finished) it will continue with the weather app And introduce more complex things such as blue-green deployments as well as advanced deployment strategies including ARM and BICEP templates, infrastructure as code, security, and everything described below.]
Practical Docker Commands in CI/CD
Here are practical examples of the Docker commands, incorporating best practices for CI/CD workflows:
1. Docker Build and Push (73 instances):
- name: Build and Push Image
  run: |
    docker build -t registry.example.com/my-project/my-app:${{ github.sha }} .
    docker push registry.example.com/my-project/my-app:${{ github.sha }}
This builds an image tagged with the GitHub commit SHA for traceability and pushes it to a registry.Reason why you would watch this command is because when you push something to a registry and it's a new version for example, you have to tag the image and when you tag it and you push it then it pushes that tag and that and subsequently that docker image to the registry. So for example if you building some docker images inside of your continuous integration pipeline, you would tag the image and then push it.This also be useful for deployment for example. Echo command in this case is used to pass the password that's associated with your registry to the standard input of the docker command, and this way it makes it so that it's not it doesn't get displayed on the output, and also you're not creating these temporary files that have passwords in them, so it's only done in memory.
2. Docker Login and Logout (13 instances):
- name: Docker Login
run: echo "${{ secrets.DOCKER_PASSWORD }}" | docker login -u ${{ secrets.DOCKER_USERNAME }} --password-stdin registry.example.com
- name: Docker Logout
if: always()
run: docker logout registry.example.com
This securely logs into the registry using secrets, and the if: always() ensures logout even if previous steps fail.
3. Docker Run (8 instances):
- name: Run Database
run: docker run -d -p 5432:5432 --name my-postgres -e POSTGRES_PASSWORD=secret postgres:13
This starts a PostgreSQL database container in detached mode with specific configurations.
4. Docker Pull (4 instances):
- name: Pull Node.js Image
run: docker pull node:16-alpine
This pulls a specific Node.js image for use in later steps.
5. Docker RMI (Remove Image) (3 instances):
- name: Clean Up Images
if: always()
run: docker rmi $(docker images -f "dangling=true" -q)
This cleans up dangling images after builds, freeing up space.
6. Docker Start & Exec & Network Ops (4 instances):
- name: Start Database
run: docker start my-postgres
- name: Execute Command in Container
run: docker exec my-postgres psql -U postgres -c "SELECT version();"
- name: Create Network
run: docker network create my-network
This demonstrates starting a container, running commands inside it, and managing networks.
7. Docker Tag (2 instances):
- name: Tag Image for Production
run: docker tag registry.example.com/my-project/my-app:${{ github.sha }} registry.example.com/my-project/my-app:production
This creates a production tag for the latest successful build.
8. Docker System and Info (2 instances):
- name: System Prune
if: always()
run: docker system prune -f
- name: Docker Info
run: docker info
This cleans up unused Docker resources and displays system-wide information.
9. Docker-compose (1 instance):
- name: Build and Push with Compose run: | docker-compose -f docker-compose.prod.yml build docker-compose -f docker-compose.prod.yml push
This builds and pushes a multi-container application using docker-compose.
10. Docker CP (Copy) (1 instance):
- name: Copy File to Container
run: docker cp ./config.json my-container:/app/config.json
This copies a configuration file to a running container.
11. Docker Commit (1 instance):
- name: Commit Container Changes
run: docker commit my-container registry.example.com/my-project/modified-container:latest
This creates a new image based on the changes made to a container.
12. Docker Inspect imagetools (1 instance):
- name: Inspect Image
run: docker buildx imagetools inspect registry.example.com/my-project/my-app:latest
This provides details about the specified image.
13. Docker Run Test (1 instance):
- name: Run Tests in Container
run: docker run my-test-image npm test
This executes tests inside a container dedicated to testing.
14. Docker Pull and Run (1 instance):
- name: Pull and Run Migration Script
run: |
docker pull registry.example.com/my-project/migration-tool:latest
docker run registry.example.com/my-project/migration-tool:latest --database my-database
This pulls a dedicated image and then runs a migration script with it.
Practical Examples for mkdir and curl
mkdir
- Creating a single directory:
mkdir new_directory
- Creating multiple directories at once:
mkdir -p path/to/nested/directory
This creates all the parent directories if they don't exist.
- Creating multiple directories in the current directory:
mkdir dir1 dir2 dir3
curl
Basic Usage:
- Downloading a web page:
curl https://www.example.com
- Downloading a file:
curl -o file.txt https://www.example.com/file.txt
- Downloading a file using the filename from the URL:
curl -O https://www.example.com/file.txt
- Following redirects:
curl -L https://www.example.com/redirect
Sending Headers:
- Sending an Authorization header:
curl -H "Authorization: Bearer your_token" https://api.example.com
Making POST Requests:
- Sending a POST request with data:
curl -X POST -d "name=John&email=john.doe@example.com" https://api.example.com/users
- Sending a POST request with a file:
curl -X POST -F "file=@file.txt" https://api.example.com/upload
Using Variables:
- Storing a URL in a variable:
url="https://www.example.com"
curl $url
- Escaping special characters:
url="https://www.example.com/search?query=hello%20world"
curl $url
Error Handling:
- Failing on non-200 status codes:
curl -f https://www.example.com/nonexistent_page
- Outputting status codes with -w:
curl -w "%{http_code}" https://www.example.com
Retry Flags:
- Retrying failed requests:
curl --retry 3 --connect-timeout 10 https://www.example.com
Piping Output:
- Downloading a script and executing it:
curl -o script.sh https://www.example.com/script.sh
bash script.sh
Handling Multi-File Transfers:
- Stopping the process on the first failure:
curl --fail-early -o file1.txt https://www.example.com/file1.txt -o file2.txt https://www.example.com/file2.txt
Remember:
-ois generally preferred over redirection operators (>) for writing to files, as it allows for retry flags.- Use
-wto cleanly output status codes instead of parsing command-line output. - Be aware of status codes in multi-file transfers.
These examples illustrate the versatility of mkdir and curl for managing directories and interacting with web resources. Experiment with different options and combinations to tailor them to your specific needs.
curl returns success, even on HTTP status code failures (e.g., 404, 500, etc.) by default and will only fail if it can’t connect to the server or the server doesn’t exist. You can make it fail on non-200 status codes with -f.
If the URL ends with a “/” do not use -O; otherwise, it won’t be able to write to the file. Prefer -o and specify your own filename.
You’re right, and I appreciate the clarification. Let’s break down the combination of -f, -s, and -S in the curl command curl -fsSL example.com for a better understanding:
Basically, -f says that if the server returns a 404, then curl returns a non-zero exit code. Technically, this isn’t a failure of the server because the server did respond with something, so therefore curl returns exit code 0 (success) because the request was successful, but the server said it wasn’t found (successfully returned an error).
-for--fail: Tellscurlto fail and return a non-zero exit status for server errors (HTTP responses like 4xx or 5xx). When this option is used,curlwill not output the error page content but will exit with an error status.-sor--silent: Suppresses all output, including error messages and the progress meter. It’s typically used to makecurlquiet in scripts or when you only care about the fetched content or the exit status. This is useful; otherwise, your logs can get messy because the progress bar gets chopped up.-Sor--show-error: When used with-s, this option tellscurlto still show error messages even though it’s in silent mode. Normally,-ssuppresses error messages, but-Soverrides this for error messages while keeping other outputs (like the progress meter) suppressed.
So, when you use -fsS together, it means:
curlwill fail and return a non-zero status on server errors (-f).curlwill not output the regular HTTP content or progress meter (-s).- However, it will still show error messages if there are any (
-S).
In essence, this combination makes curl operate quietly in normal circumstances but still report if something goes wrong, such as an HTTP error. It’s a common pattern used in scripting where you want minimal output except for indicating when errors occur.
You’re right to be cautious about using curl -J. While it seems convenient for grabbing content with a specific filename, it comes with several caveats that can lead to unexpected behavior and problems.
Here’s a breakdown of the issues:
-
Filename Changes: The biggest caveat is that the
-Jflag relies on the server’sContent-Dispositionheader to determine the filename. Servers can have different configurations and may not always provide this header, or they may provide an inconsistent filename depending on the request. This means your downloaded file might not have the expected name, potentially overwriting existing files with unintended content. -
Server-Side Inconsistencies: Even if the
Content-Dispositionheader is present, the filename it provides can change depending on factors like:
- Dynamically generated content: For example, a website might create a new file name each time you request it, so
-Jwould give you a different filename every time. - Server configuration: Different servers might have different settings for the
Content-Dispositionheader. - File extensions: The server might not include the file extension in the header, making it difficult to determine the file type.
- Potential Security Issues: Using
-Jcan expose you to potential security vulnerabilities if you’re not careful. If a malicious server sends aContent-Dispositionheader with a filename that tries to access sensitive system files or directories,curl -Jcould unknowingly execute commands or provide access to sensitive data.
Alternatives to curl -J:
Instead of relying on -J, it’s usually safer to:
- Use
-oand specify the filename yourself: This gives you complete control over the filename and avoids the potential for unintended consequences. - Extract the filename from the
Content-Dispositionheader: You can use curl’s output parsing features to extract the filename from theContent-Dispositionheader and then use it with-o. This is more complex but can provide more robust filename handling. - Combine
-Jwith-O: While this is not recommended for the same reasons as using-Jalone, it could be used if you want to be sure to use the exact filename provided in theContent-Dispositionheader (if available) and need to avoid potential filename collisions.
In Summary:
While curl -J might seem tempting for its simplicity, the potential for unexpected behavior and security vulnerabilities outweigh the benefits. It’s generally safer to avoid -J and use alternative methods to control filenames and ensure predictable and secure downloads. Remember to always be mindful of the origin of the files you are downloading and take appropriate precautions to protect your system from malicious content.
Practical Examples of rm, ls, wget, cat, and mv
rm (Remove files and directories)
Removing a single file
rm old_file.txt
Removing a directory recursively
rm -rf old_directory/
- This removes the entire directory "old_directory" and its contents.
Verbose output
rm -v old_file.txt
- Shows the file being deleted on the terminal.
Safety measure
rm - old_file.txt
- Prevents rm from interpreting "-" as a command-line option by treating it as a file name.
ls (List directory contents)
Listing non-hidden files
ls
- Lists files and directories in the current directory that don’t start with a dot.
Listing all files, including hidden ones
ls -a
Listing with detailed information
ls -l
- Shows permissions, owner, group, size, and last modified date.
Listing recursively
ls -R
- Displays contents of subdirectories recursively.
wget (Download files from the internet)
Downloading a file and saving it to stdout
wget -O- https://www.example.com/file.txt
- Prints the file content directly to the terminal.
Downloading a file quietly (no progress bar)
wget -q https://www.example.com/file.txt
- Downloads silently with no progress bar.
Updating a file if it has changed on the server
wget -n https://www.example.com/file.txt
- Downloads only if it has been modified since the last time it was downloaded. This can be useful, for example, if you want to update a file on your runner that is cached or restored. It uses the modification ETag (or similar) from the server to check for changes.
cat (Concatenate and print files)
Printing the content of a file
cat file.txt
- Displays the content of file.txt.
Concatenating multiple files
cat file1.txt file2.txt > combined.txt
- Combines the content of file1.txt and file2.txt into combined.txt.
mv (Move or rename files)
Moving a file to a new location
mv file.txt new_directory/
- Moves file.txt to the directory "new_directory".
Renaming a file
mv old_name.txt new_name.txt
- Renames old_name.txt to new_name.txt.
Moving multiple files to a directory
mv -t destination_directory/ file1.txt file2.txt file3.txt
- Moves file1.txt, file2.txt, and file3.txt to "destination_directory".
Remember to use these commands carefully, especially rm and mv, as they can potentially delete or overwrite files and directories. Always double-check your commands before executing them.
Practical Examples of sed
1. Replacing Version Numbers:
sed -i 's/version="1.2.3"/version="1.2.4"/g' file.txt
Important thing to note here is that the forward slash is used as a delimiter.This means that if you put another forward slash, it will be interpreted as a delimiter.In this case you can use different types of delimiters, so for example the pipe which is just a straight line where you can use.Maybe a question mark or something like that?It doesn't really matter too much as long as it doesn't occur within the text.
That dash I flag, then it will pipe the content of the file with the replacement to send it open.Now, if you are doing that and you're piping it to another command, it's very important that you don't pipe it back to the same file because the file might not be completely redid memory yet, which could cause the file to be corrupted. Instead, you should either use a sponge command which is in the more detailed.Package or you should type it into another file.
This replaces all occurrences of version="1.2.3" with version="1.2.4" in file.txt, editing the file in place.
-
-i: Edits the file in place.
-
s/old/new/g: s for substitution. old is the text to be replaced, new is the replacement text. g stands for "global", replacing all occurrences on a line.
2. Using Different Delimiters:
sed -i 's\|old_path\|/new/path\|g' script.sh
This replaces old_path with /new/path in script.sh using | as delimiters, useful if your replacement text contains /.
3. Multiple Replacements on One Line:
sed -i 's/old1/new1/g; s/old2/new2/g' file.txt
This makes two replacements in file.txt: old1 with new1 and old2 with new2.
4. Using Variables:
VERSION="2.0.0"
sed -i "s/version="1.2.3"/version="${VERSION}"/g" file.txt
This replaces the version number with the value of the VERSION variable, demonstrating dynamic substitution.
5. Deleting Lines Containing a Pattern:
sed -i '/# This line is a comment/d' config.txt
This removes any lines containing the comment # This line is a comment in config.txt.
6. Using Extended Regular Expressions (-E or -r):
sed -E 's/[0-9]+ (.\*)/\1/' file.txt
This command uses extended regular expressions (-E) to remove leading numbers followed by a space from each line in file.txt.
7. Replacing Text on a Specific Line:
sed -i '13s/old_value/new_value/' source_code.c
This replaces old_value with new_value on line 13 of source_code.c.
Key Points:
-
Delimiters: You can use any character as a delimiter for sed substitutions, as long as it doesn't appear in the old or new text.
-
Safety: Like rm, sed -i modifies files in place. Always back up important files before using sed -i.
-
Regular Expressions: sed is powerful because of its support for regular expressions. Explore regular expressions to perform more complex text manipulations.
This set of examples demonstrates the versatility of sed in handling various text editing tasks. As you explore further, you'll find that sed is an indispensable tool for automating text processing in shell scripts.
cp Command Examples:
Here are concrete examples for the cp command, demonstrating various options and their applications:
1. Copying a Single File:
**Overwriting silently:
** cp file.txt backup.txt
- This copies file.txt to backup.txt, overwriting backup.txt silently if it already exists.
2. Copying Directories:
**Creating a subdirectory:
** cp -r project_folder/ destination_folder/
- This copies the entire project_folder directory recursively (including its contents) to destination_folder, creating a new subdirectory destination_folder/project_folder.
**Copying directory contents to a new directory:
** cp -r project_folder/* destination_folder/
- This copies all files and subdirectories (except those starting with a dot) from project_folder to destination_folder.
**Copying all files (including hidden ones):
** cp -rT project_folder/ destination_folder/
- This copies all files and subdirectories, including hidden files (those starting with a dot), from project_folder to destination_folder.
3. Preserving Permissions and Symlinks:
**Preserving symlinks and permissions:
** cp -a source_directory/ destination_directory/
- This copies the source_directory recursively, preserving symbolic links and file permissions.
4. Verbose Output:
**Showing copied files:
** cp -v source_file.txt destination_file.txt
- This copies source_file.txt to destination_file.txt and displays each copied file on the terminal.[Very useful if you're trying to debug some copied files.]
Key Points:
-
-r and -R are aliases: They both mean recursive copying.
-
Hidden files: Files beginning with a dot (e.g., .git folder) are typically considered hidden.
-
cp -T: This option copies hidden files and directories as well.
-
cp -a: This option is useful for creating a true mirror of the original directory, preserving metadata.
-
cp -v: This option is helpful for debugging and tracking which files are being copied.
Remember:
-
Always use cp carefully, as overwriting files without confirmation can lead to data loss.
-
Be mindful of where you're copying files to avoid accidentally overwriting important files or directories.
-
Use the appropriate options based on your needs to ensure successful and safe file copying.
chmod Command Examples:
Here are practical examples of how to use the chmod command to change file permissions:
1. Making a File Executable:
Single file:
chmod +x script.sh
- This command adds execute permission to
script.sh. On a GitHub runner, this is required if you want to execute the script (e.g.,./script.sh).
Recursive on a directory:
chmod -R +x bin/
- This command recursively adds execute permission to all files and directories within the bin/ directory.
2. Setting Specific Permissions:
SSH keys have required permissions. If the permissions are too open, SSH may refuse to use the key.
Setting read and write permissions for the owner:
chmod 600 ~/.ssh/id_rsa
-
This sets the permissions of the file ~/.ssh/id_rsa to 600, which translates to:
-
6 - owner (user) has read and write permissions
-
0 - group has no permissions
-
0 - others have no permissions
Setting read permissions for the owner, group, and others:
chmod 644 ~/.ssh/id_rsa.pub
-
This sets the permissions of the file ~/.ssh/id_rsa.pub to 644, which translates to:
-
6 - owner (user) has read and write permissions
-
4 - group has read permissions
-
4 - others have read permissions
3. Understanding Permission Modes:
-
Octal Notation: chmod uses octal notation to represent permissions:
-
The first digit (hundreds place) represents the owner's permissions.
-
The second digit (tens place) represents the group's permissions.
-
The third digit (ones place) represents the others' permissions.
-
Permissions:
-
4: Read permission
-
2: Write permission
-
1: Execute permission
4. Using umask:
- Setting the default permissions: The umask command sets the default permissions for newly created files and directories. For example, umask 022 sets the default permissions to 644 for files and 755 for directories.
**Setting a specific umask:
** umask 022
- This sets the umask to 022, ensuring that newly created files will have read/write permissions for the owner and read permissions for the group and others.
Key Points:
-
Safety: Be cautious when using chmod. Incorrectly setting permissions can make files inaccessible or grant unintended access to others.
-
Best Practices: It's often good practice to restrict permissions on sensitive files like SSH keys (~/.ssh/id_rsa) to the owner only (using chmod 600).
-
Reference: You can use ls -l to view the current permissions of a file. The first character in the output represents the file type (e.g., - for a regular file, d for a directory), and the next nine characters represent the permissions (three sets of three characters for owner, group, and others).
Adding Paths to $PATH:
1. Using export:
**Adding a single path:
** export PATH=~/.npm-global/bin:$PATH
- This appends the directory ~/.npm-global/bin to the beginning of the $PATH variable.
**Adding multiple paths:
** export PATH=~/.local/bin:/usr/local/bin:$PATH
- This adds two paths, ~/.local/bin and /usr/local/bin, to the beginning of $PATH.
Important Notes:
-
Order matters: The order of paths in $PATH is significant. When you run a command, your shell searches for the executable in the directories listed in $PATH from left to right. Therefore, adding a path to the beginning (like we did above) ensures that it's checked first.
-
Temporary vs. Permanent: The export command only sets the $PATH variable for the current shell session. To make the change permanent, you'll need to add it to your shell's configuration file:
-
Bash: Add the export line to your .bashrc or .profile file.
-
Zsh: Add it to your .zshrc file.
2. Using eval and inline commands:
The eval command evaluates a string as a command. This is helpful for dynamically building path modifications. The author recommends against this as this could cause arbitrary code execution.
**Example:
** eval 'export PATH=$PATH:$(echo "/path/to/your/bin")'
-
- This line uses echo to generate the path string dynamically (good for variable-based paths).
-
It then uses eval to evaluate the entire string as a command, effectively adding the path to $PATH.
Common Questions
This chapter answers frequently asked questions related to CI/CD concepts covered in this book.
Okay, let's filter the questions relevant to a CI/CD book and group them into themes.
Filtering Rationale:
- Keep: Questions about CI/CD concepts, principles, practices, workflows, pipeline configuration (YAML, scripting), tool integrations (source control, build tools, testing tools, security tools, artifact repositories, deployment targets like servers, cloud services, K8s), environment management, secrets handling, deployment strategies, branching strategies, runner/agent configuration, troubleshooting common pipeline issues, security considerations within CI/CD, comparisons between tools/approaches.
- Discard: Questions specific to course logistics (links, notes, prerequisites, cost, presenter's tools/voice/personal info, comparison to other courses), overly specific debugging help tied to a video timestamp without generalizable principles, career advice, requests for unrelated tutorials (unless it's a direct CI/CD integration like Terraform/Ansible), feedback on presentation style, basic Git/tool usage outside the CI/CD context, platform account issues (like billing or validation).
Filtered & Relevant Questions (Duplicates Removed/Consolidated):
- (2) How can security testing tools be integrated into a CI/CD pipeline? (Incl. 104, 112, 138, 141, 151, 366, 375, 428, 706, 713)
- (3) How can source code be updated on a server without deleting dynamically generated data or folders?
- (4, 16) How can deployment scripts be made robust against failures (e.g., if a process to kill doesn't exist)? What are the concerns with specific triggering strategies like tags? (Incl. 9)
- (5) Is
git_strategy: clonenecessary in specific stages, or does the runner handle cloning automatically? - (6) How is security handled for runners connecting to the CI/CD server, especially regarding network access (e.g., open ports vs. VPN)?
- (7, 13, 14, 18, 19, 107, 139, 312, 367, 400, 407, 408, 413, 414, 418, 419, 422, 429, 431, 437, 462, 469, 471, 477, 481, 552, 555, 561, 567, 591, 598, 600, 602, 608, 616, 640, 651, 656, 664, 688, 699, 704, 712, 760, 791, 793, 795, 800, 808, 832, 839, 841, 843, 848, 856, 880, 887, 889, 891, 896, 904, 928, 935, 937, 939, 944, 952, 976, 983, 985, 987, 992, 1000, 1008, 1024, 1031, 1033, 1035, 1040, 1048, 1072, 1079, 1081, 1083, 1088, 1096, 1120, 1127, 1129, 1131, 1136, 1144, 1168, 1175, 1177, 1179, 1184, 1192, 1216, 1223, 1225, 1227, 1232) How should runner/agent permissions (sudo, file access, SSH keys) be configured correctly, and how are common permission/authentication errors ("permission denied", "auth fail", "Host key verification failed", "sudo: tty required", etc.) resolved across different CI/CD tools and target systems?
- (10, 60, 180, 192, 253, 255, 267, 269, 286, 353, 403, 711, 741, 786, 793, 801) How should configuration files (like
.env) and sensitive data (secrets, keys, connection strings) be managed securely across different environments (dev, test, prod) when they are not stored in the Git repository? - (17) How can configuration files on target servers (e.g., nginx config) be managed during deployment if direct editing via script is problematic?
- (20, 31, 592) How are dependencies (like JDK, Maven, curl, Gradle) managed or installed within the runner/agent execution environment if they aren't pre-installed?
- (25, 804) How should permissions and roles be configured in cloud providers (like AWS IAM) for CI/CD tools to interact with cloud services (like S3, EC2, ECR, Beanstalk, EKS)?
- (27) How do approval processes work in CI/CD, and where are approval comments/justifications typically tracked within the tools (e.g., GitLab protected environments)?
- (28, 82) How can artifact or source download failures (e.g., "Unable to download from S3") during deployment be diagnosed and resolved?
- (29, 95) How does the final release to production or customer servers typically happen after the main CI/CD pipeline stages? What does a real-time workflow look like, including approvals?
- (32) What is the optimal order for pipeline stages like unit testing and building? Should tests always run before builds?
- (34, 35, 186, 291, 299, 308, 310, 333, 457, 586, 635, 683, 827, 875, 923, 971, 1019, 1067, 1115, 1163) How should container lifecycle management (naming conflicts, cleanup, restarts) be handled within deployment scripts?
- (41) How can Docker build and push operations (e.g., to ECR) be combined within a single CI/CD job?
- (42) What is the correct syntax for conditional rules based on branch names (e.g.,
mainvs"main"), and should pipelines check for legacy branch names likemaster? - (43) Does a failed rule condition prevent the entire job script, including informational
echocommands, from executing? - (44, 773) How are authentication issues ('access denied', '403 Forbidden') resolved when pushing Docker images to registries (like Docker Hub or ECR) from a pipeline?
- (45, 51, 54, 56, 76, 111, 319, 321, 382) How can build failures due to missing files (e.g.,
package.json), dependency installation issues (yarn/npm), or version mismatches (Maven) be fixed within the CI/CD environment? - (46) Where do Docker image names used in pipelines typically originate or get defined?
- (48, 71, 106) How can integration test failures due to connection errors (
curlfailing to connect to localhost or services) or issues with testing SPAs be addressed in CI/CD? - (58, 77, 551, 813) How do different CI/CD tools (GitLab CI, GitHub Actions, Jenkins, Azure DevOps, AWS Code*) compare in terms of features, security models, or capabilities for specific deployment scenarios?
- (59, 417, 468, 551, 597, 646, 694, 742, 790, 838, 886, 934, 982, 1030, 1078, 1126, 1174, 1222) How can simultaneous deployment to multiple servers within the same environment be achieved using CI/CD pipelines and variables?
- (63, 271, 306, 752, 792) How can CI/CD pipelines be adapted to deploy different types of applications (e.g., REST API vs React app, .NET vs Python Flask, Node.js vs Angular, multi-component apps)? (Incl. 411, 421, 425, 429, 433, 437, 441, 445, 449, 453, 457, 461, 465, 469, 473)
- (64, 197, 420) How can YAML syntax errors in pipeline configuration files be identified and corrected, especially subtle ones like incorrect indentation or misspelled keywords?
- (67) What are the differences between various conditional execution keywords (e.g., GitLab's
rulesvsonly), and why might one be preferred over the other? - (70) Is it possible to deploy multi-container applications defined with Docker Compose using typical CI/CD approaches?
- (72, 519, 709) What are common strategies for versioning and tagging Docker images built within a CI/CD pipeline? Why might double-tagging be used?
- (74, 202) How are issues with runners/agents being unavailable or jobs getting stuck resolved?
- (78) Is it possible and advisable to programmatically create Git branches and add files within a CI/CD job script?
- (80, 81, 326, 327, 336, 338, 357, 596) How are errors related to the Docker daemon (connection refused, not found, socket issues, outdated libraries) handled within the runner/agent environment?
- (84) What is the difference between CI/CD tool-specific configuration reuse mechanisms (like GitLab's
extends) and standard YAML features like anchors? - (88, 177, 178, 217, 556, 557, 735) How are artifacts managed in CI/CD pipelines (creation, storage location, transfer between stages/jobs, cleanup, troubleshooting upload errors)?
- (92) Is a separate build stage always necessary, for instance, for Node.js applications? What determines the required stages?
- (94) How are credentials for external services (like Docker Hub) typically handled in pipelines? What information is needed for tool integrations like Trivy?
- (96) What is the purpose of limiting the number of builds kept or discarding old builds in CI/CD tools?
- (97) In the CI/CD process, where does code merging typically happen – during build or release management?
- (98, 105, 352, 734, 738, 802, 816) How can pipelines be designed to support different deployment strategies like blue/green, canary, or rolling updates, including rollbacks?
- (99, 100, 577, 679, 808) What is the scope of Continuous Integration (CI)? Does it typically include deploying to a test server and running automated functional/integration tests?
- (101, 644) Who is typically responsible for writing and ensuring the quality of test cases used in CI/CD pipelines? What is the role of QA with automated pipelines?
- (102, 240, 255, 365, 613, 614, 621, 624, 635, 636, 646, 724, 845, 893, 941, 989, 1037, 1085, 1133, 1181, 1229) How are pipelines structured and managed for multiple environments (e.g., Dev, QA, Staging, Prod), including promotion between them and handling infrastructure differences (like separate cloud accounts)?
- (103) How can scripts within CI/CD jobs be effectively written and explained, especially for complex tasks like updating Kubernetes deployment files?
- (108, 109) How do GitOps tools like ArgoCD integrate with other tools like Kustomize or handle writing updates back to Git repositories?
- (110) How can reusable logic from Jenkins Shared Libraries be migrated to custom actions in GitHub Actions?
- (113, 699) Is the CI/CD process fundamentally different for various programming languages and frameworks (e.g., .NET)?
- (117, 149, 300, 367, 523, 725, 812) How can Infrastructure as Code (IaC) tools like Terraform or configuration management tools like Ansible be integrated into CI/CD pipelines for provisioning or deployment? (Incl. 129, 153, 226, 356, 387, 395, 397, 398, 401, 402, 404, 412, 416, 425, 427, 431, 432, 434, 436, 470, 507, 559, 729, 745)
- (121) How can DevSecOps practices, including time-consuming security checks, be implemented effectively in fast-paced environments like startups without causing significant delays?
- (124) How does CI/CD work within specific platforms like ServiceNow DevOps?
- (125, 781, 369, 443, 746, 812, 404) How can database changes (migrations, schema updates, backups) be automatically included as part of a CI/CD deployment process?
- (128, 371, 733, 750, 811) How can observability (logging, metrics, tracing) be integrated into or leveraged by CI/CD pipelines?
- (143, 706) What is the recommended order for steps like Docker image building and security scanning (e.g., Trivy)? Should scanning happen before or after pushing to a registry?
- (170) Why run tests before merging a PR if the developer should have already pulled the latest changes from the target branch? What's the rationale?
- (174) How can CI/CD tools like GitHub Actions and Argo Workflows be used together effectively? What are the pros and cons?
- (175) What is the fundamental role of runners/agents in executing pipeline jobs? Why can't build/test be done "without tools"?
- (176) How can secrets or tokens like
GITHUB_TOKENbe securely shared or used across multiple repositories in a CI/CD setup? - (190, 564, 712) How can jobs within a single pipeline file be configured to run conditionally based on the trigger event (e.g., push to specific branch, merge request)?
- (196) What are multi-project and multi-branch pipelines, and how are they configured (e.g., in GitLab)?
- (198) What are secure methods for deploying from CI/CD systems (like GitLab) to cloud environments (like AWS) without storing sensitive credentials like private keys directly as variables?
- (203) How are GitLab runners registered or configured to interact with specific deployment targets or URLs (e.g., AWS resources)?
- (206) Why might a pipeline run correctly for the main branch but fail with "No stages/jobs" for other branches?
- (207) How can code quality analysis be integrated specifically for frameworks like Angular.js within GitLab CI/CD?
- (208, 700) Can CI/CD runners/agents be deployed and managed on Kubernetes clusters? How does this compare to other hosting options?
- (209) How does merge request validation work in GitLab CI/CD (triggering jobs, checking code)?
- (211) Where is the configuration that tells the CI/CD system (e.g., GitLab) to automatically trigger the pipeline YAML file on every commit?
- (212) Is it possible to run specific subsets of tests (similar to TestNG groups) within a Jenkins pipeline, and how?
- (213) How can Docker Hub pull rate limits encountered during CI builds be resolved or mitigated?
- (214) What strategies can be used to allow CI/CD pipelines on internal servers (with no outside access) to connect to external services like Sauce Labs?
- (215) Can a single YAML file define multiple jobs and tags? Where do script modifications (e.g., file changes) actually occur during job execution? What is the primary purpose of tags in triggering jobs via runners?
- (223) Can Python scripts be executed as part of a GitLab CI pipeline, and can these jobs be scheduled?
- (225) How can test tools like Newman be integrated into pipelines, and how can their results (e.g., HTML reports) be generated and accessed?
- (227) How can CI/CD pipelines be configured not to run on every single commit, but perhaps on specific triggers instead?
- (228) How should a
gitlab-ci.ymlfile be structured for a specific testing stack like WebdriverIO + Cucumber to run tests and generate reports? - (229) How can issues running shell scripts defined within a
.gitlab-ci.ymlfile be troubleshooted? - (230, 231) How can a CI/CD pipeline securely connect to a remote Linux server (e.g., via SSH) to execute deployment scripts?
- (233, 234) Can CI/CD jobs be scheduled to run at specific times? Is it possible to visually observe UI tests (e.g., Selenium) running within a CI/CD environment?
- (237) Does runner/agent registration need to happen on a specific server, or can it be done from a local machine? Where do the jobs actually execute?
- (238) What are the steps to install a GitLab runner on a Linux system (Bash environment)?
- (244) What are the pros and cons of using self-hosted runners/agents versus cloud-provided ones? What happens if a self-hosted agent machine fails?
- (245) How are environment variables and connection references managed when deploying to specific cloud environments (e.g., Azure managed environments) via pipelines?
- (251) How can a pipeline in one cloud platform (e.g., Azure Pipelines) be configured to deploy resources to another cloud (e.g., GCP)?
- (254, 781) Can CI/CD pipelines automatically trigger database migration scripts (e.g., Entity Framework migrations)?
- (256) How can deployment issues specific to platform-as-a-service offerings (like Azure App Service "run from package" mode) be resolved?
- (257) What does the term "releasing the artifact" mean in the context of CI/CD? Does it imply installation?
- (260, 272) How can limitations on hosted agent parallelism (e.g., in Azure DevOps free tier) be addressed?
- (261) What is the purpose of the "Environments" feature in CI/CD tools like Azure DevOps?
- (266) What is the significance of "Task version" in Azure Pipelines tasks?
- (273, 626, 627, 628, 633, 656) How can pipelines ensure the correct artifact version is promoted between environments (e.g., preventing a dev build from accidentally going to prod)? What is the "build once, deploy many" principle?
- (274) How can parameters, like target URLs for Selenium tests, be passed into Azure Pipelines dynamically instead of hardcoding them?
- (276, 277) Why might certain deployment steps (like enabling/disabling Synapse triggers) require manual intervention or scripting instead of being fully automated by built-in tasks?
- (278) What are the implications of running a deployment pipeline against branches other than the intended target branch (e.g., running a prod deploy pipeline on a feature branch)?
- (283, 344, 415) What are the differences between declarative and scripted pipeline syntaxes (e.g., in Jenkins), and when might each be preferred?
- (284) Can CI/CD orchestrators like Jenkins be considered "orchestrators" in the broader sense? What is their primary role?
- (285, 694) How is integration between CI/CD tools (like Jenkins) and SCM platforms (like GitHub or Bitbucket) configured?
- (287) How can mobile application builds (e.g., creating Android APKs) be automated within a CI/CD pipeline, including handling signing keys? (Incl. 377, 736)
- (293, 295, 334, 339, 365) What are the advantages and disadvantages of running CI/CD tools like Jenkins within Docker containers versus installing them directly on the operating system?
- (305) To what extent can complex CI/CD workflows be managed entirely through GUI configurations versus requiring pipeline-as-code scripting?
- (313) How can webhook integration issues (e.g., GitHub webhook not triggering Jenkins) be troubleshooted?
- (317) How can Jenkins pipelines (especially freestyle jobs) be configured to handle concurrent builds triggered by rapid commits (e.g., automatically aborting older builds)?
- (318) What steps are involved in deploying a web application (e.g., Node/React) to a cloud server (like EC2) and making it publicly accessible?
- (345) In Docker-based agent setups, if a container environment is provided, why might the agent definition still require specifying a Docker image?
- (347) Where do Jenkins agents obtain the necessary compute resources (CPU, memory) to execute jobs?
- (351) How can a Docker agent running on a local machine establish a connection to a Jenkins master running on a remote server?
- (352) How can missing dependencies (like python3) be installed or made available inside a Jenkins container or agent environment?
- (357) If using Docker agents or Docker-in-Docker setups, why might Docker commands fail with "docker not found" within a job script? How should the environment be configured?
- (364, 440, 447, 497, 498, 569, 618, 625, 666, 673, 714, 721, 810, 817, 858, 865, 906, 913, 954, 961, 1002, 1009, 1050, 1057, 1098, 1105, 1146, 1153, 1194, 1201) How are "artifact not found" errors (e.g., "No wars found" during deployment) diagnosed when the build process seems successful?
- (373, 504, 507, 512, 518, 523, 527, 528, 531) How are Java version incompatibility errors resolved when integrating tools like SonarQube scanner into a pipeline?
- (374) How can a Jenkins container access or interact with the Docker daemon running on the host machine?
- (379, 505, 529) Is it feasible or advisable to install and run multiple CI/CD components (Jenkins, SonarQube, Nexus, Docker) on a single server/EC2 instance? What are the trade-offs?
- (442, 571, 620, 668, 716, 764, 812, 860, 908, 956, 1004, 1052, 1100, 1148, 1196) How do pipelines need to be adapted if the build artifact is a JAR file instead of a WAR file?
- (445, 451, 476, 574, 579, 580, 623, 628, 629, 671, 676, 677, 719, 724, 725, 767, 772, 773, 815, 820, 821, 863, 868, 869, 911, 916, 917, 959, 964, 965, 1007, 1012, 1013, 1055, 1060, 1061, 1103, 1108, 1109, 1151, 1156, 1157, 1199, 1204, 1205) What are common reasons for deployment failures where the artifact (e.g., WAR file) doesn't appear on the target server (e.g., Tomcat webapps), even if the CI job reports success? (Incl. 474)
- (446, 452, 496, 575, 581, 624, 630, 672, 678, 720, 726, 768, 774, 816, 822, 864, 870, 912, 918, 960, 966, 1008, 1014, 1056, 1062, 1104, 1110, 1152, 1158, 1200, 1206) How are "Failed to connect to repository" errors resolved when configuring SCM integration in Jenkins?
- (449, 578, 627, 675, 723, 771, 819, 867, 915, 963, 1011, 1059, 1107, 1155, 1203) Does polling SCM trigger builds based only on detected changes, or does it trigger periodically regardless?
- (452(1), 581(1), ...) Why might standard project types (like 'Maven project') be missing in the Jenkins UI, and how can this be addressed?
- (455, 584, 633, 681, 729, 777, 825, 873, 921, 969, 1017, 1065, 1113, 1161, 1209) What are the typical steps involved in deploying a WAR file artifact to a Tomcat server using a CI/CD pipeline?
- (460, 589, 638, 686, 734, 782, 830, 878, 926, 974, 1022, 1070, 1118, 1166, 1214) When using polling triggers across multiple repositories, how can a CI/CD job determine which specific repository change initiated the build?
- (464, 593, 642, 690, 738, 786, 834, 882, 930, 978, 1026, 1074, 1122, 1170, 1218) How can build parameters (e.g., choice parameters) be defined and used within CI/CD pipelines?
- (467, 596, 645, 693, 741, 789, 837, 885, 933, 981, 1029, 1077, 1125, 1173, 1221) How can issues where artifacts are not updated on target servers (like Ansible nodes) after successful builds be investigated?
- (475) How are database deployments handled in real-world CI/CD pipelines? Are application servers like Tomcat commonly used for Java projects?
- (489) What are the considerations when choosing between local development tools like Minikube versus cloud-based container registries like ACR/ECR for pipeline integration?
- (496, 501, 516, 517, 525, 526) How are issues with SonarQube integration (pending quality gates, server unreachable, scanner errors) troubleshooted?
- (508, 519) Is it possible to replicate cloud-based CI/CD setups using local virtualization tools like VirtualBox? What are the challenges?
- (514) How can the IP address of a local Docker server be determined and used for configuring CI/CD tool connections (e.g., Jenkins server list)?
- (524) What are the trade-offs between using a comprehensive tool like AWS CodePipeline versus composing a pipeline primarily within a build tool like CodeBuild?
- (530) How can CI/CD pipelines help manage the risks associated with automated dependency updates (vulnerabilities, breaking changes)?
- (534) What are the key differences between serverless deployment frameworks like AWS CDK and SAM?
- (535, 714, 803) How are rollbacks typically implemented or handled within CI/CD pipelines (e.g., AWS CodePipeline)?
- (539, 540) What is a self-updating pipeline, and why might this pattern be used?
- (541) How can AWS CodePipeline be configured to trigger based on pull requests in CodeCommit?
- (542) What is the rationale behind naming pipeline stages (e.g., why 'Commit' instead of 'Build Image')?
- (543, 544, 778) How are integration tests incorporated into CI/CD? What tools are used, and do they typically interact with real downstream services?
- (545) Can CI/CD pipelines be designed to dynamically target different source code repositories?
- (547) If deploying to Kubernetes (AKS), how are build artifacts (e.g., Docker images) consumed or referenced in the deployment process?
- (566) Is using includes or templates to structure pipeline configuration (e.g., GitLab
include) considered an anti-pattern? What are the best practices? - (568) How can audit trails for CI/CD processes be maintained and reviewed? What tools support this?
- (571) What does the concept "codebase changing under our feet" refer to in the context of branching strategies?
- (572) What are the benefits of implementing CI/CD even for a solo developer?
- (574) Are there alternatives to Jenkins for building code within a pipeline? What factors influence tool selection?
- (575) Can someone explain the typical flow of a build pipeline?
- (576, 807) How is the connection configured for a CI/CD tool (like Jenkins) to fetch code from an SCM (like GitHub or Bitbucket)?
- (588, 707) How should build specifications (like
buildspec.yml) be structured when dealing with multiple microservices or components within a single repository? - (593) Why might Kubernetes manifests (
deployment.yaml) be stored within the application's source code repository? - (594, 363, 411) How can pipelines be integrated with artifact repositories like JFrog Artifactory or Nexus?
- (597) How can SSH keys stored in a CI/CD tool (like TeamCity) be used securely within command-line build steps, especially if they require passphrases?
- (598) What are the trade-offs between defining build steps within the CI/CD tool configuration versus embedding them directly in a Dockerfile?
- (599) What are the alternatives if the Docker socket cannot be mounted into agents (e.g., due to using containerd)?
- (600) Is a dedicated server required for CI/CD tools like TeamCity, or can they run on developer machines?
- (604) Can Kubernetes clusters (AKS/EKS) be registered as deployment targets in TeamCity similarly to how Docker registries are added?
- (610) How does a GitOps tool like ArgoCD handle situations where other tools (like the Jenkins Kubernetes plugin) dynamically create resources within the cluster?
- (611) How can a CI/CD job (e.g., in Jenkins) securely perform a
git pushback to the repository, for instance, to update Kubernetes manifests for GitOps? - (612) For complex branching models, what's the best way to configure Jenkins to run pre-commit checks triggered by pull requests?
- (617) Can Jenkins multibranch pipelines be effectively used for managing deployments across multiple environments (dev, QA, prod)?
- (618, 739) How can pipeline definitions be reused across different branches (e.g., promoting from feature to release) or templated?
- (619) In typical enterprise setups, is there usually one monolithic pipeline or multiple, separate pipelines for different environments or applications?
- (620) Does GitLab CI restrict workflows to a single
.gitlab-ci.ymlfile, and how does this impact controlling complex multi-environment workflows? - (629) Should CI/CD pipelines trigger on every commit, or typically after merge/pull requests are completed?
- (630) How can branching and deployment strategies be adapted for platforms like Azure App Service where creating ephemeral environments per feature branch isn't feasible?
- (631) Can the creation of environment-specific branches (like
release/qa,release/prod) be automated as part of the CI/CD workflow? - (632) Is it necessary or common practice to have different Jenkinsfile configurations for each deployment stage/environment?
- (634) If automation stops at pre-production, what are the common manual or semi-automated processes for promoting a build to production?
- (639, 722) How are manual approvals integrated into CI/CD pipelines before critical deployments (e.g., to production)?
- (645) How does the Quality Assurance (QA) process integrate into the software development lifecycle when CI/CD pipelines automate deployment, potentially directly to production?
- (647, 648, 654) What is the standard process for handling hotfixes in a multi-environment CI/CD setup? Which branches are involved, and where is testing performed?
- (650, 651) Where are GitOps tools like ArgoCD typically deployed in a real-world architecture (e.g., dedicated cluster, same cluster)? How do they interact with target clusters?
- (653) Is the promotion process between environments (dev -> stage -> prod) typically manual (via merge requests) or fully automated within the pipeline?
- (655) Who is responsible for merging code between different environment branches (Developers or DevOps engineers)? What merge strategies (fast-forward, three-way) are typically used?
- (657-678) What are the core principles, benefits, challenges, and practical considerations of Trunk-Based Development (TBD) compared to long-lived feature branches, especially regarding CI/CD integration, testing, code reviews, rollouts, and handling complex changes?
- (681) How can GitHub Actions be used to deploy a Flask application to a traditional VPS server?
- (682) Can GitHub Actions execute Selenium tests written with Pytest?
- (692) How can CI/CD pipelines be configured for C++ projects, especially on Windows/Mac with complex third-party dependencies like Boost and Qt?
- (697) When reusing CI/CD infrastructure (like servers) for multiple projects, how can pipelines accommodate varying requirements (e.g., different sets of checks) per project?
- (698) What is the distinction between master and worker/agent nodes in Jenkins architecture?
- (701) What are GitHub Actions conceptually?
- (702) How is the correct YAML file identified or specified for a GitHub Actions workflow?
- (705) How can pipelines be configured to interact with private container registries?
- (708) How can Docker image signing be incorporated into a GitHub Actions pipeline for enhanced security?
- (710) How can GitHub Actions be used to deploy built container images to a Kubernetes cluster?
- (716) How can data or variables be passed between different jobs within a single GitHub Actions workflow?
- (717) How can GitHub Actions jobs be configured to run conditionally based on the success or failure of preceding jobs?
- (719) What are "contexts" in GitHub Actions, and how are they used?
- (720, 771) How are self-hosted runners set up and used with GitHub Actions, and what configuration changes are needed compared to using GitHub-hosted runners?
- (723) What are "expressions" in GitHub Actions, and how are they used for dynamic configuration or conditional logic?
- (727) What is the purpose of caching in GitHub Actions, and how can it be used to optimize pipeline performance?
- (743) What is the "matrix strategy" in GitHub Actions, and how does it facilitate running jobs across multiple configurations?
- (747) What are the key elements and syntax rules of the GitHub Actions workflow YAML file?
- (751) What are the known limitations or constraints of the GitHub Actions platform?
- (755) What are the best practices for designing and maintaining robust and efficient GitHub Actions workflows?
- (758) How can GitHub Actions pipelines be visually monitored or understood (similar to Jenkins Blue Ocean)?
- (766, 412) How can automated rollback mechanisms be implemented in GitHub Actions pipelines?
- (770) How can GitHub Actions be leveraged to build internal developer platforms or platform engineering capabilities?
- (784) Is a load balancer typically required when deploying applications via CI/CD, for example, to ECS?
- (791) How is the database component typically handled during application deployment via CI/CD (e.g., schema migrations, initial setup)?
- (796) What are the differences between Elastic Container Service (ECS) and Elastic Kubernetes Service (EKS) on AWS, and what factors guide the choice between them?
- (806) What are the best practices for securing container registries like AWS ECR?
- (814) What are common techniques and tools for debugging failing CI/CD pipelines, especially during deployment stages?
- (815) What are the advantages and disadvantages of using Fargate versus EC2 launch types when running containers on ECS?
- (819) How can CI/CD pipelines be designed to handle the deployment of complex microservices architectures (e.g., to ECS)?
- (820) What are common mistakes or pitfalls to avoid when setting up CI/CD pipelines targeting platforms like ECS?
Themed Groups (Max 10 Questions per Theme):
Theme 1: How should CI/CD pipeline structure, stages, and triggers be designed and optimized?
- (32) What is the optimal order for pipeline stages like unit testing and building? Should tests always run before builds?
- (92) Is a separate build stage always necessary, for instance, for Node.js applications? What determines the required stages?
- (97) In the CI/CD process, where does code merging typically happen – during build or release management?
- (143, 706) What is the recommended order for steps like Docker image building and security scanning (e.g., Trivy)? Should scanning happen before or after pushing to a registry?
- (211) Where is the configuration that tells the CI/CD system (e.g., GitLab) to automatically trigger the pipeline YAML file on every commit?
- (227) How can CI/CD pipelines be configured not to run on every single commit, but perhaps on specific triggers instead?
- (449, 578, ...) Does polling SCM trigger builds based only on detected changes, or does it trigger periodically regardless?
- (520) Why might a pipeline be structured with deployment steps within a build stage rather than a separate deploy stage?
- (541) How can AWS CodePipeline be configured to trigger based on pull requests in CodeCommit?
- (629) Should CI/CD pipelines trigger on every commit, or typically after merge/pull requests are completed?
Theme 2: How should configuration, secrets, and environment variables be managed securely across different deployment environments?
- (10, 60, 192, ...) How should configuration files (like
.env) and sensitive data (secrets, keys, connection strings) be managed securely across different environments (dev, test, prod) when they are not stored in the Git repository? - (17) How can configuration files on target servers (e.g., nginx config) be managed during deployment if direct editing via script is problematic?
- (245) How are environment variables and connection references managed when deploying to specific cloud environments (e.g., Azure managed environments) via pipelines?
- (274) How can parameters, like target URLs for Selenium tests, be passed into Azure Pipelines dynamically instead of hardcoding them?
- (176) How can secrets or tokens like
GITHUB_TOKENbe securely shared or used across multiple repositories in a CI/CD setup? - (198) What are secure methods for deploying from CI/CD systems (like GitLab) to cloud environments (like AWS) without storing sensitive credentials like private keys directly as variables?
- (525) How is authentication handled between ECR and the deployment yaml file when pulling the image?
- (711, 353, 403, ...) How are secrets managed within pipelines (e.g., GitHub Actions secrets, Jenkins credentials, Vault integration)?
- (786) How can environment variables be injected based on the deployment environment (dev/staging/prod) when deploying to platforms like ECS?
- (801) How can different configurations for different environments be managed effectively in a CI/CD workflow?
Theme 3: How can runners/agents be configured, secured, and managed effectively, and how are execution environment issues resolved?
- (7, 13, 14, 18, ...) How should runner/agent permissions (sudo, file access, SSH keys) be configured correctly, and how are common permission/authentication errors resolved?
- (20, 31, 592) How are dependencies (like JDK, Maven, curl, Gradle) managed or installed within the runner/agent execution environment if they aren't pre-installed?
- (74, 202) How are issues with runners/agents being unavailable or jobs getting stuck resolved?
- (80, 81, 326, ...) How are errors related to the Docker daemon (connection refused, not found, socket issues) handled within the runner/agent environment?
- (208, 700) Can CI/CD runners/agents be deployed and managed on Kubernetes clusters? What are the benefits?
- (237) Does runner/agent registration need to happen on a specific server? Where do the jobs actually execute?
- (244) What are the pros and cons of using self-hosted runners/agents versus cloud-provided ones, including failure scenarios?
- (345) In Docker-based agent setups, if a container environment is provided, why might the agent definition still require specifying a Docker image?
- (351) How can a Docker agent running on a local machine establish a connection to a Jenkins master running on a remote server?
- (599) What are the alternatives if the Docker socket cannot be mounted into agents (e.g., due to using containerd)?
Theme 4: What are effective strategies for testing (unit, integration, security, quality) within CI/CD pipelines?
- (2) How can security testing tools be integrated into a CI/CD pipeline? (Incl. 104, 112, ...)
- (48, 71, 106) How can integration test failures due to connection errors or issues with testing SPAs be addressed in CI/CD?
- (99, 100, 577) What is the scope of Continuous Integration (CI)? Does it typically include running automated functional/integration tests?
- (101, 644) Who is typically responsible for writing and ensuring the quality of test cases used in CI/CD pipelines?
- (212) Is it possible to run specific subsets of tests (similar to TestNG groups) within a Jenkins pipeline, and how?
- (225) How can API test tools like Newman be integrated into pipelines, and how can their results be generated and accessed?
- (228) How should a pipeline configuration file be structured for a specific testing stack like WebdriverIO + Cucumber to run tests and generate reports?
- (496, 501, ...) How are issues with SonarQube integration (pending quality gates, server unreachable, scanner errors) troubleshooted?
- (543, 544, 778) How are integration tests incorporated into CI/CD? What tools are used, and do they typically interact with real downstream services?
- (679, 285) Can writing comprehensive tests be challenging for complex applications, and how does this impact CI effectiveness?
Theme 5: How should artifacts and versioning be handled throughout the CI/CD lifecycle?
- (28, 82) How can artifact or source download failures (e.g., "Unable to download from S3") during deployment be diagnosed and resolved?
- (46) Where do Docker image names used in pipelines typically originate or get defined?
- (72, 519, 709) What are common strategies for versioning and tagging Docker images built within a CI/CD pipeline? Why might double-tagging be used?
- (88, 177, 178, ...) How are artifacts managed in CI/CD pipelines (creation, storage location, transfer between stages/jobs, cleanup, troubleshooting upload errors)?
- (257) What does the term "releasing the artifact" mean in the context of CI/CD? Does it imply installation?
- (364, 440, 447, ...) How are "artifact not found" errors (e.g., "No wars found" during deployment) diagnosed when the build process seems successful?
- (416) If artifacts or configuration files disappear from the Jenkins workspace, what are alternative persistent storage strategies?
- (421, 427, 438, ...) How are artifacts reliably transferred between different servers or stages in a multi-step pipeline (e.g., Jenkins to Ansible)?
- (442, 571, ...) How do pipelines need to be adapted if the build artifact is a JAR file instead of a WAR file?
- (547) If deploying to Kubernetes (AKS), how are build artifacts (e.g., Docker images) consumed or referenced in the deployment process?
Theme 6: What are effective deployment strategies, including handling multiple environments, rollbacks, and specific target platforms?
- (3) How can source code be updated on a server without deleting dynamically generated data or folders?
- (29, 95) How does the final release to production or customer servers typically happen after the main CI/CD pipeline stages?
- (59, 417, 468, ...) How can simultaneous deployment to multiple servers within the same environment be achieved?
- (63, 271, 306, ...) How can CI/CD pipelines be adapted to deploy different types of applications or to different targets (e.g., REST API vs React, .NET vs Python, Tomcat vs Apache, K8s vs ECS vs VPS)? (Incl. 287, 318, 372, 388, 391, 411, ...)
- (98, 105, 352, ...) How can pipelines support different deployment strategies like blue/green, canary, rolling updates, A/B testing, and zero-downtime?
- (102, 240, 255, ...) How are pipelines structured and managed for multiple environments (Dev, QA, Staging, Prod), including promotion and handling infrastructure differences?
- (125, 781, 369, ...) How can database changes (migrations, schema updates) be automatically included as part of a CI/CD deployment process?
- (401) How can deployment scripts orchestrate application server lifecycle events (e.g., stop/start Tomcat)?
- (535, 714, 803, ...) How are rollbacks typically implemented or handled within CI/CD pipelines?
- (634) If automation stops at pre-production, what are the common processes for promoting a build to production?
Theme 7: What branching strategies work well with CI/CD, and how are workflows like pull requests and hotfixes handled?
- (4) What are the concerns with specific triggering strategies like tags versus branch commits?
- (107) How can automated updates to deployment configuration (e.g.,
deployment.yaml) work correctly if the target branch is protected? - (170) Why run tests before merging a PR if the developer should have already pulled the latest changes?
- (190, 564, 712) How can jobs within a single pipeline file be configured to run conditionally based on the trigger event (e.g., push to specific branch, merge request)?
- (206) Why might a pipeline run correctly for the main branch but fail with "No stages/jobs" for other branches?
- (209) How does merge request validation work in CI/CD (triggering jobs, checking code)?
- (278) What are the implications of running a deployment pipeline against branches other than the intended target branch?
- (616, 647, 648, 654) What is the standard process for handling hotfixes in a multi-environment CI/CD setup, including branching and testing?
- (655) Who is responsible for merging code between different environment branches (Developers or DevOps engineers)? What merge strategies are typically used?
- (657-678) What are the principles and trade-offs of Trunk-Based Development versus feature branching in a CI/CD context?
Theme 8: How can Infrastructure as Code (IaC) and configuration management tools be integrated into CI/CD pipelines?
- (117, 149, 300, ...) How can Infrastructure as Code (IaC) tools like Terraform or configuration management tools like Ansible/Chef/Puppet be integrated into CI/CD pipelines? (Incl. 129, 153, 226, ...)
- (395, 402) What are the specific advantages of using tools like Ansible for deployment tasks within a pipeline compared to simpler scripting?
- (397) How can CI/CD tools (like Jenkins) orchestrate configuration management tools (like Ansible) when they run on separate servers?
- (404, 563) How does Ansible typically perform deployment after receiving an artifact from Jenkins? Does it require further orchestration?
- (425) When using Ansible for multi-environment deployments, what are the strategies for managing environment-specific configurations (e.g., multiple playbooks vs. dynamic inventories/variables)?
- (559) How can the setup of configuration management tools like Ansible be automated, especially for large numbers of target servers?
- (725, 367) How is Terraform integrated with CI/CD tools like GitHub Actions or Jenkins?
- (782) When integrating IaC, should tools like Terraform be applied during the deployment phase or as a separate preceding/following step?
- (812) Can IaC tools like Terraform or CloudFormation be used to provision the necessary infrastructure before the application deployment pipeline runs?
- (432, 611, ...) How can tools like Ansible be used to manage Windows nodes from a Linux-based control machine within a pipeline?
Theme 9: What are common CI/CD pipeline errors and troubleshooting techniques?
- (45, 51, 54, ...) How can build failures due to missing files, dependency installation issues (yarn/npm), or version mismatches be fixed?
- (48, 71, 106) How can integration test failures due to connection errors (
curlfailing to connect) be addressed? - (213) How can Docker Hub pull rate limits encountered during CI builds be resolved or mitigated?
- (217) How are artifact upload failures (like 504 Gateway Timeout) typically troubleshooted?
- (313) How can webhook integration issues (e.g., GitHub webhook not triggering Jenkins) be troubleshooted?
- (373, 504, 507, ...) How are Java version incompatibility errors resolved when integrating tools like SonarQube scanner?
- (424, 603, 652, ...) How are SSH connection timeout errors diagnosed and fixed?
- (430, 609, 657, ...) How can complex, multi-part pipeline failures (e.g., hostname resolution + file transfer + script execution errors) be broken down and debugged?
- (446, 452, 496, ...) How are "Failed to connect to repository" errors resolved when configuring SCM integration?
- (814) What are general techniques and tools for debugging failing CI/CD pipelines?
Theme 10: How do different CI/CD tools and platforms compare, and how are they integrated with other ecosystem tools?
- (58, 77, 551, ...) How do different CI/CD tools (GitLab CI, GitHub Actions, Jenkins, Azure DevOps, AWS Code*, Bamboo) compare in terms of features, security, or capabilities? (Incl. 608, 688, 696, 813)
- (108, 109, 610, ...) How do GitOps tools like ArgoCD integrate with other tools like Kustomize or handle updates back to Git?
- (174) How can CI/CD tools like GitHub Actions and Argo Workflows be used together effectively?
- (239, 390, 549) How can different CI/CD platforms be integrated (e.g., listing GitLab repo files in Jenkins)?
- (251) How can a pipeline in one cloud platform (e.g., Azure Pipelines) be configured to deploy resources to another cloud (e.g., GCP)?
- (285, 694) How is integration between CI/CD tools (like Jenkins) and SCM platforms (like GitHub or Bitbucket) configured?
- (389, 443, 572, ...) How is authentication configured for CI/CD tools to interact securely with cloud providers (AWS, Azure, GCP)?
- (594, 363, 411) How can pipelines be integrated with artifact repositories like JFrog Artifactory or Nexus?
- (721, 359, 399) How can CI/CD pipelines integrate with issue tracking tools like Jira?
- (726, 348, 391, ...) How can pipelines integrate with notification tools like Slack or email?
Okay, here is a refined list of questions about GitHub Actions, grouped by low-level concepts suitable for a beginner's guide. The questions have been made more uniform in tone, as if asked by a single learner seeking clarification.
1. Fundamentals & Core Concepts
_ How do I enable or find the Actions tab in my GitHub repository or account settings?
_ What is the required naming convention and location for workflow files (e.g., .yml files) within the .github directory?
_ What are the prerequisites, like knowledge of YAML, needed to start writing GitHub Actions workflows?
_ What are the core concepts of GitHub Actions, including workflows, jobs, steps, and actions themselves?
_ Where do GitHub Actions workflows actually execute? Is it on GitHub servers, AWS, or somewhere else?
_ What is the significance of hyphens (-) and indentation in the Actions YAML syntax? How does it differentiate uses from run steps?
_ What does the github.action_path context variable represent within a workflow?
_ Is the actions/checkout@v2 step always necessary at the beginning of a job, or are there cases where it can be omitted?
_ Can you clarify the difference between a GitHub Actions "workflow" and an "action"?
_ What defines a "CI/CD pipeline" in the context of GitHub Actions, versus just a simple workflow?
2. Workflow Triggers & Events (on: keyword)
_ Do workflows triggered by push events run if the push originates from a local merge without a corresponding Pull Request on GitHub?
_ Can a workflow be automatically triggered when a new repository is created within an organization?
_ How can a workflow_dispatch event trigger a workflow definition that only exists on a non-default branch?
_ Is it possible to configure a workflow to trigger both on push and manually via workflow_dispatch?
_ Can the ability to manually trigger a workflow_dispatch event be restricted to specific users or roles?
_ Do input parameters with default values defined for workflow_dispatch get used when the workflow is triggered by other events like push?
_ How can an external event, like a successful Vercel deployment, trigger a GitHub Actions workflow (perhaps using repository_dispatch)?
_ How can a workflow run be manually initiated from the GitHub UI or API?
_ How can workflow triggers be configured to run only when specific file paths are modified, or to ignore changes in certain paths?
_ What are common reasons a workflow might not trigger after a push event, even if the YAML file seems correct?
_ Can scheduled workflows (on: schedule) bypass branch protection rules that require approvals?
_ How can I ensure workflow triggers (like push) aren't overly sensitive and run only for relevant code changes, not just dependency updates or minor file changes?
3. Workflow Syntax, Structure & Logic (Jobs, Steps, Conditionals, Versions)
_ How can I pass data or variables between different jobs in the same workflow?
_ How can I pass data between different steps within the same job?
_ What is the recommended order for build and test steps in a CI workflow?
_ How does GitHub Actions handle file paths? If a step fails because it can't find a file (like pom.xml), what should I check?
_ Is step X (e.g., AWS credential setup in a deploy job) necessary when doing Y (e.g., deploying via kubeconfig)? How can I determine required steps?
_ What are action versions (e.g., @v2, @master, @2.0.0)? What is the impact of using different version types, and which is recommended?
_ How frequently do steps like npm install run? Does it happen on every single commit?
_ How can I implement conditional logic in a workflow (e.g., run a step only if a previous step failed, or based on branch name)?
_ How can a workflow job be configured to fail based on the results of an external tool (like SonarQube or Trivy)?
_ If a workflow file has multiple jobs defined, in what order do they execute? How can I control the execution order?
_ What are the different input types available for workflow_dispatch (e.g., dropdowns, multi-select)?
_ How does input validation work for workflow_dispatch triggers (e.g., enforcing required: true)?
_ Is it possible to have workflow_dispatch inputs that change dynamically based on previous selections?
_ What does if: always() mean in a step condition, and when should it be used?
4. Reusable Workflows & Composite Actions _ How are secrets handled or accessed within reusable workflows? Do they inherit from the caller? _ What is the difference between a composite action and a reusable workflow? When should I use each? _ How can I execute a script located within the repository of a reusable workflow or composite action itself? _ How can I reference a composite action that is defined within the same repository as the calling workflow? _ What is the mechanism for passing output data from one composite action step to be used as input for a subsequent composite action step? _ What permissions are needed to use a composite action or reusable workflow defined in a different repository within the same organization? _ Are composite actions and reusable workflows available for private repositories on all paid plans, or only Enterprise? _ How do composite actions and reusable workflows interact when nested (e.g., a reusable workflow using a composite action)? What are common pitfalls, like checkout path issues?
5. Runners & Execution Environments (GitHub-Hosted, Self-Hosted, ARC)
_ How can I troubleshoot connectivity between a self-hosted runner and services on my local network or private cloud?
_ What network protocols and ports are required for a self-hosted runner to communicate with GitHub.com or GitHub Enterprise Server?
_ How are self-hosted runner registration tokens managed, do they expire, and how can runners maintain long-term registration?
_ Do jobs run on self-hosted runners consume included GitHub Actions minutes?
_ How can multiple jobs be run in parallel on a single self-hosted runner machine? What are the configuration options?
_ Why might a self-hosted runner process fail to access OS environment variables?
_ What should I check if jobs are stuck 'Waiting for a runner' even when self-hosted or organization runners seem available?
_ How can I view the labels assigned to a specific self-hosted runner?
_ What steps are needed to troubleshoot and bring an offline self-hosted runner back online?
_ Is it possible to install and run multiple self-hosted runner instances on the same machine?
_ Can a single self-hosted runner instance serve multiple repositories?
_ What is the process for setting up and running a self-hosted runner inside a Docker container?
_ How can a self-hosted runner be configured on a shared machine for multiple users or teams?
_ How can I ensure a self-hosted runner remains available (e.g., run as a service)?
_ If multiple runners share the same label, how does Actions select an available one?
_ Can a GitHub-hosted runner execute scripts that interact directly with my local machine?
_ Where are GitHub-hosted runners (like ubuntu-latest) physically hosted?
_ How can I handle sudo prompts or grant passwordless sudo access on a macOS self-hosted runner?
_ Does the runs-on OS need to exactly match the self-hosted runner's OS?
_ For Action Runner Controller (ARC), how can I persist caches or state between jobs in the same workflow, given that pods might be recreated?
_ What are the networking requirements and setup steps for ARC on an on-premises, air-gapped Kubernetes cluster?
_ What is the difference between DeploymentRunner with HPA and RunnerScaleSet in ARC? Which is preferred?
_ How can runner image names be passed dynamically during ARC Helm installation?
_ What is the recommended process for upgrading ARC, especially regarding CRDs?
_ How can ARC runners be configured to use Kubernetes Managed Identity (like Azure Workload Identity or GKE WIF) to access cloud resources?
_ Can Docker builds be performed reliably on ARC runners deployed to AWS Fargate?
_ What versions of GitHub Enterprise Server (GHES) are compatible with ARC?
_ How can I customize the runner image used by ARC, for example, to use RHEL or add specific tools?
_ How can I use Kaniko to build container images within ARC runners running in Kubernetes mode?
_ Does ARC support running runners on AKS virtual nodes?
_ Are Windows container images supported as runners in ARC?
_ Are there working examples available for non-trivial ARC setups, particularly involving Docker builds or volume mounts?
_ How can I monitor ARC components (controller, scale sets, runners) and gather metrics?
_ What are common strategies for optimizing the performance of ARC self-hosted runners?
_ Can ARC be configured to manage runners on VMs (e.g., via KubeVirt) instead of pods?
_ Is cert-manager required for setting up ARC? * How can I troubleshoot communication issues when the ARC controller and runner scale sets are deployed in different Kubernetes namespaces?
6. Secrets, Variables, Authentication & Permissions _ Can secrets defined at different levels (repository, environment, organization) have the same name, and how are they prioritized? _ What is the best practice for managing sensitive credentials needed by a workflow in a public repository? _ What is the scope of an environment deployment approval? Does approving one job affect others targeting the same environment? _ Can email notifications for required deployment reviews be disabled? _ Are GitHub Actions Environments available for private repositories on standard paid plans? _ How can environment variables needed by the application code or tests be securely passed into a workflow?
- How are repository/organization variables (not secrets) accessed in a workflow YAML?
- What is the mechanism for passing output data between composite action steps?
_ When using a reusable workflow, does
GITHUB_TOKENinherit permissions from the caller or the definition repository? _ What are secure methods for cloning a different private repository within a workflow, besides PATs (e.g., GitHub Apps, deploy keys)? _ What could cause a 'Could not read password' error when using tokens? _ How can I securely pass secrets (like database connection strings or API keys) stored in GitHub Secrets into the deployed application or environment? _ How can secrets from external vaults (like HashiCorp Vault or AWS Parameter Store) be securely fetched and used within a workflow? _ How should OIDC be configured for repositories within an organization versus personal repositories? _ Is it necessary to store deployment target details like server IPs as secrets? _ How can I store multi-line secrets or files (like.pemkeys or.mobileprovisionfiles) as GitHub Secrets, especially considering potential size limits? * How can I decrypt a password or use a SALT value stored as a secret within a workflow step?
7. Artifacts & Caching
_ How can build artifacts from one job be used in a subsequent job?
_ Is there a way to check the size of a build artifact within a workflow?
_ How does the upload-artifact action work regarding file paths and storage?
_ What are the options for managing artifact storage when the quota is hit?
_ Can I get a direct downloadable link to an uploaded artifact?
_ Is it possible to manually delete artifacts before the default retention period?
_ What is the default artifact retention policy, and can it be configured?
_ How does actions/cache determine cache validity (invalidation)?
_ Is the cache shared between different self-hosted runners in a pool?
_ Are there costs associated with using actions/cache, especially storage for private/Enterprise repos?
_ What is the scope of a cache? Is it shared across PRs?
_ How does actions/cache compare to the built-in caching of actions like setup-node?
_ How can a cache created in one job be restored in a different job within the same workflow run?
_ Can Docker images or layers be cached using actions/cache?
_ Can actions/cache handle very large cache sizes (tens of GBs)?
_ Is it possible/recommended to cache apt package downloads? * Can the cache key for actions/cache be dynamically generated?
8. Testing & Code Quality Integration
_ How can I ensure the integrity of tests run in Actions? Can steps be skipped or results falsified?
_ What are common reasons for test commands (like npm test) to hang indefinitely in an Actions job?
_ How do Actions workflows handle new code that lacks corresponding tests? Does it impact required checks?
_ How can I troubleshoot errors where tests (like Nightwatch) fail to connect to localhost services started within the workflow?
_ Can Actions facilitate running framework-specific parallel tests effectively?
_ How can code coverage reports generated in Actions be integrated with SonarQube?
_ How can a workflow job be configured to fail based on SonarQube analysis results (e.g., quality gate)?
_ How are unit test cases typically added to an Actions workflow?
_ How can Actions run tests against multiple language versions (e.g., Python 3.9, 3.10, 3.11) using a matrix?
_ Is it better practice to run tests before merging a PR or after merging to the main branch? * What specific steps are needed to run tests for older frameworks like .NET Framework 4.8 in Actions?
9. Docker, Builds & Containerization
_ What are common ways Docker images are used within Actions?
_ What causes 'lstat /app: no such file or directory' errors during docker buildx build in Actions?
_ How does the build process differ if using Gradle vs Maven?
_ What are best practices for caching Docker layers/images in Actions?
_ How should Java projects ensure compiled classes are available for tools like SonarQube in Actions?
_ What actions/steps are used to build a Docker image and then run a container from it within a workflow?
_ How can Docker images built in Actions be automatically tagged with versions (e.g., semantic versioning, commit SHA)?
_ Are there official Docker actions, and how do they compare to third-party ones?
_ How should the FROM instruction in a Dockerfile align with the language version used in the build step (e.g., Java 17)?
_ When pushing images to Docker Hub from Actions, does the repository need pre-creation?
10. Deployment & Release Management
_ How can Actions deploy an artifact to a target like a VM or AWS EC2?
_ What methods exist in Actions to deploy a .jar file to a Windows server?
_ What are common approaches for deploying to Kubernetes using Actions?
_ How can Slack notifications be integrated into an Actions deployment workflow?
_ What steps are needed to build and deploy a React app using Actions?
_ What strategies/actions can deploy to an on-premises server from Actions?
_ Can Actions automate uploading an iOS .ipa file to App Store Connect?
_ How should .env files be handled during deployment via Actions?
_ How can Actions workflows handle updates to dependencies needed by the deployed application?
_ Is the demonstrated SSH/rsync deployment method secure? What are alternatives?
_ How can I automate semantic versioning and GitHub Release creation using Actions?
_ How can I implement automated rollbacks with Actions if a deployment or post-deployment test fails (e.g., with Firebase)?
_ How can I deploy to a specific Kubernetes namespace using Actions?
_ How can Actions integrate with ArgoCD for GitOps deployments?
_ How can I handle deploying multiple serverless functions (e.g., AWS Lambda, Supabase Functions) from a single repository/workflow?
_ How does Actions compare to native cloud provider CI/CD services (like AWS CodePipeline) for deployment?
_ How is Terraform state managed when running terraform apply or terraform destroy within Actions?
_ How can Actions deploy Terraform configurations to multiple AWS accounts?
_ What is the rationale for including infrastructure cleanup/destroy steps in an Actions workflow?
_ How can Actions handle deploying applications with complex database migration requirements?
_ How can I update Kubernetes manifests (e.g., image tags) automatically within an Actions pipeline as part of a GitOps flow?
_ How can I handle deploying different parts of a monorepo (e.g., client and server directories) that require navigating between directories within the workflow?
11. Local Testing (act)
_ Can act run an entire workflow, respecting job dependencies, or only individual jobs?
_ How can GitHub Secrets be provided to act for local testing without exposing them? * What are the limitations of act compared to running workflows on GitHub's actual runners?
12. Workload Identity Federation (WIF) _ How does WIF authentication work when used within reusable workflows called from different repositories? _ Does every repository needing to authenticate via WIF require its own configuration in the identity provider (e.g., GCP, Azure, AWS)? _ How does WIF integrate with deploying multiple projects/services within GCP? _ How are attribute mappings and conditions configured for WIF between GitHub Actions and cloud providers (GCP/AWS/Azure)? What do they mean? _ Can WIF be used to authenticate Actions workflows for deploying Firebase services? _ Can WIF authenticate workflows running outside GCP (e.g., a self-hosted runner) to access Google APIs? _ How can WIF be used with Terraform within Actions for keyless authentication? _ What are the security implications of exposing WIF provider IDs or service account emails in workflow files? _ How does WIF work with GitHub Enterprise Server, especially with manually synced actions? _ Can WIF be used to grant permissions for tasks like copying files to GCS buckets?
13. Troubleshooting Common Errors
_ What causes 7zr.exe failed with exit code 2 during setup-node?
_ How to fix Error: Bad credentials when using an action like Kitchen/test-add-pr-comment@v1 with secrets.GITHUB_TOKEN?
_ Why would an action fail with [FATAL] Failed to view version file:[/action/lib/functions/linterVersions.txt]?
_ What causes cml: not found errors when using CML (Continuous Machine Learning) actions?
_ How to resolve cannotResolveClassException: kg.apc.jmeter.threads.UltimateThreadGroup in JMeter actions?
_ What leads to Could not find artifact ghidra:Generic:jar:11.3.1 errors during Maven builds involving Ghidra?
_ Why does the install ssh keys step fail with Error: Process completed with exit code 1?
_ What causes Permission denied (publickey) errors during SSH steps?
_ How to fix Android Gradle plugin requires Java 11 to run. You are currently using Java 1.8?
_ What does Invalid copilot token: missing token: 403 indicate?
_ How to resolve [Rsync] error: rsync exited with code 255... Permission denied?
_ Why might terraform init fail within Actions even if the state file seems present?
_ What causes npm ci to fail with no package-lock.json file error in Actions?
_ How to fix Permission 'iam.serviceAccounts.getAccessToken' denied on resource... when using WIF?
_ What causes gcloud.secrets.versions.access errors related to refreshing tokens with WIF?
_ How to resolve MSBUILD : error MSB1003: Specify a project or solution file during .NET builds?
_ Why might a .NET 8 deployment fail with Package deployment using ZIP Deploy failed?
_ What causes denied: Permission "artifactregistry.repositories.uploadArtifacts" denied... when pushing to GCP Artifact Registry?
_ Why might a workflow run successfully but the deployed application (e.g., on GKE pod) not reflect the latest code changes?
_ What causes refusing to allow an OAuth App to create or update workflow... without \workflow` scope`error on push?
- How to fix
Error: The version '3.x' with architecture 'x64' was not found...when running a composite action? * Why might an Actions deployment succeed but the application be unreachable at its public IP?
14. General Guidance & Best Practices
_ Are there courses or resources focusing on Actions best practices, organization, and advanced tips?
_ What are common pitfalls for beginners using GitHub Actions?
_ Is it better to combine related tasks (like linting and testing) into a single workflow/job or keep them separate?
_ What are the security best practices when using self-hosted runners, especially with public repositories or PRs from forks?
_ What branching strategies work well with GitHub Actions environments and deployment workflows?
_ How should complex deployments (e.g., 20+ resources, multi-subscription) be organized using Actions?
_ How can I handle variability in deployments (different resources/parameters each time) effectively within Actions?
_ What is the best practice for updating image tags in Kubernetes manifests within a CI pipeline (e.g., GitOps approach)? * Is it better to use official GitHub Actions (like actions/checkout) or third-party ones? What are the trade-offs?
Okay, here are the consolidated and rephrased questions, grouped by topic, as if asked by a single person learning Docker and CI/CD concepts. Frequencies are estimated based on the provided list.
Fundamentals & Concepts:
- I'm still really confused about what Docker actually is and why I should use it. How is it different from just running my code directly or using a virtual machine? What problems does it solve, especially for solo projects or simple web apps? Is it like a lightweight VM, or something else entirely? (Frequency: ~35+)
- What's the real difference between a Docker image and a container? Is the image just the blueprint and the container the running instance? (Frequency: ~5)
- I hear "container orchestration" mentioned a lot with Docker, especially Kubernetes. What does orchestration actually mean in this context, and why is it needed? (Frequency: ~5)
- What's the practical difference between stopping a container and removing it? When should I do each? (Frequency: ~3)
- How does Docker handle resources? If I run multiple containers, will they crash my server if they use too much memory or CPU? How are resources allocated? (Frequency: ~3)
- How secure are Docker containers? If they share the host OS kernel, could a virus in one container affect others or the host? What about running scripts inside – is that safe? How can I trust third-party images from Docker Hub? (Frequency: ~8)
- What's the difference between the Docker client, the Docker daemon, and the Docker engine? Are they all separate things I need to install or understand? (Frequency: ~3)
- Is Docker still relevant today, especially with tools like Kubernetes or alternatives like Podman? Is it deprecated or being replaced? (Frequency: ~5)
Dockerfile & Images:
- I need a solid explanation of the
Dockerfile. What are the essential commands (likeFROM,RUN,CMD,ENTRYPOINT,COPY,WORKDIR,EXPOSE,ARG,ENV), what do they do, and when should I use each one? What's the difference betweenRUN,CMD, andENTRYPOINT? (Frequency: ~30+) - How do I choose the right base image (
FROM)? Does it matter if I useubuntu,alpine,node,python, or aslimversion? What are the implications for size and functionality? Does the base image OS need to match my host OS? (Frequency: ~15+) - My Docker images seem really large. How can I make them smaller? What are multi-stage builds and distroless images, and how do they help reduce size? Does building inside the Dockerfile (multi-stage) make sense compared to copying pre-built artifacts? (Frequency: ~15+)
- How does Docker's build cache work? Why do some commands run every time even if the files haven't changed? How does the order of commands affect caching, especially
COPY package.jsonvsCOPY . .? When should I use--no-cache? (Frequency: ~10+) - What actually goes inside a Docker image? Does it contain a full OS, just my application code, dependencies, or some combination? How can I inspect the layers or contents of an image? Can I hide my source code inside it? (Frequency: ~10+)
- How should I manage image tags? What does
:latestreally mean, and is it bad practice to use it? How do I update images or tag them for different environments (dev, prod)? (Frequency: ~10+) - How do I handle application dependencies (like Python's
requirements.txtor Node'spackage.json) in a Dockerfile? Do I still need tools likevenvorcondainside the container? Why copy the manifest file (package.json) separately before copying the rest of the code? Should I includenode_modulesor lock files (package-lock.json)? (Frequency: ~10+) - What's the build context (
.indocker build .) and how does it relate to theCOPYcommand paths and.dockerignore? (Frequency: ~5+) - How do I pass arguments or environment variables during the build (
ARGvsENV) versus setting environment variables for the running container (ENV)? (Frequency: ~4)
Volumes & Data Persistence:
- How do I save data permanently in Docker? My container data disappears when I remove the container. What are volumes and bind mounts, what's the difference, and when should I use each? (Frequency: ~50+)
- How do volumes actually work? Where are they stored on my host machine? Can I see their contents, manage their size, back them up, or delete them when I'm done? Do they have size limits? (Frequency: ~20+)
- I'm having trouble with file permissions when using volumes or bind mounts, especially when the container runs as non-root but needs to write to a host directory owned by root. How do I fix this? (Frequency: ~5+)
- Can I share the same volume or bind mount between multiple containers? How does that work for reading and writing data concurrently? (Frequency: ~10+)
- How do volumes work with Docker Compose? Do I define them in the
docker-compose.ymlfile? Can I specify a local path (like on my Windows drive) for a volume in the compose file? Does Compose create volumes automatically? (Frequency: ~10+) - What happens to data in volumes if I restart the container, update the image, or upgrade the Docker engine? (Frequency: ~5)
- Can I mount a specific file instead of a whole directory as a volume? (Frequency: ~3)
Networking:
- How do Docker containers communicate with each other? Do they get their own IP addresses? How can I make my web container talk to my database container? (Frequency: ~15+)
- What's the deal with port mapping (
-p host:container)? How do I choose ports? Can I map multiple ports? Can I access the container's service from another computer on my network or only fromlocalhost? (Frequency: ~15+) - How can my container access services running on my host machine (like a local API or database), especially
localhost? Does this work differently on Windows/Mac vs. Linux? (Frequency: ~6) - What are the different Docker network drivers (bridge, host, overlay, macvlan, none)? When should I use each one? What does the default bridge network (
docker0) do? (Frequency: ~10+) - How can I set up more complex networking, like exposing multiple containerized websites using different domain names on the same host, possibly using a reverse proxy like Nginx or Traefik? (Frequency: ~5)
- How does Docker networking interact with volumes or container lifecycles? (Frequency: ~2)
Docker Compose:
- Why do I need Docker Compose? Isn't it just a way to run multiple
docker runcommands? How is it different from just using Dockerfiles or a multi-stage build? (Frequency: ~10+) - How do I write a
docker-compose.ymlfile? What are the basic sections likeservices,volumes,networks,ports,environment,build,context? Does the order matter? Does theversiontag still matter? (Frequency: ~10+) - How do services defined in the same Docker Compose file talk to each other? Do I use service names? Do I need
linksanymore? (Frequency: ~5) - How do I manage the lifecycle with Compose? How do I start, stop, restart, rebuild, and view logs for my services? How do I make services start automatically when my server boots? (Frequency: ~5+)
- Can I use Docker Compose in production, or is it just for development? How do I deploy a Compose application? (Frequency: ~4)
- How do
.envfiles work with Docker Compose for configuration and secrets? (Frequency: ~3)
Installation, Setup & Environment:
- How do I install Docker correctly on my system (Windows, Mac, Linux)? Do I need Docker Desktop, or can I just use the engine/CLI? What are the prerequisites (like WSL2 or Hyper-V on Windows)? (Frequency: ~15+)
- I'm getting errors connecting to the Docker daemon (
docker daemon is not running,Cannot connect to the Docker daemon). How do I troubleshoot this? What causes the daemon to stop? (Frequency: ~10+) - Why do I need
sudoto run Docker commands on Linux? How can I run Docker commands as a regular user? (Frequency: ~5+) - Can I run Docker inside a VM? Are there performance implications? (Frequency: ~5+)
- I'm having trouble with Docker on my specific hardware/OS (Mac M1/ARM, Windows Home, Synology, Raspberry Pi, specific Linux distro version). Are there known compatibility issues or specific setup steps? (Frequency: ~10+)
- What are the typical hardware requirements for running Docker (RAM, CPU)? (Frequency: ~3)
Development Workflow & Integration:
- How does Docker change my local development workflow? How do I handle code changes – do I need to rebuild the image every time? How does hot reloading (like with nodemon or Vite HMR) work with volumes/bind mounts? (Frequency: ~25+)
- I'm having issues getting hot reloading/live code sync to work, especially on Windows or Mac. Changes in my local files aren't showing up in the container. What could be wrong? (Frequency: ~15+)
- How can I debug code running inside a Docker container using my IDE (like VS Code or PyCharm)? How do I set breakpoints? Do I need to connect the debugger remotely? (Frequency: ~10+)
- How should I integrate Docker with my IDE (like VS Code)? What extensions are useful for Dockerfile syntax, autocompletion, or managing containers? How do dev containers work? (Frequency: ~10+)
- How do teams work together using Docker? How do we share environments and manage configurations consistently? (Frequency: ~4)
Security & Best Practices:
- What are the security best practices for Docker? Should containers run as root? How do I handle sensitive information like passwords or API keys securely (secrets management)? (Frequency: ~15+)
- How reliable are official images from Docker Hub? What about third-party images? How can I scan images for vulnerabilities? (Frequency: ~5+)
- Is it safe to automate cleanup tasks like
docker prunein production? (Frequency: ~2) - What are common mistakes or pitfalls to avoid when working with Dockerfiles, volumes, or networking? (Frequency: ~3)
Windows Containers & Cross-Platform:
- Can I run Windows applications or even a full Windows OS inside Docker containers? How does that work, especially on a Linux or Mac host? Does it require a different setup (like Hyper-V)? (Frequency: ~15+)
- Can I run Linux containers on a Windows host? How does that work (WSL2)? What about dependencies – if my app needs Linux libraries, how does it run on Windows via Docker? (Frequency: ~10+)
- How does Docker handle cross-platform compatibility between different OS versions or CPU architectures (like Intel vs. ARM)? How do I build multi-arch images? (Frequency: ~5+)
Docker Alternatives (Podman, etc.) & Licensing:
- Is Docker free to use? What's the deal with Docker Desktop licensing? Do I have to pay? Is the CLI/Engine free? (Frequency: ~10+)
- What is Podman? How does it compare to Docker? Is it a drop-in replacement? Can it run Docker images from Docker Hub? Does it support Docker Compose? What are the pros and cons (rootless, daemonless)? (Frequency: ~15+)
- Should I switch from Docker to Podman? What are the challenges or benefits? (Frequency: ~5)
CI/CD Integration:
- How do I use Docker in a CI/CD pipeline (like GitHub Actions or Jenkins)? How do I build images, run tests in containers, and deploy containerized applications? (Frequency: ~10+)
- What is Docker-in-Docker (DinD) and why is it sometimes needed in CI pipelines? How does it work? (Frequency: ~5+)
- How do I manage credentials (like for Docker Hub or cloud registries) securely in a CI/CD environment? (Frequency: ~3)
Okay, here are the questions, confusions, and requests for clarification regarding deployment strategies, grouped by topic, translated where necessary, and rephrased for a consistent style. They are ordered roughly by frequency, starting with the most common themes:
1. Database Migrations & Data Handling:
- I'm confused about handling database schema changes (like adding/dropping columns, altering tables, changing relationships) with zero-downtime deployment strategies like Blue-Green, Canary, or Rolling Updates. How can the old version still work if the schema changes?
- How do you ensure database backward compatibility, especially to allow for rollbacks? What tools or strategies (like Liquibase) can help?
- When using strategies like Blue-Green or Canary with shared databases, how is data synchronized between versions or environments during the transition? What happens to data written by the new version if I need to roll back?
- Specifically for Blue-Green, if the green database environment starts in read-only mode, how can I test application compatibility with new schema changes before the switchover?
- What happens with stateful applications or long-running background jobs that depend on database state during these deployments?
- Can you explain database migration strategies like Expand/Contract in more detail, particularly regarding potential write-locks or data conflicts during the process?
2. Strategy Differences & Clarifications (Blue-Green vs. Canary vs. Rolling, etc.):
- What are the main differences between Blue-Green, Canary, Rolling Update, Recreate, Shadow, and A/B testing deployment strategies? They seem quite similar in some aspects.
- I'm particularly confused about the difference between Canary and Rolling Update, and between Blue-Green and Canary. Isn't Canary just a slower Rolling Update or a form of A/B testing?
- Some demos seem to mix concepts (e.g., showing user-specific routing in what's called Blue-Green). Can you clarify the defining characteristics, especially regarding traffic switching (all at once vs. gradual/partial)?
- Is using feature flags/toggles a distinct deployment strategy, or is it a technique used alongside others like Blue-Green? How does it compare?
- What exactly is a Shadow deployment? Why wasn't it covered?
- What does "Recreate" mean compared to Blue-Green?
3. Infrastructure Setup, Cost & Networking:
- How is the infrastructure actually set up for strategies like Blue-Green? Do I need fully duplicate environments (VMs, clusters)? Isn't that expensive due to doubling infrastructure costs?
- Can Blue-Green be achieved within a single cluster using namespaces instead of needing entirely separate clusters?
- How is traffic actually switched in Blue-Green? Is using DNS reliable given caching issues? How does the load balancer handle the switch? Do I need multiple IPs or load balancers?
- For Canary, how is the infrastructure set up if we're not creating a whole new environment? Are we just deploying the new version to a subset of existing servers?
- How does Blue-Green work specifically for serverless functions like AWS Lambda where there isn't a traditional load balancer or persistent server fleet?
- How does server segregation work during deployment (assigning specific servers to blue vs. green)?
- What does the term 'warm' fleet mean in the context of preparing servers for deployment?
- How are cloud recommendations (like minor DB engine or OS updates) handled during a major Blue-Green RDS upgrade? Do they need to be done first or are they handled automatically?
4. Tooling, Automation & Implementation Details:
- How are these strategies, like Canary or Blue-Green, actually implemented in Kubernetes? Is it just
kubectl rolloutor does it require more complex tooling like Istio, Flagger, Argo Rollouts, Helm, Nginx Ingress, Traefik, Kong, etc.? - Can you provide practical examples or demos using specific tools like Jenkins, Helm, Istio, Flagger, Argo Rollouts, or cloud provider services (AWS CodeDeploy, Azure DevOps pipelines, App Engine) to automate these strategies?
- How do tools like Argo Rollouts (replacing
DeploymentwithRollout) compare to Flagger (referencing existingDeployment) in practice, especially when dealing with third-party Helm charts? - How can I manage different Kube config maps (e.g., for feature flags) across preview/active services when using tools like Argo Rollouts?
- Can you explain specific configurations in tools, like
appspec.ymlTaskDefinition ARN versioning in AWS ECS deployments orspec.strategy.canary.analysis.argsin Argo Rollouts? - Is it possible to automate the service switch/label change in Blue-Green deployments via commands or operators instead of manual changes?
- How does Jenkins add benefit to an AWS CodeDeploy pipeline if the outcome seems achievable without it?
- How do I apply these strategies when dealing with multiple interconnected microservices, especially internal ones not directly exposed via Ingress? How does service A's canary talk to service B's canary without Istio?
5. Rollback & Failure Handling:
- How does rollback actually work, especially in automated pipelines? If a deployment (e.g., green environment, canary percentage) fails validation or health checks, how is the traffic automatically reverted?
- What happens to the YAML configuration file image version if a rollback occurs using
kubectl rollout undo? How do you track changes across revisions, especially after rollbacks? - How do you handle rollbacks when database schema changes have already been applied?
- What happens if a deployment is paused, a hotfix image is pushed, and then the deployment is resumed?
6. Request & Session Handling during Transitions:
- What happens to in-flight user requests when traffic is switched (e.g., from Blue to Green, or during a Rolling Update)? Do users experience failures or errors?
- How are existing connections drained gracefully from the old version before it's scaled down? How long does this take?
- How are user sessions handled during a switchover? Do they need to be moved?
- How can I ensure zero downtime during the swap/switchover, especially under high load?
7. Applicability & Use Cases:
- Does Blue-Green make sense for a first-time deployment (Day 0)?
- Are strategies like Blue-Green suitable for stateful applications?
- How would you apply these strategies to applications using specific technologies like Tomcat, JBoss, Kafka consumers, or multi-container pods?
- Which strategy is generally preferred or most used in real-time production environments? Which should I mention in an interview?
- Can progressive delivery be used based on region or timezone?
- Can these strategies be applied to upgrading infrastructure components or third-party apps (like ingress controllers, cert-manager, Prometheus)?
8. Testing & Validation:
- How are deployments validated in the "green" environment before switching traffic in Blue-Green? What kind of tests (smoke, performance, functional) are typically run?
- How is analysis performed in Canary deployments, especially with low/no traffic or when changes affect only specific endpoints? Can you show examples using web analysis or metrics?
- How can QA teams test a canary deployment in production if only a small percentage of traffic is routed, and how can they specifically target the new version?
- Can a Blue-Green deployment switch be triggered automatically based on successful smoke tests?
9. General Confusion & Basic Clarifications:
- I'm finding the patterns confusing as they seem similar; could you clearly highlight the core differences again?
- What does the term 'rollout' mean in Kubernetes? Is it just moving to the next version?
- What is the difference between
kubectl patch deploymentand using a Rolling Update strategy? - What's the difference between a Kubernetes Deployment and a ReplicaSet in the context of updates?
- How can we have different code versions running if the code is developed in one place? (Fundamental confusion about deployment artifacts).
- Is achieving true zero downtime actually possible?
Chapter X: Considerations for Businesses: Is CI/CD Right for You?
Introduction: Beyond the Buzzwords
Continuous Integration (CI) and Continuous Deployment/Delivery (CD) are more than just technical practices or the latest industry buzzwords. For any business, adopting CI/CD represents a significant strategic decision with far-reaching implications, touching everything from development workflows and team structures to product strategy and company culture. It promises faster delivery, higher quality, and increased agility, but achieving these benefits requires more than simply installing a new set of tools. It demands a thoughtful evaluation of business needs, a commitment to cultural change, and a clear understanding of both the potential rewards and the inherent challenges.
This chapter dives into the critical considerations for businesses contemplating the journey into CI/CD. We'll move beyond the technical implementation details (covered elsewhere in this book) to explore the fundamental questions: Why should your business consider CI/CD? When might it be the right path, and when might it not? What are the broader organizational shifts required for success? And how can you begin to lay the groundwork for a successful transition? Making an informed decision requires looking holistically at your organization's goals, capabilities, and readiness for change.
Defining the Rationale: Why Embark on the CI/CD Journey?
Before diving headfirst into implementing pipelines and automation, the most crucial first step is introspection. The business must clearly articulate why it wants to adopt CI/CD. Is there a specific problem to solve, a tangible goal to achieve? Without a well-defined rationale, any transformation effort risks becoming directionless, costly, and ultimately ineffective.
Common Business Drivers:
- Accelerating Time-to-Market: Are customers demanding new features faster? Is the competition outpacing your release cadence? CI/CD aims to significantly shorten the cycle time from code commit to production release, allowing businesses to respond more rapidly to market demands and opportunities. If your current processes are a bottleneck, preventing valuable features from reaching users promptly, CI/CD offers a structured approach to streamlining delivery.
- Improving Release Quality and Stability: Does fear of production failures lead to infrequent, large, and risky releases? CI/CD, particularly when coupled with robust automated testing and gradual rollout strategies, aims to reduce the risk associated with each deployment. By integrating and deploying smaller changes more frequently, issues can often be detected and resolved faster, leading to more stable production environments.
- Enhancing Agility and Experimentation: Does the business need to experiment with new features, test hypotheses, or pivot quickly based on user feedback? CI/CD provides the technical foundation for rapid iteration. It makes it easier to deploy Minimum Viable Products (MVPs), gather real-world data, and adapt based on learning, fostering a culture of experimentation and calculated risk-taking.
- Boosting Developer Productivity and Morale: Are developers bogged down by manual, repetitive tasks related to building, testing, and deploying? Automation is a core tenet of CI/CD, freeing up developers to focus on higher-value activities like feature development and innovation. A smooth, reliable pipeline can significantly reduce frustration and improve the overall developer experience.
- Attracting and Retaining Talent: In today's competitive landscape, modern development practices are often a key factor for attracting skilled engineers. Demonstrating a commitment to CI/CD signals a forward-thinking engineering culture, which can be a significant draw for talent.
Beyond "Keeping Up with the Joneses":
It's tempting to adopt CI/CD simply because "everyone else is doing it" or because it appears on job postings. However, this is a weak foundation for such a significant undertaking. CI/CD requires substantial investment in tools, training, and process re-engineering. It necessitates changes in how teams collaborate and how work is planned and executed. Embarking on this journey without clear, business-aligned goals is likely to lead to frustration, wasted resources, and a failure to realize the potential benefits.
Be Honest About Your Goals:
- Are you genuinely trying to solve a bottleneck in your delivery process?
- Do you need the capability to deploy software reliably at any time?
- Is the goal primarily to improve internal developer workflows, even if customer-facing release frequency doesn't change dramatically initially?
- Are you prepared for the cultural shifts and the potential short-term overhead during the transition?
Honest answers to these questions will help determine if CI/CD is the right solution and will provide the necessary context for defining success metrics later on. Moving to CI/CD likely won't fix deep-seated organizational or business problems on its own; those underlying issues must be addressed concurrently or even beforehand.
Is CI/CD Always the Right Choice? Scenarios for Caution
While CI/CD offers significant advantages in many contexts, it's not a universal panacea. There are situations where the overhead and complexity might outweigh the benefits, or where the organizational context makes successful adoption particularly challenging. Consider these scenarios:
- Infrequent Release Needs: If a product is mature, stable, and requires only occasional maintenance updates (e.g., yearly patches for a legacy system scheduled for decommissioning), the effort to establish and maintain a full CI/CD pipeline might not yield a sufficient return on investment.
- Highly Regulated Environments: Industries with extremely strict regulatory oversight (e.g., certain medical devices, avionics, nuclear systems) often have mandatory, lengthy validation and approval processes for every change. While automation (CI) can still be valuable, continuous deployment might be impractical or even prohibited. Compliance requirements (like those outlined in standards such as AAMI TIR45 for medical software) must take precedence.
- Predominantly Manual, Complex Testing: Some applications, especially those with highly complex, visual, or physically interactive components, might be exceptionally difficult or cost-prohibitive to test comprehensively through automation. If essential quality assurance relies heavily on extensive manual testing phases that cannot be easily shortened or parallelized, the "continuous" aspect of delivery will be inherently limited.
- Severe Resource Constraints: Implementing and maintaining CI/CD requires investment in tools (build servers, artifact repositories, monitoring systems), infrastructure (potentially cloud resources, test environments), and critically, personnel time for setup, training, and ongoing maintenance. Startups or organizations operating under very tight budgets may find these initial and ongoing costs prohibitive.
- Highly Entrenched Monolithic Architectures: While CI/CD can be applied to monoliths, it's often significantly more challenging than with microservices or well-modularized applications. Long build and test times for the entire monolith can negate the rapid feedback loop that is central to CI/CD's benefits. Significant refactoring might be a prerequisite (see Chapter Y on Architecture).
- Lack of Team Buy-in and Cultural Readiness: CI/CD is as much a cultural shift as a technical one. It requires collaboration, shared responsibility, and a willingness to change established workflows. If development teams, operations, management, or other key stakeholders are resistant or lack understanding of the principles and benefits, the implementation will likely face significant hurdles.
- Very Short Project Lifespans: For temporary, one-off projects that won't undergo significant iteration or require long-term maintenance, the upfront effort to establish a sophisticated CI/CD pipeline is unlikely to be justified.
- Significant Infrastructure Limitations: Teams working in environments with poor connectivity or heavily restricted access to necessary resources might find the "continuous" nature of pulling code, running builds, and deploying artifacts impractical. Similarly, heavy reliance on external dependencies that are unreliable or unavailable for testing can break the flow.
- Extremely High Cost of Failure: In systems where failure has potentially catastrophic consequences, the emphasis naturally shifts towards exhaustive, upfront verification and validation, often involving multiple layers of manual review and sign-off, rather than rapid, continuous deployment.
It's crucial to remember that even if full Continuous Deployment isn't feasible or desirable, many underlying principles of CI – like version control, automated builds, and automated testing – offer benefits in almost any software development context. The decision isn't always binary; organizations can adopt practices incrementally based on their specific needs and constraints.
The Broader Impact: CI/CD as a Socio-Technical System
Successfully adopting CI/CD requires recognizing that it's not just about technology; it's fundamentally about how people, processes, and tools interact. It necessitates a shift towards systems thinking and embracing a culture of continuous improvement.
A Systems Thinking Perspective:
Attempting to optimize one part of the software delivery process in isolation often creates bottlenecks elsewhere. Consider the example:
- Problem: Manual testing is slow.
- Superficial Fix 1: Push testers to work faster. Result: Quality drops, burnout increases.
- Superficial Fix 2: Shift manual testing tasks to developers. Result: Feature development slows down, creating a new bottleneck.
- Superficial Fix 3: Demand highly detailed requirements upfront so developers "get it right the first time." Result: Developers wait, collaboration decreases, integration becomes painful, features feel disjointed, motivation drops.
- Systems Thinking Approach: Investigate why testing is slow. Is the architecture difficult to test? Is there a lack of test automation skills or tools? Addressing the root cause (e.g., implementing automated testing, refactoring for testability) offers a more sustainable solution.
CI/CD encourages looking at the entire value stream, from idea to production, identifying the real constraints, and addressing them holistically. The practices within CI/CD – automated testing, frequent integration, infrastructure as code, monitoring – work synergistically. Implementing them in isolation often yields diminished returns.
The Necessary Cultural Shift:
CI/CD thrives in an environment characterized by:
- Collaboration: Breaking down silos between Development, QA, and Operations is essential. Shared goals and responsibilities replace finger-pointing.
- Trust: Teams must trust the automation, the monitoring, and each other. Management must trust teams to manage the release process responsibly.
- Transparency: Pipeline status, test results, and monitoring data should be visible to everyone, fostering shared awareness and quick feedback loops.
- Shared Responsibility: Quality is no longer solely QA's job, nor is stability solely Ops'. Developers take on broader responsibilities, including writing tests and understanding operational concerns. The mantra becomes "You build it, you run it."
- Psychological Safety: An environment where it's safe to experiment, make small mistakes, and learn from them is crucial. If failures are heavily penalized, teams will become overly cautious, negating the speed and agility benefits.
Impact on Roles and Responsibilities:
- Developers: Need to write automated tests, understand deployment processes, monitor applications in production, and potentially manage infrastructure via code. Requires broader skill sets and potentially higher training costs initially.
- QA/Testers: Shift focus from repetitive manual checks (which get automated) to higher-value activities like exploratory testing, usability testing, security testing, defining test strategies, and building test automation frameworks.
- Operations: Move from manual configuration and deployment to managing infrastructure as code, building robust monitoring and alerting, and collaborating closely with development on reliability and scalability.
- Managers: Need to foster the right culture, allocate resources for tooling and training, champion the change, define meaningful metrics beyond just deployment frequency, and trust their teams with increased autonomy.
The Continuous Improvement Imperative:
CI/CD is not a "set it and forget it" solution. The pipeline itself is software and requires ongoing maintenance and improvement.
- Pipeline Maintenance: As the application evolves (new dependencies, configurations, tests, deployment targets), the pipeline must be updated. This requires dedicated time and skills.
- Process Refinement: The team should continuously evaluate the process. Are builds too slow? Are tests flaky? Is monitoring effective? Regular retrospectives help identify areas for improvement.
- Continuous Learning: Technologies change, and best practices evolve. Ongoing training is necessary to keep skills sharp and leverage new capabilities.
Ignoring pipeline health or starving it of maintenance resources is a common pitfall. A broken or unreliable pipeline blocks all development and deployment, undermining the very goals CI/CD aims to achieve. The investment in maintenance, however, typically yields a high ROI due to the frequency with which the pipeline is used.
Key Technical Foundations (A High-Level View)
While this chapter focuses on business considerations, a few technical prerequisites are fundamental for enabling CI/CD:
- Version Control: All code, tests, configuration, infrastructure definitions (IaC), and pipeline definitions must live in a version control system (like Git). This is non-negotiable.
- Automated Build Process: There must be a reliable, scriptable way to compile, build, and package the application without manual intervention.
- Automated Testing: A suite of automated tests (unit, integration, end-to-end) is critical for providing confidence in changes automatically. The ability to run these efficiently is key.
- Testable Architecture: The application's architecture should facilitate testing. Tightly coupled components or monoliths can make isolated testing difficult and slow down feedback loops. Practices like dependency injection and clear interfaces help. (See Chapter Y on Architecture).
- Infrastructure Provisioning: The ability to create consistent environments (testing, staging, production) reliably and automatically, often through Infrastructure as Code (IaC), is essential for repeatable deployments.
- Deployment Strategy: A mechanism to deploy the application automatically and reliably, ideally with strategies for zero-downtime updates and quick rollbacks (e.g., blue-green, canary).
- Monitoring and Telemetry: Once deployed, robust monitoring is needed to understand application health, performance, and user behavior, providing feedback to the development loop. Focus on customer-centric metrics (e.g., time-to-interactive, error rates affecting users) rather than just server-level stats.
Failure to establish these technical foundations will significantly impede or even prevent a successful CI/CD implementation.
Regional and Cultural Differences
The ease and nature of CI/CD adoption can also be influenced by regional factors:
- Skill Availability: The concentration of skilled personnel (DevOps engineers, automation testers, cloud specialists) varies geographically. Regions with a smaller pool of experienced individuals may face challenges in implementation and maintenance. Migration and immigration patterns can further complicate workforce planning.
- Country Culture: Some research suggests that national cultural traits (e.g., attitudes towards risk, hierarchy, collaboration norms) might impact the adoption rate and style of DevOps and CI/CD practices. While more research is needed, it's a factor to be aware of, particularly for globally distributed organizations. Studies in regions like Sri Lanka, Pakistan, and New Zealand (as cited in the notes) highlight varying levels of awareness, practice adoption, and challenges, suggesting context matters.
These differences underscore the need for a flexible approach, adapting practices to the local context rather than applying a rigid, one-size-fits-all model.
Okay, let's continue building the chapter, moving into addressing common concerns, defining success, and outlining a path for adoption.
Accelerating Without Cutting Corners: Addressing Fears and Building Confidence
The prospect of integrating and deploying code much more frequently can initially seem daunting, even chaotic. Common concerns often revolve around a perceived loss of control and an increased risk of introducing bugs into production.
Myth: Frequent Integration = More Bugs and Chaos
A traditional mindset might equate frequent changes with instability. "We found so many bugs during our last long testing cycle; surely merging code constantly will make things worse!" This perspective often stems from experiences with large, infrequent integrations where merge conflicts are complex and bugs accumulate undetected for long periods.
CI/CD, however, aims to increase control and reduce risk through several mechanisms:
- Smaller Changes, Lower Risk: Integrating small, incremental changes means each merge is less complex and easier to reason about. If a problem arises, it's typically contained within a smaller set of recent changes, making debugging significantly faster. It's like constantly treading down the grass path; small obstacles are easily noticed and dealt with, preventing them from becoming major blockages.
- Automation as Strict Control: Automated build and test pipelines provide consistent, repeatable checks. Unlike manual processes, automation executes instructions precisely, leaving no room for ambiguity or misinterpretation. A "green" pipeline provides a baseline level of confidence that critical functionality remains intact.
- Early Feedback: Automated tests run on every commit or pull request provide immediate feedback to developers, allowing them to fix issues while the context is still fresh in their minds. This contrasts sharply with finding bugs weeks or months later during a dedicated testing phase.
- Controlled Exposure: Techniques like feature flags allow new code to be deployed to production but kept hidden from end-users. This enables testing in the real production environment ("testing in production") without impacting customers, ensuring the feature is fully vetted before release.
- Enhanced Visibility: CI/CD tools and practices provide greater transparency into the development process, pipeline status, test results, and deployment outcomes.
More Control, Not Less:
Far from being chaotic, a well-implemented CI/CD process provides more rigorous control than many traditional workflows. It replaces infrequent, high-stakes manual checks with continuous, automated validation. It's not about editing index.html directly on a live server; it's about having a robust, automated system to build, test, and deploy changes safely and reliably, with multiple opportunities for validation (local testing, code review, automated pipeline checks, production monitoring) before and after code reaches users.
The Importance of Maintenance and Continuous Improvement:
CI/CD is not a fire-and-forget system. It requires ongoing attention:
- Pipeline Health: The pipeline is a critical piece of infrastructure. If it breaks, development and deployment halt. Teams must prioritize keeping the pipeline "green" (passing) and fixing failures immediately. Ignoring failing tests or build warnings erodes trust and defeats the purpose.
- Test Suite Maintenance: Automated tests need to be updated as the application evolves. Flaky tests (tests that pass or fail intermittently without code changes) must be addressed promptly, as they undermine confidence in the test results. Nobody wants to fix 500 failing tests that have been ignored for months; the test suite becomes useless.
- Monitoring Effectiveness: Continuous monitoring data must be trustworthy and actionable. Too many false alerts lead to "alert fatigue," causing teams to ignore potentially critical issues. Monitoring dashboards and alerts need regular refinement.
This continuous maintenance is crucial. Because the pipeline and tests are invoked frequently, the return on investment for keeping them healthy is high – far higher than the ROI on maintaining brittle, seldom-used manual processes.
Defining Success: Setting Measurable Goals for Your CI/CD Journey
As emphasized earlier, embarking on a CI/CD transformation without clear goals is unwise. Before starting, you need to define what success looks like for your organization and establish metrics to track progress. Avoid relying solely on gut feelings; use concrete data.
1. Measure Your Current State:
Before changing anything, understand your baseline. How long does it really take to get a change from a developer's machine to production?
- Lead Time for Changes: Track the time from code commit to code successfully running in production. This is a key DORA metric.
- Deployment Frequency: How often do you currently release to production? (Hourly, daily, weekly, monthly, quarterly?)
- Build and Test Time: How long does your current build and test process take?
- Change Failure Rate: What percentage of deployments to production result in degraded service or require remediation (e.g., rollback, hotfix)?
- Mean Time to Restore (MTTR): When a failure occurs, how long does it typically take to restore service?
Gathering this data might require digging through logs, version control history, chat threads, or ticketing systems. If precise data is unavailable, gather estimates from the team, but acknowledge the uncertainty. Create a histogram or range rather than forcing a single average, as variability itself is important information. Understanding the current bottlenecks and pain points is critical for prioritizing improvements.
2. Define Your Target State and KPIs:
Based on your business rationale (e.g., faster feature delivery, improved stability), set specific, measurable, achievable, relevant, and time-bound (SMART) goals.
- Example Goal: "Reduce average lead time for changes from 4 weeks to 1 week within 6 months."
- Example Goal: "Increase deployment frequency from monthly to weekly within 3 months, while maintaining a change failure rate below 15%."
- Example Goal: "Ensure 95% of builds complete successfully within 15 minutes."
- Example Goal: "Achieve >80% automated test coverage for critical business flows within 1 year."
3. Focus on Trust and Reproducibility:
Beyond speed, CI/CD aims to build confidence:
- Build Success Rate: Track the percentage of successful builds over time. A consistently high success rate builds trust.
- Reproducibility: Can a new team member easily set up their environment and build the software? Can you reliably rebuild the system from scratch using automated processes? Success here indicates robust automation.
4. Track Progress and Adapt:
Regularly review your metrics. Are you moving towards your goals? Where are the new bottlenecks emerging? Use the data to inform decisions and adjust your strategy. The goal isn't just to "go faster" but to build a sustainable, reliable, and efficient delivery capability that supports business objectives.
Adopting CI/CD: A Gradual and Iterative Approach
Transforming your development and delivery process doesn't happen overnight. A "big bang" switch to CI/CD is risky and disruptive. Instead, adopt an incremental approach, building capabilities and confidence step-by-step.
Phase 1: Understanding and Groundwork (Can Occur in Parallel)
- Document the Existing Process: Before automating, deeply understand the current workflow. How is software built? Tested? Deployed? Who is involved? What are the handoffs? Create a living document detailing these steps, including any "hidden" communications or approvals. Have the team validate this documentation.
- Establish Solid Version Control: Ensure everything (code, tests, scripts, infrastructure definitions, pipeline configurations) is in a version control system (like Git). This is the bedrock.
- Standardize the Local Build: Can every developer reliably build and run the application locally? Refresh or create an onboarding guide detailing all steps and dependencies. Test this guide on a clean machine. Identify and document all required tools, libraries, secrets, and access requirements. Standardize dependency versions across the team. If using custom internal dependencies, ensure they are versioned and accessible from a package repository. Benefit: Improves developer onboarding and consistency, even without a CI server.
- Introduce Code Reviews (or Strengthen Existing Ones): Implement lightweight pull request-based code reviews for all changes merged into the main branch. This improves code quality and knowledge sharing. Benefit: Early quality gate and collaboration improvement.
- Begin Writing Automated Tests: Start building an automated test suite, even if it's small initially. Focus first on unit tests or critical acceptance tests. Ensure these tests can be run easily by developers locally. The first test might take time to set up the necessary framework, but subsequent tests will be faster. Benefit: Starts building a safety net and test automation skills.
Phase 2: Implementing Continuous Integration (CI)
- Set Up a CI Server/Service: Choose a CI tool (e.g., Jenkins, GitLab CI, GitHub Actions, Azure Pipelines) and configure it.
- Automate the Build: Create a pipeline definition (e.g., Jenkinsfile,
.gitlab-ci.yml, GitHub workflow) that automatically checks out the code and runs the build process identified in Phase 1. Start simple, perhaps building just one component, then expand to the full application. - Automate Testing in the Pipeline: Integrate the automated tests created in Phase 1 into the pipeline. Configure the pipeline to fail if the build breaks or tests fail. Block merging of pull requests if the pipeline fails. Ensure the test environment on the CI server is consistent.
- Publish Artifacts: Configure the pipeline to package the application and publish the resulting build artifacts (e.g., JARs, Docker images, compiled binaries) to an artifact repository (like Nexus, Artifactory, Docker Hub). These artifacts become the single source of truth for deployments. Benefit: Reliable, repeatable builds and tests triggered automatically, providing rapid feedback on integration issues.
Phase 3: Moving Towards Continuous Delivery/Deployment (CD)
- Analyze the Release Process: Deeply scrutinize the documented release process. Identify bottlenecks, manual steps, inconsistencies, and hidden expectations (e.g., manual emails, ad-hoc approvals). Consult the release team.
- Automate Deployment Steps: Start automating the deployment process, initially perhaps to a dedicated test or staging environment. Use the artifacts generated by the CI pipeline. Leverage Infrastructure as Code (IaC) tools (like Terraform, Pulumi, CloudFormation) to provision and manage environments consistently.
- Introduce Deployment Strategies: Implement strategies for safer deployments, such as blue-green deployments or canary releases, allowing for zero-downtime updates and easier rollbacks.
- Implement Continuous Monitoring: Set up monitoring and alerting for deployed applications. Focus on key business and user-centric metrics. Feed this information back into the development process.
- Increase Release Frequency Incrementally: Aim to release more often. Moving from yearly to quarterly, then monthly, then weekly forces inefficiencies in the manual process to the surface. This doesn't mean cramming more work in; it often requires reducing the scope per release (enabled by faster cycles) and requires coordination with Product Management. Even if a full feature isn't ready, deployable increments should be integrated and potentially demoed.
- Refine and Iterate: Continuously look for ways to remove manual steps, streamline approvals (replacing manual checks with automated evidence where appropriate), and improve pipeline speed and reliability.
Throughout this process, prioritize building trust in the automation. Avoid overly complex scripts initially; debuggable, understandable automation is key. Communicate changes clearly to all stakeholders.
Branching Strategies: Enabling Frequent Integration
Your branching strategy significantly impacts your ability to practice CI/CD effectively. The goal is to facilitate frequent integration into the main line of development, avoiding long-lived branches that accumulate divergence and lead to painful "big bang" merges.
- Trunk-Based Development (TBD): Often considered the ideal for CI/CD. Developers commit small changes directly to the main branch ("trunk") or use very short-lived feature branches (hours or days) that are merged quickly. Relies heavily on feature flags to manage incomplete features in production and robust automated testing. Pros: Minimizes merge conflicts, promotes continuous integration. Cons: Requires discipline, strong testing culture, and effective feature flag implementation.
- GitFlow/GitHub Flow (and variants): Involve more structured use of branches (feature branches, release branches, hotfix branches). Can be suitable, especially when needing to support multiple released versions or when transitioning gradually. Key Consideration: Feature branches must be kept short-lived and integrated frequently (daily if possible) back into the main development branch to avoid deviating too far. Release branches should be used primarily for stabilization, not long-term feature development.
- Long-Lived Branches: Generally discouraged in CI/CD for active development, as they represent delayed integration. However, they may be necessary for maintaining older, supported versions of software (maintenance branches). In this case, fixes might flow from the maintenance branch to the main trunk (or vice-versa, carefully managed).
Branching Hygiene and Anti-Patterns:
Regardless of the chosen strategy, good hygiene is essential:
- Consistent Naming: Use clear, consistent naming conventions (e.g.,
feature/ticket-123,hotfix/auth-bug) for organization. - Clean Up Stale Branches: Regularly identify and delete merged or abandoned branches to avoid clutter and confusion.
- Avoid Branching Anti-Patterns: Be wary of practices like "Merge Paranoia" (avoiding merges), "Big Bang Merge" (delaying merges too long), "Branch Mania" (excessive branching), or "Spaghetti Branching" (merging between unrelated feature branches). These indicate process problems or misunderstandings that hinder integration. (Referencing Bird et al.'s work on branching patterns is useful here).
The key is choosing a strategy that supports, rather than hinders, the core CI principle of integrating code early and often. Okay, let's dive into the common pitfalls, specific challenges like legacy systems, and how to manage the ongoing process.
Avoiding the Pitfalls: Common CI/CD Anti-Patterns
While CI/CD offers immense potential, poorly implemented practices can negate the benefits and even introduce new problems. Recognizing and avoiding common anti-patterns is crucial for sustained success.
1. Ignoring or Hiding Build Failures (The Broken Window Syndrome):
- The Anti-Pattern: A build fails, or tests produce warnings, but the team ignores them, comments out failing tests, or configures the pipeline to report success despite underlying issues (e.g.,
BP16: A build is succeeded when a task is failed). Notifications might be missed (BP23: Missing notification mechanism) or deliberately ignored (C6: Issue notifications are ignored). Fixing the failure is deprioritized (C5: Build failures are not fixed immediately). - Why It's Bad: The pipeline's primary purpose is to provide reliable feedback and instill confidence. Ignoring failures renders this feedback useless. It allows defects to accumulate, erodes trust in the automation, and ultimately means the business cannot release reliably when needed. It's akin to ignoring a flashing engine light – the problem will likely worsen.
- The Fix: Treat a broken build/pipeline as the highest priority (Stop-the-Line mentality). Fix failures immediately. Investigate warnings. Ensure notifications are prominent and actionable. The pipeline must remain trustworthy.
2. Inconsistent or Inappropriate Environments:
- The Anti-Pattern: The CI/CD environment differs significantly from development or production environments (
DevOps: A definition...: dev environment slightly different from production). Build environment cleanup is handled poorly (BP1: Inappropriate build environment clean-up strategy), leading to inconsistent builds (lack of cleanup) or slow builds (overly aggressive cleanup). Production resources are used for testing (Q7: Production resources are used for testing purposes), risking production stability. Testing doesn't occur in a production-like environment (Q1: Lack of testing in a production-like environment). - Why It's Bad: Differences between environments mean that a "green" build in CI doesn't guarantee success in production ("works on my machine" syndrome). Poor cleanup leads to unreliable builds or wasted time/resources. Using production for testing is extremely risky.
- The Fix: Use Infrastructure as Code (IaC) to define and manage environments consistently. Ensure necessary cleanup occurs to prevent state pollution between builds, but avoid deleting unnecessarily (e.g., cached dependencies). Maintain dedicated, production-like environments for staging and testing.
3. Poor Pipeline and Job Design:
- The Anti-Pattern: Pipelines become overly complex monoliths (
BP3: Wide and incohesive jobs are used). Build configurations are manually copied and pasted across different pipelines instead of being modularized (BM4: Build configurations are cloned). Tasks aren't logically grouped into stages (BP9: Tasks are not properly distributed). Independent build jobs aren't run in parallel where possible (BP5: Independent build jobs are not executed in parallel), slowing down feedback. Build scripts depend heavily on specific IDE settings (BM2: Build scripts are highly dependent upon the IDE). - Why It's Bad: Complex, duplicated pipelines are hard to understand, maintain, and debug. Slow feedback loops negate the agility benefits. IDE dependencies make builds non-portable and unreliable outside a specific developer setup.
- The Fix: Design modular pipelines. Abstract common steps into reusable templates or scripts (see Pipeline Sprawl section below). Structure jobs logically into stages (e.g., build, unit test, integration test, deploy). Parallelize independent tasks. Ensure build scripts are self-contained and runnable from the command line.
4. Neglecting Versioning and Dependency Management:
- The Anti-Pattern: Pipeline definitions, scripts, or infrastructure code are not stored in version control (
R10: Pipeline related resources are not versioned). Applications use dependencies with loose version ranges (e.g.,latestor*inpackage.json) without a lock file (package-lock.json,yarn.lock), meaning dependencies can change unexpectedly between builds (R10: "negatively impacts the reproducibility..."). A central artifact repository for build outputs is missing (D2: Missing artifacts' repository). Explicit dependency management tools aren't used (BP18: Dependency management is not used). - Why It's Bad: Lack of versioning makes changes untraceable and rollback difficult. Unpinned dependencies lead to non-reproducible builds – the same code commit might build successfully one day and fail the next due to an upstream change, causing confusion and "ghost" bugs. Without an artifact repository, builds aren't centrally stored and managed.
- The Fix: Version everything related to the build and deployment process. Use lock files to pin dependency versions, ensuring reproducible builds. Update dependencies deliberately and test the changes. Use an artifact repository to store and version build outputs. Leverage package managers effectively.
5. Security Oversights:
- The Anti-Pattern: Secrets like passwords or API keys are hardcoded directly into pipeline scripts or committed to version control in plain text (
BP29: Authentication data is hardcoded (in clear) under VCS). Pipelines download and execute scripts or artifacts from untrusted external sources without validation (Security of public continuous integration services). - Why It's Bad: Exposes sensitive credentials, creating major security vulnerabilities. Untrusted external code can introduce malware or compromise the build environment.
- The Fix: Use built-in secrets management features of your CI/CD platform or dedicated secrets management tools (like HashiCorp Vault, AWS Secrets Manager, Azure Key Vault). Store secrets securely and inject them into the pipeline environment only when needed. Vet external dependencies and scripts carefully.
6. Slow Feedback Loops:
- The Anti-Pattern: The core "commit stage" pipeline (build and fast unit tests) takes much longer than the commonly suggested 5-10 minutes (
BP27: Build time... overcomes the 10-minutes rule). Longer-running tests (integration, end-to-end) are run too early or block critical feedback. Build triggering strategy is inefficient (BP11: Poor build triggering strategy, e.g., only building nightly (BP14: Use of nightly builds) instead of on commit). - Why It's Bad: Slow feedback discourages frequent commits and integration. Developers context-switch while waiting, reducing productivity. Long delays between commit and feedback make debugging harder.
- The Fix: Optimize the commit stage pipeline relentlessly. Defer longer-running tests to later stages that run in parallel or less frequently (but still automatically). Trigger builds appropriately (e.g., on every push to a pull request or main branch).
7. Cultural and Process Anti-Patterns:
- The Anti-Pattern: Roles remain strictly siloed (
C3: Developers and operators are kept as separate roles). Developers lack control or understanding of the environments their code runs in (C4: Developers do not have a complete control of the environment). Testing is treated solely as a separate phase or QA's responsibility, not integrated throughout (Q8: Testing is not fully automated). Feature toggles aren't used, leading to long-lived feature branches instead (R6: Feature branches are used instead of feature toggles). There's no strategy for rolling back failed deployments (D3: Missing rollback strategy). - Why It's Bad: Silos impede collaboration and shared ownership. Lack of environment control hinders debugging and operational awareness. Treating testing as an afterthought leads to lower quality and bottlenecks. Long-lived branches delay integration. Lack of rollback makes deployments riskier.
- The Fix: Foster a DevOps culture of shared responsibility. Empower developers with tools and access (within security boundaries) to understand environments. Integrate testing throughout the lifecycle (TDD/BDD, automated checks in pipeline). Use feature toggles to decouple deployment from release. Plan and automate rollback procedures.
Being aware of these anti-patterns allows teams to proactively design processes and pipelines that avoid them, leading to a more effective and sustainable CI/CD implementation.
Integrating QA: Finding the Right Balance in a Fast-Paced World
How does traditional Quality Assurance fit into a world of continuous delivery? Firing the QA team is rarely the answer; their skills remain crucial, but their role evolves.
- Shift Left: QA professionals should be involved earlier in the development cycle. They collaborate with Product Owners and Developers on requirements, define acceptance criteria, and help design for testability before code is written.
- Focus on Higher-Order Testing: As repetitive regression checks become automated, QA focuses on activities requiring human insight:
- Exploratory Testing: Probing the application creatively to uncover unexpected issues or usability problems.
- Usability Testing: Evaluating the user experience.
- Security Testing: Identifying vulnerabilities.
- Performance Testing Strategy: Defining and overseeing performance and load tests (often automated but requiring careful design).
- Test Strategy Definition: Designing the overall approach to quality, including deciding which tests to automate at which level (unit, integration, end-to-end).
- Building Automation: QA engineers often become key contributors to building and maintaining the automated test suites, particularly for integration and end-to-end tests. They bring a tester's mindset to automation design.
- Staggered Testing / Release Gates (If Needed): Full continuous deployment (every commit to prod) isn't always feasible or desirable. You can implement Continuous Delivery where every commit is built, tested, and deployed to a staging environment, but a final push to production requires a manual approval or follows a regular cadence (e.g., daily, weekly). This provides a window for:
- Targeted Manual Testing: QA can run focused manual or exploratory tests on the release candidate in a stable, production-like environment (e.g., staging or PPE).
- Bug Bashes: Periodic sessions where the whole team tests upcoming features.
- Collaboration is Key: Developers should perform basic testing on their own changes. QA can guide developers on testing techniques and help identify areas needing more test coverage. Pairing developers and testers can be highly effective.
The goal is not to eliminate QA but to integrate quality practices throughout the entire lifecycle, leveraging automation for speed and consistency while reserving human expertise for tasks requiring critical thinking and exploration. The exact balance depends on the product's risk profile, regulatory requirements, and team capabilities.
Taming the Beast: CI/CD for Legacy Systems and Monolithic Applications
Applying CI/CD to older, large, or tightly-coupled systems presents unique challenges, but it's often possible and highly beneficial. The approach needs to be adapted.
Challenges:
- Limited Modularity: Tightly coupled components make independent testing and deployment difficult. A change in one area might have unforeseen impacts elsewhere.
- Lack of Test Coverage: Legacy systems often have sparse or non-existent automated test suites, making changes risky. Adding tests can be hard due to complex dependencies or untestable code.
- Slow Builds/Tests: Building and testing the entire monolith can take hours, destroying the fast feedback loop.
- Outdated Technology: May rely on old languages, frameworks, or infrastructure that lack good support from modern CI/CD tools.
- Complex Deployments: Manual, intricate deployment processes are common.
- Resistance to Change: Teams may be accustomed to long release cycles and wary of changing established (though perhaps inefficient) processes.
Strategies:
- Don't Boil the Ocean – Start Incrementally: Begin with foundational steps. Get the code into modern version control. Automate the existing build process, even if it's slow. Add basic smoke tests.
- Prioritize Characterization Tests: Before refactoring, add high-level tests (often integration or end-to-end) that "characterize" the existing behavior. These tests act as a safety net, ensuring that refactoring efforts don't break critical functionality, even if you don't understand all the internal details.
- Find the Seams and Refactor Gradually: Look for logical boundaries within the monolith. Can you isolate components? Use techniques like:
- Strangler Fig Pattern: Gradually build new functionality as separate services that intercept calls to the old monolith. Over time, the new services "strangle" the old system.
- Dependency Injection/Interfaces: Introduce interfaces between components to decouple them, making them easier to test and replace independently.
- Optimize the Build:
- Caching: Aggressively cache dependencies and build outputs where possible.
- Parallelization: Can different modules or test suites be built/run in parallel?
- Incremental Builds: Utilize tools that only rebuild changed portions of the code.
- Containerize: Use Docker (or similar) to package the legacy application and its dependencies. This creates a consistent, portable environment that simplifies integration with modern CI/CD tools, even if the underlying tech is old.
- Focus on Deployment Automation: Even if builds are slow, automating the deployment process itself can yield significant benefits by reducing manual errors and deployment time. Implement reliable rollback mechanisms.
- Build Confidence Slowly: Start by automating deployment to test environments. Gradually increase the frequency and scope of automation as confidence grows. Full continuous deployment might be a long-term goal, but achieving reliable CI and automated deployment to staging is a major win.
Applying CI/CD to legacy systems is often a journey of gradual improvement and refactoring, rather than a quick switch. Patience, persistence, and a focus on incremental gains are key.
Controlling Complexity: Avoiding Pipeline Sprawl
As an organization adopts CI/CD, particularly in larger projects or microservice architectures, the number of pipelines can multiply rapidly. Without careful management, this leads to "pipeline sprawl."
Problems with Sprawl:
- Redundancy and Inconsistency: Similar logic (e.g., build steps, security scans, deployment patterns) gets copied and pasted across many pipelines, leading to maintenance nightmares and inconsistent implementations.
- Maintenance Burden: Updating a common process requires changes in dozens or hundreds of individual pipeline files.
- Security Risks: Outdated or insecure configurations might persist in older, unmanaged pipelines.
- Cost Inefficiency: Multiple pipelines might use separate, underutilized pools of build agents.
- Lack of Standardization: Makes it harder for developers moving between teams to understand different pipeline setups.
Strategies for Management:
- Identify Common Patterns: Analyze existing pipelines. What steps or sequences are repeated frequently? (e.g., checkout code, install dependencies, run unit tests, build Docker image, scan image, deploy to dev).
- Create Reusable Components/Templates: Most modern CI/CD platforms allow creating reusable components:
- Shared Scripts: Abstract common logic into scripts (Bash, Python, PowerShell) stored in a shared repository and called by pipelines.
- Pipeline Templates/Includes: Define reusable pipeline snippets or entire templates that can be imported or extended by individual project pipelines (e.g., GitHub Actions reusable workflows, Azure DevOps templates, GitLab includes).
- Custom Tasks/Plugins: Develop custom tasks or plugins for your CI/CD platform to encapsulate complex, reusable logic.
- Establish a "Pipelines Library": Create a central, version-controlled repository for these shared scripts, templates, and custom tasks. Treat this library like any other critical software project.
- Promote Standardization: Define organizational standards or best practices for common pipeline tasks. Encourage teams to use the shared library components.
- Lifecycle Management: Implement processes for managing pipelines over time:
- Inventory: Keep track of existing pipelines and their owners.
- Deprecation: Have a clear process for phasing out old or unused pipelines. This might involve:
- Notifying users.
- Adding warnings or randomized failures to deprecated pipelines.
- Reducing allocated resources (e.g., fewer runners).
- Setting a firm decommissioning date.
- Revoking associated secrets/tokens and cleaning up dependent resources.
- Review: Periodically review pipelines for efficiency, security, and adherence to standards.
Effective pipeline management requires treating pipeline code as first-class code, applying principles of modularity, reusability, and lifecycle management.
When Is the Migration "Done"? Embracing the Continuous
Given that CI/CD is about continuous improvement, when can you declare the initial migration project "done"? This touches on the Sorites Paradox – when does a heap of sand cease to be a heap as you remove grains one by one? There's inherent ambiguity.
- Goal-Oriented View: Success should be tied back to the measurable goals defined at the start. Has lead time decreased significantly? Is deployment frequency meeting targets? Is the change failure rate acceptable? Achieving these core goals can mark the end of the initial transformation project.
- Incremental Value: Unlike some projects with a single, absolute deliverable, CI/CD provides value incrementally. Even partial implementation (e.g., solid CI but not full CD) yields benefits. Recognize and celebrate these milestones.
- Consensus vs. Reality: While team consensus on practices is important, ensure the actual practices align with CI/CD principles. Avoid "cargo cult" CI/CD where rituals are followed without understanding or achieving the underlying goals.
- The Need for a Cutoff: Practically, there needs to be a point where the dedicated "migration initiative" concludes, and CI/CD becomes the standard operating procedure. This prevents migration tasks from proliferating indefinitely and allows resources to shift back to regular business activities. This cutoff is usually tied to achieving the primary, pre-defined business goals.
- It's Never Truly "Done": While the initial project ends, the practice of CI/CD requires continuous refinement, maintenance, and adaptation as technology, processes, and business needs evolve. Improvement is ongoing.
Define clear, measurable completion criteria for the migration project based on your initial business drivers, but recognize that optimizing and maintaining the CI/CD capability is a continuous, ongoing effort.
Okay, let's craft the concluding sections of the chapter, focusing on specific persistent challenges like database migrations, practical choices, and the essential activities required after the initial setup.
Persistent Challenges: The Database Dilemma
One of the most frequently cited technical hurdles in achieving smooth continuous delivery, especially for stateful applications, is managing database schema changes. While application code can often be deployed and rolled back relatively easily, database changes are often harder to reverse and can require careful coordination.
The Problem:
- Irreversibility: Many schema changes (like dropping a column or table) are destructive and difficult or impossible to undo without data loss once applied, especially if new data has been written.
- Coupling: Application code often depends directly on a specific database schema version. Deploying code that expects a schema change before the change is applied (or vice versa) leads to errors.
- Zero-Downtime Difficulty: Applying schema changes, particularly on large tables, can require locking tables or taking the database offline, conflicting with the goal of zero-downtime deployments.
- Fear and Ad-hoc Processes: As noted in studies (e.g., comparing Facebook and OANDA), fear surrounding database changes can lead to ad-hoc, manual processes, delaying deployments and increasing risk. Schema changes might accumulate, leading to large, risky migration scripts.
Strategies for Mitigation:
- Evolutionary Database Design: Design schemas with future changes in mind. Avoid overly complex constraints initially if simpler alternatives exist.
- Expand/Contract Pattern (Parallel Change): This is a key technique for zero-downtime changes:
- Expand: Add the new schema elements (e.g., new columns, new tables) alongside the old ones. Deploy application code that can write to both old and new structures but continues to read from the old.
- Migrate: Run a data migration process (online or offline, depending on scale) to populate the new structures based on data in the old ones.
- Switch Read: Deploy application code that now reads from the new structures (but can still handle data in the old structure if necessary).
- Contract: Once confident, deploy application code that no longer interacts with the old structures.
- Cleanup: Remove the old schema elements.
- Database Migration Tools: Use specialized tools (e.g., Liquibase, Flyway, Alembic for Python/SQLAlchemy, Active Record Migrations in Rails) to manage, version, and apply schema changes automatically as part of the deployment pipeline. These tools help track which changes have been applied to which environment and support rolling forward and sometimes rolling back changes.
- Decoupling: Use techniques like views, stored procedures (used judiciously), or application-level data abstraction layers to reduce direct coupling between application code and the physical table structure.
- Separate Schema Changes: Consider deploying schema changes separately from application code changes, carefully sequencing them.
- Testing: Rigorously test migration scripts in staging environments with production-like data volumes to identify performance issues or unexpected errors before hitting production.
Managing database changes requires discipline, the right tooling, and adopting patterns that allow changes to be applied incrementally and safely alongside application deployments. It's a solvable problem but requires dedicated attention and effort.
Tactical Choices: Cloud vs. Self-Hosted Runners
A practical decision during implementation is where your CI/CD build agents (runners) will operate.
- Cloud-Hosted Runners: Provided by the CI/CD platform vendor (e.g., GitHub-hosted runners, GitLab SaaS runners).
- Pros: Easy setup, managed OS updates, scalability on demand, no infrastructure maintenance overhead for the runners themselves.
- Cons: Can be more expensive at scale (pay-per-minute), potential data egress costs, less control over the environment, might require network configurations to access internal resources.
- Self-Hosted Runners: You manage the infrastructure (VMs, containers, physical machines) where the runner software executes, connecting back to the CI/CD control plane (which might still be cloud-based).
- Pros: More control over the environment (OS, installed software, hardware), potentially lower cost for high utilization or specialized hardware, easier access to internal network resources, can run on-premises if required.
- Cons: Requires infrastructure setup and ongoing maintenance (OS patching, security, scaling), responsible for runner capacity management.
Choosing Factors:
- Security/Compliance: Do builds require access to sensitive on-premises systems that cannot be exposed to the cloud?
- Specialized Hardware: Do builds require specific hardware (e.g., GPUs, mainframes, custom test rigs)?
- Cost: Analyze expected usage patterns; high, constant load might favor self-hosted, while bursty, infrequent load might favor cloud. Factor in maintenance costs for self-hosted.
- Team Capacity: Does the team have the expertise and time to manage self-hosted runner infrastructure?
- Network Latency/Bandwidth: Do builds transfer very large artifacts frequently? Running closer to the data source might be beneficial.
Often, a hybrid approach is used, employing cloud runners for standard builds and self-hosted runners for specialized tasks or those requiring internal network access.
Managing Vendor Lock-in
When adopting CI/CD tools, especially cloud-based platforms, consider the potential for vendor lock-in. Relying heavily on platform-specific features (e.g., proprietary pipeline syntax, integrated services) can make migrating to a different vendor later difficult and costly.
Mitigation Strategies:
- Favor Standard Tooling: Where possible, use industry-standard, open-source tools within your pipeline (e.g., Docker for containerization, Terraform/Pulumi for IaC, standard testing frameworks) rather than relying solely on vendor-specific implementations.
- Abstract Platform Specifics: Use wrapper scripts or configuration layers to minimize direct calls to vendor-specific commands within your core build/test/deploy logic.
- Containerization: Building your application and its dependencies into Docker containers makes the artifact itself more portable across different CI/CD systems and hosting environments.
- Understand the Syntax: While pipeline syntax differs (YAML structure, keywords), the underlying concepts (stages, jobs, scripts, artifacts, secrets) are often similar. Maintain clarity on what each part of your pipeline does, separate from the specific syntax used to express it.
- Periodic Evaluation: Regularly assess if your current platform still meets your needs and evaluate alternatives to understand the migration cost.
While some level of lock-in is often unavoidable for convenience, conscious choices can preserve flexibility for the future.
Life After Migration: Ongoing Management and Improvement
Successfully deploying the initial CI/CD pipeline is just the beginning. Sustaining the benefits requires ongoing effort and attention.
Key Activities:
- Monitoring and Alerting: Continuously monitor pipeline health, build times, test success rates, and deployment status. Set up meaningful alerts for failures or significant performance degradation. Also, monitor the deployed application's health and performance, feeding insights back to development.
- Maintenance: Regularly update CI/CD tools, runner OSs, build dependencies, and test frameworks. Address flaky tests promptly. Refactor pipeline code for clarity and efficiency.
- Documentation: Maintain clear documentation for pipeline configurations, standard procedures, troubleshooting steps, and architectural decisions.
- Incident Management: Have a defined process for responding to pipeline failures or deployment issues. Who is responsible? How are incidents escalated and resolved? Conduct post-mortems to learn from failures.
- Training and Experimentation: Provide ongoing training to keep the team's skills up-to-date. Allocate time for experimentation with new tools, techniques, or pipeline optimizations. Allow developers safe "sandbox" environments to test pipeline changes without affecting production workflows.
- Performance Measurement and Reporting: Continuously track the key metrics defined earlier (Lead Time, Deployment Frequency, Change Failure Rate, MTTR). Report on progress and identify areas for further improvement.
- Security Auditing: Regularly review pipeline configurations, permissions, and secrets management practices for security vulnerabilities.
- Cost Management: Monitor resource consumption (runners, storage, network) and optimize for cost-efficiency.
- Governance: Establish clear ownership for pipelines and processes. Define policies for creating new pipelines or modifying existing ones, balancing team autonomy with organizational standards (especially relevant for controlling pipeline sprawl).
Treating your CI/CD infrastructure and processes as a living system that requires care and feeding is essential for long-term success.
Connecting to Value: The Ultimate Business Consideration
Throughout the journey – from initial consideration to ongoing maintenance – always tie CI/CD efforts back to business value. Faster deployments or more frequent integrations are means, not ends.
- Are faster releases leading to increased customer satisfaction or retention?
- Is improved stability reducing operational costs or customer support load?
- Is faster feedback enabling better product decisions and quicker adaptation to market changes?
- Is improved developer productivity translating into more features delivered or higher innovation rates?
Continuously ask "So what?" regarding your CI/CD metrics. If you deploy 10 times a day but stability plummets or customer value doesn't increase, the implementation needs re-evaluation. The ultimate justification for the investment in CI/CD lies in its ability to help the business achieve its strategic goals more effectively. Avoid claiming CI/CD benefits without evidence; accurately represent your processes and their outcomes.
Summary: Key Considerations for Your CI/CD Journey
Adopting Continuous Integration and Continuous Deployment/Delivery is a strategic undertaking with profound implications for a business. It's far more than a technical upgrade; it's a shift in culture, process, and mindset aimed at delivering value faster and more reliably. Before embarking on or continuing this journey, businesses must carefully consider:
- The "Why": Clearly define the business problems you aim to solve or the goals you seek to achieve (e.g., faster time-to-market, improved stability, increased innovation). Avoid adopting CI/CD just for trends.
- Readiness and Fit: Honestly assess if CI/CD is appropriate for your context. Highly regulated environments, resource constraints, or extremely stable products with infrequent changes might warrant a different approach or only partial adoption.
- Cultural Shift: Recognize that success requires breaking down silos, fostering collaboration, embracing automation, promoting shared responsibility, and ensuring psychological safety. People issues must be addressed.
- Systems Thinking: View the delivery process holistically. Optimizing one part in isolation can create downstream problems. Address root causes of bottlenecks.
- Measurable Goals: Define clear metrics to track your current state and measure progress towards tangible business outcomes (Lead Time, Deployment Frequency, Change Failure Rate, MTTR).
- Gradual Adoption: Implement CI/CD incrementally, starting with foundational practices like version control, automated builds, and testing, then gradually automating deployment and refining processes.
- Technical Foundations: Ensure prerequisites like version control, automated testing, testable architecture, and infrastructure automation are in place or planned for.
- Addressing Challenges: Be prepared to tackle specific hurdles like database schema migrations, managing legacy systems, and avoiding common anti-patterns (e.g., ignoring failures, inconsistent environments).
- Ongoing Investment: CI/CD is not "set and forget." Budget time and resources for continuous maintenance, monitoring, training, and improvement of pipelines and processes. Treat your delivery system as a product.
- Business Value: Continuously link CI/CD efforts and metrics back to tangible business value and strategic objectives.
By thoughtfully navigating these considerations, businesses can harness the power of CI/CD not just as a set of tools, but as a strategic capability to build better software faster, adapt to changing markets, and ultimately achieve greater success.
Vendor Lock-in in CI Pipelines
CI pipelines are a common place to accumulate vendor-specific constructs. Steps using GitHub-specific actions (like actions/upload-artifact) cannot easily be run locally or migrated to another platform. Consider the following:
- CI pipelines (build, test, lint) benefit from staying portable. Use standard shell commands where possible, and avoid GitHub-specific actions for steps you may want to run locally.
- CD pipelines (deploy, release) are more difficult to make portable and often do not need to be run locally. Accepting some vendor lock-in at the deployment stage is a reasonable trade-off.
- Using a Makefile or a simple shell script as the "entrypoint" for build steps lets you call the same logic from GitHub Actions, locally, or from another CI system.
Migrating from Azure Pipelines to GitHub Actions
If you are moving code from Azure DevOps to GitHub but are not ready to migrate CI pipelines at the same time, you can install the Azure Pipelines GitHub App. This lets Azure DevOps continue to own the pipeline while triggering it from GitHub events (pushes, pull requests). Your team can then manage code, pull requests, and issues fully in GitHub, and migrate individual pipelines to GitHub Actions incrementally without disrupting the business.
This approach is useful when:
- The business requires an audit trail that currently lives in Azure DevOps.
- Some pipelines are complex and need time to be rewritten.
- Different teams are at different stages of their migration.
The Open-Core Model
The open-core model is a business strategy where the core of a product is open source, but additional features — typically enterprise-focused — are offered under a proprietary license. It combines the benefits of open-source development (community contributions, transparency, trust) with a sustainable commercial revenue stream.
Further Reading
- The Cathedral & the Bazaar by Eric Raymond — foundational essay on open-source development culture.
- Producing Open Source Software by Karl Fogel — practical guide to running a successful open-source project.
- Open Core Business Model Handbook — detailed framework for structuring open-core products.
- Grafana: OSS vs Cloud — Grafana Labs' own explanation of their model.
- Archetypes of Open-Source Business Models (Springer) — academic taxonomy.
Video explanations: What does Open Core mean? | Open Core vs Proprietary SaaS | GitLab's Bet on Buyer-based Open Core
Structuring Your Open-Core Repository
Scenario A: Proprietary plugins or small feature additions
If the proprietary components are small (extra integrations, enterprise authentication providers, admin dashboards), keep the open-source core as the primary repository and expose well-defined extension points. The proprietary additions are published as separate packages or plugins that consume the public core as a dependency.
Scenario B: Heavy-duty proprietary integration
If the proprietary code is deeply integrated (different application behavior, licensing enforcement, white-labeling), you need a more structured sync between a public and a private repository:
- Do all work in the public repo by default. Only proprietary-specific code lives in the private repo.
- The public repo's
mainbranch is automatically synced to apublicbranch in the private repo (via a PAT stored as a GitHub secret and a push step in CI). - Copybara is a Google tool designed for this — it transforms and moves code between repositories, handling include/exclude rules cleanly.
# In the public repo's workflow — push main to the private repo's public branch
- name: Sync to private repo
  run: |
    git remote add private https://x-access-token:${{ secrets.PRIVATE_REPO_PAT }}@github.com/your-org/private-repo.git
    git push private main:public --force
  env:
    PRIVATE_REPO_PAT: ${{ secrets.PRIVATE_REPO_PAT }}
Before open-sourcing: Audit the full git history for secrets, credentials, and internal hostnames. A leaked credential in git history is as dangerous as one in live code.
Companies Using the Open-Core Model
| Company | Open-source core | Proprietary layer |
|---|---|---|
| GitLab | GitLab Community Edition (CE) | Enterprise Edition (EE) |
| HashiCorp | Terraform, Vault, Consul | Enterprise editions |
| Docker | Docker Engine, Docker Compose | Docker Business/Enterprise |
| Elastic | Elasticsearch, Kibana | Elastic Cloud, proprietary features |
| MongoDB | MongoDB Community | Atlas managed service |
| CockroachDB | CockroachDB Core | CockroachDB Enterprise |
| Grafana Labs | Grafana OSS | Grafana Cloud, Enterprise features |
Podcast Key Points: Complexity and Overcoming Blockers
Complexity
From the Continuous Delivery Podcast: Complexity episode
What is complexity?
- Many dependencies, unreachable stakeholders, and external factors contribute to difficulty.
- Inability to foresee how changes will impact the system.
- Simple changes requiring extensive coordination and effort.
- Difficulty understanding code structure, duplication, and fear of unintended consequences.
Causes: Technical debt and legacy code; overly complex frameworks; designing for unknown future needs; Conway's Law (system complexity mirrors organizational complexity).
Combating complexity: Merciless refactoring; true DevOps adoption (empowering developers to build automation); tight feedback loops with frequent feedback from product and end-users.
Tracking complexity: Cyclomatic complexity, maintainability index, time to implement changes, throughput measurement, number of code changes to fix a single bug.
Overcoming Blockers
From the Continuous Delivery Podcast: Overcoming Blockers episode
Common blockers: Penetration testing as a bottleneck; bureaucracy in tool acquisition; fear and blame culture; outdated policies (code freezes, mandatory handoffs); lack of slack time.
Solutions: Challenge assumptions and policies; focus on education and collaboration; start small with experiments; iterative improvement and automation; leadership buy-in; build trust through collaboration; advocate for dedicated time to experiment.
Overall conclusion: While technical challenges exist, the most significant roadblocks to Continuous Delivery are often rooted in organizational culture, outdated policies, and a lack of slack. Overcoming them requires a shift in mindset, open communication, and a commitment to continuous improvement.
Below is a tighter, clearer version of your chapter. I preserved all substantive content, removed filler, fixed grammar and formatting, and turned free‑form lists into clean tables. I also corrected the GitHub Actions example so it actually surfaces the release_id.
Comparison of Versioning Solutions
| Tool | What it does | Versioning | Automation stage | Ecosystem | Pros | Cons |
|---|---|---|---|---|---|---|
| GitVersion | Derives semantic versions from Git history, branches, and tags. | SemVer | Build‑time | .NET, CLI | Very flexible; handles complex branching strategies. | Can be complex to configure; requires understanding your branching model. |
| standard-version | Bumps versions, writes changelog, creates Git tags from Conventional Commits. | SemVer | Commit/Release | JavaScript | Simple; enforces consistent commit messages. | Less flexible; requires strict Conventional Commits. |
| semantic-release | Fully automates versioning, changelog, GitHub/GitLab releases, and publishing from Conventional Commits. | SemVer | Continuous Deployment | JavaScript | End‑to‑end automation; consistent releases. | Initial setup can be tricky; assumes strong CD discipline. |
| Nerdbank.GitVersioning | Embeds version metadata via MSBuild; versions from Git. | SemVer | Build‑time | .NET | Lightweight and easy for simple projects. | Fewer knobs than GitVersion. |
| minver | Infers SemVer from Git tags; supports pre‑releases. | SemVer | Build‑time | .NET | Minimal config; quick start. | Limited control over versioning logic. |
| conventional-changelog | Generates changelogs from Conventional Commit messages. | n/a | n/a | JavaScript | Decouples changelog generation from versioning. | Requires Conventional Commits. |
| release-please | Opens release PRs and automates versioning from Conventional Commits and labels. | SemVer | GitHub Actions | JavaScript | Smooth GitHub integration; PR‑driven flow. | Tied to GitHub; Conventional Commits assumed. |
| changesets | Manages version bumps/changelogs in (mono)repos via small “changeset” files. | SemVer | Release | JavaScript | Great for monorepos; granular control per package. | Extra steps; can feel heavy for small projects. |
| release-it | General‑purpose release automation with rich plugin ecosystem. | Customizable | Release | JavaScript | Highly customizable; fits many workflows. | Requires more configuration than opinionated tools. |
Choosing the right tool
- Simplicity first: For straightforward .NET repos and simple branching, minver or Nerdbank.GitVersioning are often enough.
- Conventional Commits: If you already enforce them, prefer standard‑version, semantic‑release, or release‑please.
- Fully automated CD: semantic‑release is the most “hands‑off.”
- Monorepos: changesets shines for multi‑package workspaces.
- Maximum flexibility: GitVersion and release‑it give you the most control.
Example: minimal release workflow (GitHub Actions)
This demonstrates wiring a human‑triggered release with a staging step and an optional production promotion. It also fixes the
release_idoutput so later jobs can use it.
name: Deployment
on: workflow_dispatch: inputs: releaseType: description: "Where to deploy?" type: choice required: true options:
- staging
- production
concurrency: group: ${{ github.workflow }}-${{ github.ref }} cancel-in-progress: false
jobs: create_release:
Only create a GitHub Release when targeting production
if: ${{ github.event.inputs.releaseType == 'production' }} runs-on: ubuntu-latest permissions: contents: write outputs: release_id: ${{ steps.create_release.outputs.release_id }} steps:
- name: Create Release
id: create_release
uses: actions/github-script@v7
with:
script: |
const tag =
v${Date.now()}; // Example tag; customize to your scheme. const release = await github.rest.repos.createRelease({ owner: context.repo.owner, repo: context.repo.repo, tag_name: tag, name: 'Production Release', body: 'New production release', draft: false, prerelease: false }); core.setOutput('release_id', release.data.id.toString());
staging: runs-on: ubuntu-latest environment: name: staging url: https://github.com steps:
- name: Check out repository uses: actions/checkout@v4
- name: Deploy to Staging run: |
echo "Deploying to staging..."
sleep 5
production: needs: [staging, create_release] if: ${{ github.event.inputs.releaseType == 'production' }} runs-on: ubuntu-latest environment: name: production url: https://github.com steps:
- name: Check out repository uses: actions/checkout@v4
- name: Deploy to Production run: |
echo "Deploying to production with release ID: ${{ needs.create_release.outputs.release_id }}"
sleep 5
Importance of versioning
- Traceability & reproducibility: Tie a deployed artifact to the exact source revision and build environment. This is essential for bug reproduction, rollbacks, audits, and incident response.
- Quality & debugging: Testers and developers must reference specific versions to reproduce and fix issues reliably.
- Documentation & marketing: Docs, release notes, and launch materials should map to a version and feature set, especially across large or multi‑team initiatives.
- Security & compliance: When a vulnerability emerges, version history lets you determine exposure windows and precisely identify affected releases.
- Multi‑version support: If you serve multiple customer segments or platforms, versions help you support several lines in parallel.
- Communication: Clear, visible version identifiers prevent confusion (“which build is this?”) and help teams celebrate milestones.
Practical tips
- Ensure the running version is easy to see (CLI flag, UI footer, health endpoint, etc.).
- Use unique, comparable identifiers (avoid ambiguous glyphs like
l,I,1,|; avoid unsupported special characters). - Don’t embed private information in version strings.
- Be consistent. You can change schemes later, but do so infrequently and decisively.
Role of dependency managers & artifact repositories
- Why artifact repos (vs only Git): Artifacts should be immutable and centrally discoverable. Git history can be rewritten; artifact repos are designed for immutable storage, indexing, metadata, checksums, replication, and access control.
- Dependency resolution: Package managers read manifests/lockfiles, resolve version constraints and dependency trees, and fetch the exact versions needed.
- Security & integrity: Registries provide checksums, provenance, and allow vulnerability scanning across dependency graphs; this makes it easy to identify what must be upgraded when a CVE lands.
- Operational simplicity: Standardized distribution avoids bespoke install steps, reduces errors, and supports side‑by‑side versions.
- Don’t ship unnecessary files: Store only what’s required to run; avoid committing
node_modulesor similar. Prefer lockfiles + registry availability to ensure repeatability. - Treat internal deps like external: Pin, test upgrades in isolation, and only merge when CI passes to avoid “latest breaks latest” churn.
- Artifact mutability rule: Never change a published artifact without a version bump, and update its manifest/metadata when you do.
Ecosystem examples (learn their specifics):
- JavaScript: npm (SemVer ranges like
^1.2.3,~1.2.3),package-lock.json. - Python: pip/PyPI (
==,>=,<=),requirements.txt. - Java: Maven/Gradle (SNAPSHOTs, ranges). See Oracle’s Maven versioning guide: https://docs.oracle.com/middleware/1212/core/MAVEN/maven_version.htm#MAVEN401.
- Ruby: RubyGems/Bundler (
Gemfileconstraints). - Rust: Cargo (
Cargo.toml,Cargo.lock, SemVer). - .NET: NuGet (
PackageReferenceconstraints). - Scala: SBT (cross‑versioning patterns).
Version types: internal builds, release builds, customer builds
- Internal builds: Frequent, short‑lived outputs from branch/PR pipelines used for fast feedback. Often not retained long‑term.
- Release builds: Candidate artifacts destined for customers but not yet GA; may flow through gated or staged pipelines and be retained.
- Customer builds (GA): Published/production releases; retain and index for the long term.
Why pipelines “run a lot,” and what to retain
- Triggers: push to branches, PR open/update, new tags, manual runs.
- PR nuance: CI usually builds the PR as a merge preview with the target branch. Because the target branch can change before merge, rerunning on the target after merge ensures integration still holds.
- Retention: Keep release/tagged artifacts; use shorter retention for branch/PR artifacts; consider cold storage for long‑term retention needs.
Versioning strategies
A good scheme is comparable, communicative, and automatable.
Strategy                         | Pros                                                                                 | Cons
-------------------------------- | ------------------------------------------------------------------------------------ | ---------------------------------------------------------------------
**Semantic Versioning (SemVer)** | Widely understood; communicates breaking vs minor vs patch; integrates with tooling. | Requires discipline; can “inflate” numbers for unstable software.
**Date‑based (YYYY.MM.DD)**      | Instantly shows recency; neutral about change size; pairs well with evergreen apps.  | Doesn’t signal impact; multiple same‑day releases need suffixes.
**Sequential (1, 2, 3…)**        | Simple; always increases; easy to compare.                                           | Conveys little about change impact; can imply “big changes” when not.
**Release trains**               | Predictable cadence; good for large orgs with many dependencies.                     | May force scope/time trade‑offs; doesn’t describe content.
Anti‑patterns (avoid):
- Overlong or visually confusing identifiers (e.g., dozens of repeated characters, ambiguous glyphs).
- Unsupported special characters or overly long tags (breaks Docker/Git constraints).
- Hiding sensitive data in versions.
- “Mostly SemVer” with frequent exceptions—consumers need reliable ordering and compatibility cues.
Build numbers vs versions
- Versions communicate to users/consumers (e.g.,
iOS 17.0.3). - Build numbers identify a specific build (often a checksum or CI build ID) and should be immutable. It’s fine for many builds to share one “marketing” version.
Traceability requirements
- Make it possible to trace an artifact back to: source commit, build tools (optionally), environment, and platform/edition (e.g., add platform or SKU where relevant).
Storing artifacts & retention
- Keep: Customer releases, tagged builds, artifacts needed for rollbacks/regulatory needs.
- De‑prioritize: High‑churn CI intermediates unless needed for short‑term debugging.
- Costs & complexity: Storage isn’t free; transitive dependencies can be hard to untangle if deleted—prefer deprecation over deletion.
- Cold storage: Use cheaper tiers for long‑term archives.
- Snapshots vs releases: Snapshots (“nightlies,” “PR builds”) are usually temporary; releases should be immutable and retained.
- Backups & integrity: Rely on registry checksums, replication, and backups provided by the artifact manager.
- When registries are down: Prefer mirrored registries/caches over committing vendor directories.
How do I version code and Docker images?
- Containers & CI are alike: Both provide clean, stateless environments. Building in Docker ensures consistency with CI runners.
- Tagging strategy: Tags are aliases for specific Git commits. Use them to map source to artifacts and Docker image tags.
Git tagging essentials
- Lightweight tag (pointer only)
```bash
git tag v1.0.0
2. **Annotated tag** (with metadata)

```bash
```bash
git tag -a v1.0.0 -m "First stable release"
3. **Tag an older commit**

```bash
```bash
git tag v0.9 9fceb02
4. **Push tags to remote**

```bash
```bash
git push origin v1.0.0
or push all tags
git push --tags
5. **Delete a tag**

```bash
```bash
git tag -d v1.0.0
git push origin :refs/tags/v1.0.0
> Some CI systems require at least one commit on the branch (PR‑only merge policies). If you need a tag without code changes, use an empty commit:
>
> ```bash
> git commit --allow-empty -m "chore: cut release v1.0.0"
> ```

**Branching note:** If you must maintain multiple supported versions, consider release branches rather than trying to use tags alone on a single trunk; tags are immutable pointers and don’t let you patch old lines without affecting newer ones.

### Docker images

* Docker **images** are the build outputs; **containers** are running instances.
* Use Docker tags to map image versions to Git tags or CI build IDs (e.g., `myapp:1.4.2`, `myapp:2025.09.23`, `myapp:1.4.2-build.123`).
* Publish immutable tags for releases; use moving tags like `latest` only as a convenience, not as the sole reference.

---

## Programming‑language–specific versioning quirks

* **Maven (Java):** SNAPSHOTs, ranges, and ordering rules are unique—see Oracle’s guide: [https://docs.oracle.com/middleware/1212/core/MAVEN/maven\_version.htm#MAVEN401](https://docs.oracle.com/middleware/1212/core/MAVEN/maven_version.htm#MAVEN401).
* **npm (JS):** SemVer ranges (`^`, `~`), `package-lock.json`, and release tooling (e.g., `semantic-release`, `release-please`).
* **pip/PyPI (Python):** PEP 440 specifiers (`==`, `>=`, `<=`), `requirements.txt`.
* **Gradle (JVM):** Dynamic versions, conflict resolution strategies.
* **RubyGems/Bundler (Ruby):** Gem constraints in `Gemfile`, resolver behavior.
* **Cargo (Rust):** Strong SemVer culture, `Cargo.lock` semantics.
* **NuGet (.NET):** Version ranges and `PackageReference` rules.
* **SBT (Scala):** Cross‑versioning patterns and Ivy resolution.

Additional reading (build and POM relationships):

* Oracle: “From Build Automation to Continuous Integration”
* Sonatype: “The Nexus Book” (POM relationships and syntax)

---

### Final reminders

* Keep artifacts immutable; never overwrite a published version.
* Always bump versions when contents change, and stamp manifests/metadata to avoid collisions.
* Prefer automation (commit messages → versions → changelogs → releases) where culture and tooling allow.
* Make the running version obvious to both humans and machines.
Future topics to cover (gap list)
This file is a working backlog of topics not yet fully covered in the current manuscript, based on the “Comprehensive Gap Analysis and Advanced Curriculum for Modern CI/CD Education” outline.
Goal: shift from “workflows as scripts” to pipelines as production software (platform engineering patterns).
Advanced workflow architecture (modular pipelines)
-
Reusable workflows vs composite actions
-
When to use
workflow_callvsruns: using: "composite" -
Interface design: inputs/outputs/secrets contracts
-
Versioning and governance patterns for shared workflows
-
Debuggability trade-offs (step granularity vs encapsulation)
-
Concurrency groups and environment serialization patterns
-
Workflow library design
-
“platform team” model: centrally managed secure build/release workflows
-
organization-wide policy enforcement patterns (required checks + reusable workflows)
Supply chain security (modern baseline)
-
OIDC / federated credentials (death of static cloud secrets)
-
GitHub Actions
permissions: id-token: write -
Trust policies/claims mapping (repo, ref, environment)
-
Least-privilege secret interfaces for reusable workflows
-
SLSA (Supply-chain Levels for Software Artifacts)
-
Provenance generation and verification
-
Signing/attestation concepts
-
Ephemeral runners and hardened builds (why hosted/ephemeral matters)
-
Artifact attestations (e.g., provenance files + signatures)
-
Registry trusted publishing
-
npm provenance / “verified” publishing via OIDC
-
Artifact provenance for containers and packages (beyond “build and push”)
Pipeline observability (beyond logs)
-
OpenTelemetry (OTel) for CI/CD
-
Tracing workflow steps as spans
-
Correlating builds across pipelines/repos
-
Building dashboards from structured events (not just log text)
-
High-cardinality build events
-
Cache metrics, dependency download timings, test shard timing, flaky-test rate
-
Using observability to drive pipeline performance/cost decisions
Scaling CI/CD for large codebases
-
Monorepos vs polyrepos
-
Trade-offs, governance, and pipeline structure
-
Path-aware builds and dynamic matrix generation
-
Tooling: Nx / Turborepo and remote caching patterns
-
Merge queues
-
“rebase race” and why queues exist
-
Batch testing + bisection strategies
-
Required checks + queue integration patterns
IaC automation patterns (platform workflows)
-
IssueOps
-
GitHub Issues/Forms as an infra self-service portal
-
Plan as a comment,
/applyas approval, audit trail patterns -
Drift detection
-
Scheduled
terraform planand alerting/issue creation -
Preventing ClickOps drift from becoming the “real” state
Deployment architecture (GitOps and controllers)
-
Push vs pull deployment models
-
Why “CI has cluster credentials” is risky
-
GitOps flow: CI updates manifests; controller reconciles
-
Argo CD / Flux
-
Image update strategies
-
Self-healing and reconciliation semantics
-
“App of Apps” bootstrapping patterns
AI-augmented pipelines (2025 reality)
-
Agentic PR review
-
AI reviewer as part of CI gating (summaries, risk flags, suggested diffs)
-
Automated test generation
-
Pipeline-driven “coverage gap → test PR” workflow
-
Failure triage / self-healing
-
Classifying failures (flaky vs deterministic vs infra)
-
Auto-retry policies with guardrails
Mobile CI/CD (the “last mile”)
-
Fastlane
-
Lanes inside CI (build, sign, test, upload)
-
Signing identities
-
Cert/provisioning profile handling strategies
-
Secure storage, rotation, and “match”-style patterns
-
Store delivery
-
TestFlight / App Store Connect / Play Store automation
-
Release gates and staged rollout strategies
Platform engineering, governance, and cost
-
Policy & governance at scale
-
Organization-wide rule enforcement (required workflows/checks, rulesets)
-
Compliance/audit trail patterns (SOC2-style evidence)
-
Self-hosted runners at scale
-
Kubernetes runner controllers (ARC-style patterns)
-
Ephemeral runners on your infra (security parity with hosted)
-
FinOps / cost strategy
-
Right-sizing runners, caching ROI, avoiding rebuild storms
-
Concurrency controls to prevent resource contention
Future directions (beyond YAML)
- Programmable pipelines
- Dagger (pipelines as code in real languages)
- “run the exact CI pipeline locally” feedback loop patterns
Open Questions and Tool References to Resolve
The following are open questions and tool links that need to be investigated and worked into the manuscript:
- What about code formatting and linting tasks?
- fkirc/skip-duplicate-actions - Save time and cost when using GitHub Actions
- corretto-8 submit.yml
- prisma/.github/workflows
- GitHub bots to post on comments with test reports
- Ignore paths for pushes such as README.md and other paths (is there a template for this?)
- yplatform main.yml
- arm-oraclelinux-wls-cluster build.yml
- Lots of people use "working-directory" -- document the pattern
- Make sure that if you're running scripts, that someone who makes a PR can't just stick a script in that folder and have it run
- "There's a convention for tagging built images with metadata including the run id, CI event type, and commit sha."
- Updating Docker Hub description automatically
- Docker container security scanning
- The use of actions like jaywcjlove/create-tag-action and ncipollo/release-action to automate version bumping, tagging, and creating GitHub releases based on changes in package.json.
- Changelog generation
- buildx multi-platform builds documentation
- Python instead of Bash for advanced scripting in workflows
- Uploading logs as compliance to GitHub artifacts, BOMs?
- Bats for bash script testing
- Publishing debug symbols to private server
- Versioning tools to evaluate and document: GitVersion, standard-version, semantic-release, Nerdbank.GitVersioning, minver, conventional-changelog, release-please, changesets, release-it